
|
|||||
|
 | |
| |
| |
| |
| |
| |
|
Gene: BUB1 |
Gene summary for BUB1 |
| Gene information | Species | Human | Gene symbol | BUB1 | Gene ID | 699 |
| Gene name | BUB1 mitotic checkpoint serine/threonine kinase | |
| Gene Alias | BUB1A | |
| Cytomap | 2q13 | |
| Gene Type | protein-coding | GO ID | GO:0000003 | UniProtAcc | B4DYG2 |
Top |
Malignant transformation analysis |
| Identification of the aberrant gene expression in precancerous and cancerous lesions by comparing the gene expression of stem-like cells in diseased tissues with normal stem cells |
| Entrez ID | Symbol | Replicates | Species | Organ | Tissue | Adj P-value | Log2FC | Malignancy |
| 699 | BUB1 | LZE2T | Human | Esophagus | ESCC | 4.73e-03 | 7.36e-01 | 0.082 |
| 699 | BUB1 | P2T-E | Human | Esophagus | ESCC | 8.84e-05 | 1.86e-01 | 0.1177 |
| 699 | BUB1 | P4T-E | Human | Esophagus | ESCC | 9.91e-08 | 2.66e-01 | 0.1323 |
| 699 | BUB1 | P5T-E | Human | Esophagus | ESCC | 8.84e-05 | 1.45e-01 | 0.1327 |
| 699 | BUB1 | P10T-E | Human | Esophagus | ESCC | 2.05e-07 | 2.92e-01 | 0.116 |
| 699 | BUB1 | P15T-E | Human | Esophagus | ESCC | 1.31e-02 | 1.68e-01 | 0.1149 |
| 699 | BUB1 | P16T-E | Human | Esophagus | ESCC | 3.50e-02 | 6.32e-02 | 0.1153 |
| 699 | BUB1 | P21T-E | Human | Esophagus | ESCC | 1.97e-10 | 3.20e-01 | 0.1617 |
| 699 | BUB1 | P24T-E | Human | Esophagus | ESCC | 9.44e-07 | 2.50e-01 | 0.1287 |
| 699 | BUB1 | P26T-E | Human | Esophagus | ESCC | 8.84e-05 | 1.78e-01 | 0.1276 |
| 699 | BUB1 | P28T-E | Human | Esophagus | ESCC | 4.17e-05 | 1.31e-01 | 0.1149 |
| 699 | BUB1 | P31T-E | Human | Esophagus | ESCC | 8.40e-04 | 1.22e-01 | 0.1251 |
| 699 | BUB1 | P32T-E | Human | Esophagus | ESCC | 3.60e-13 | 2.92e-01 | 0.1666 |
| 699 | BUB1 | P37T-E | Human | Esophagus | ESCC | 6.65e-04 | 1.63e-01 | 0.1371 |
| 699 | BUB1 | P38T-E | Human | Esophagus | ESCC | 1.93e-04 | 3.04e-01 | 0.127 |
| 699 | BUB1 | P44T-E | Human | Esophagus | ESCC | 2.47e-02 | 1.97e-01 | 0.1096 |
| 699 | BUB1 | P49T-E | Human | Esophagus | ESCC | 7.48e-03 | 4.33e-01 | 0.1768 |
| 699 | BUB1 | P52T-E | Human | Esophagus | ESCC | 4.44e-08 | 1.93e-01 | 0.1555 |
| 699 | BUB1 | P74T-E | Human | Esophagus | ESCC | 2.66e-02 | 2.47e-01 | 0.1479 |
| 699 | BUB1 | P79T-E | Human | Esophagus | ESCC | 1.78e-03 | 1.30e-01 | 0.1154 |
| Page: 1 2 |
| Tissue | Expression Dynamics | Abbreviation |
| Esophagus | 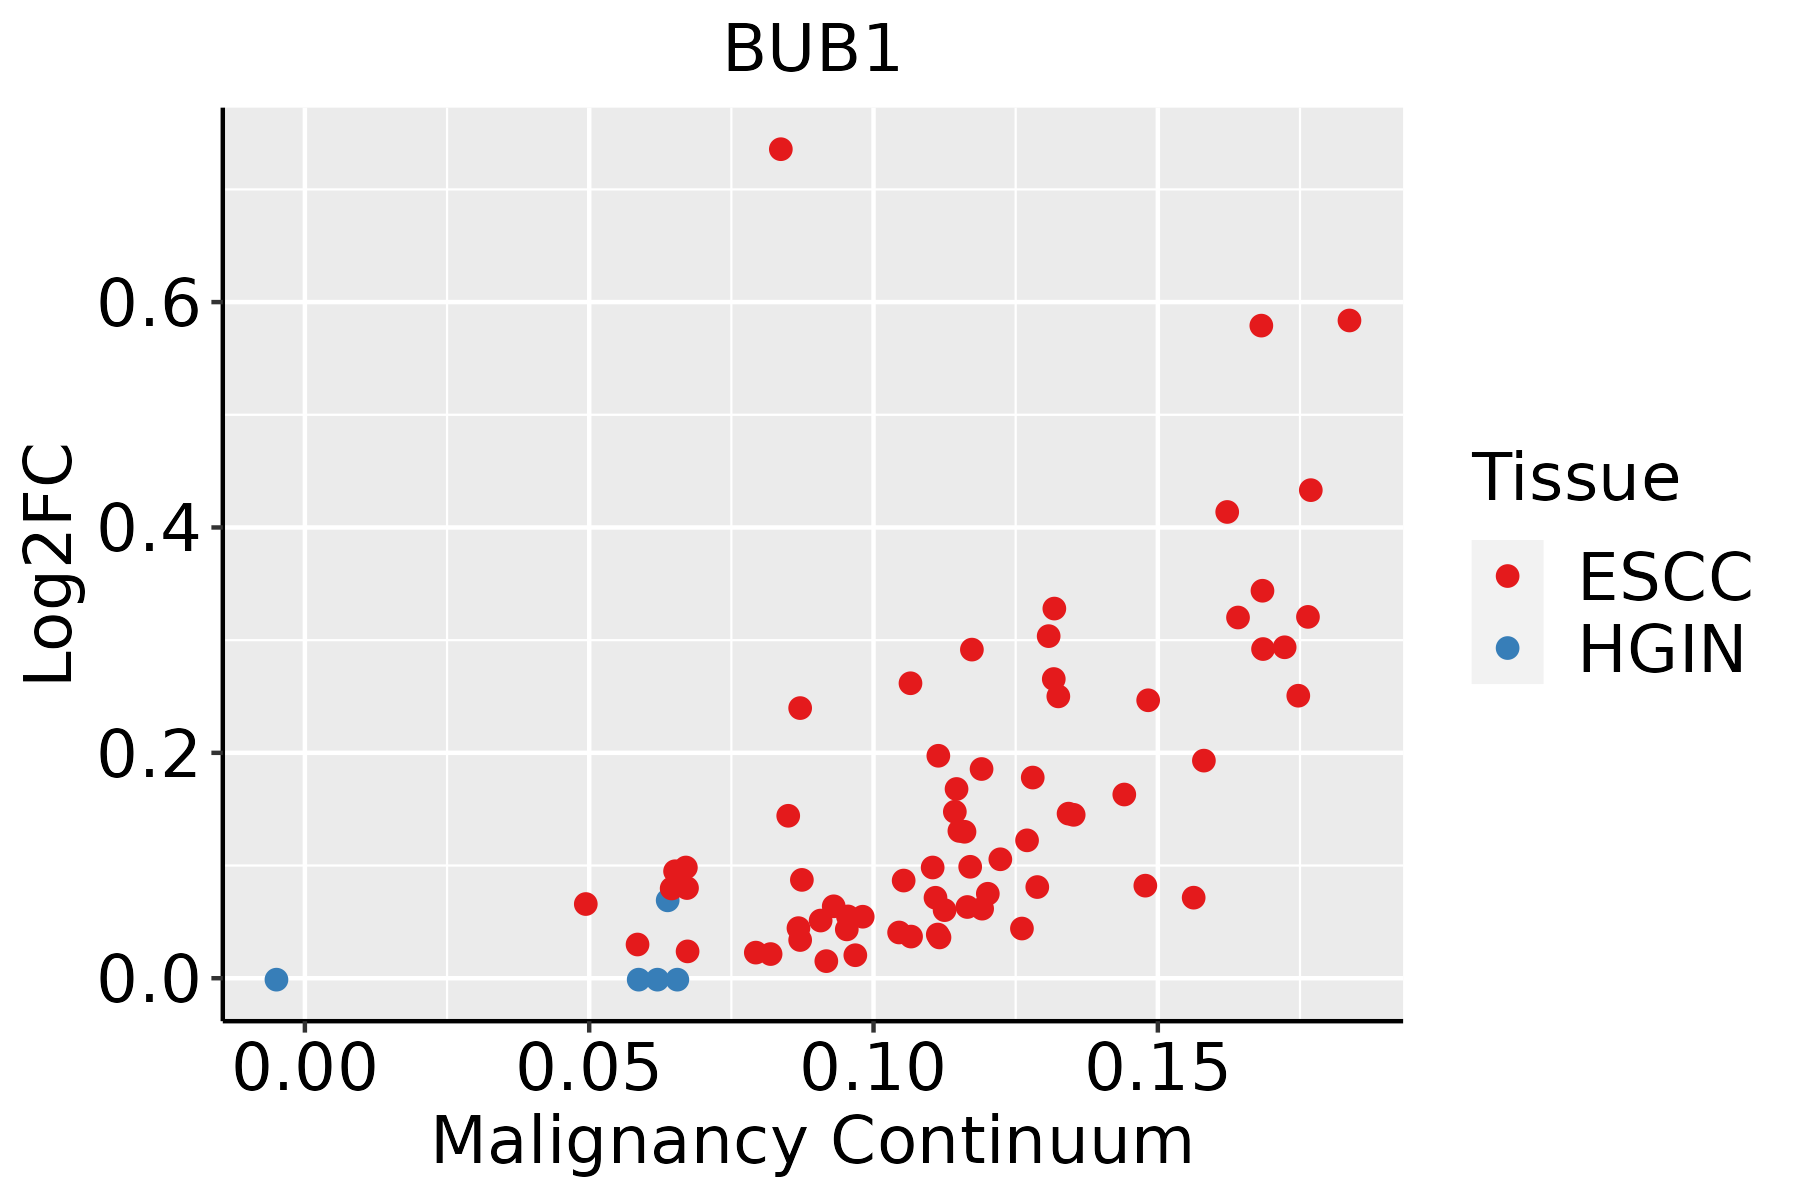 | ESCC: Esophageal squamous cell carcinoma |
| HGIN: High-grade intraepithelial neoplasias | ||
| LGIN: Low-grade intraepithelial neoplasias | ||
| Skin | 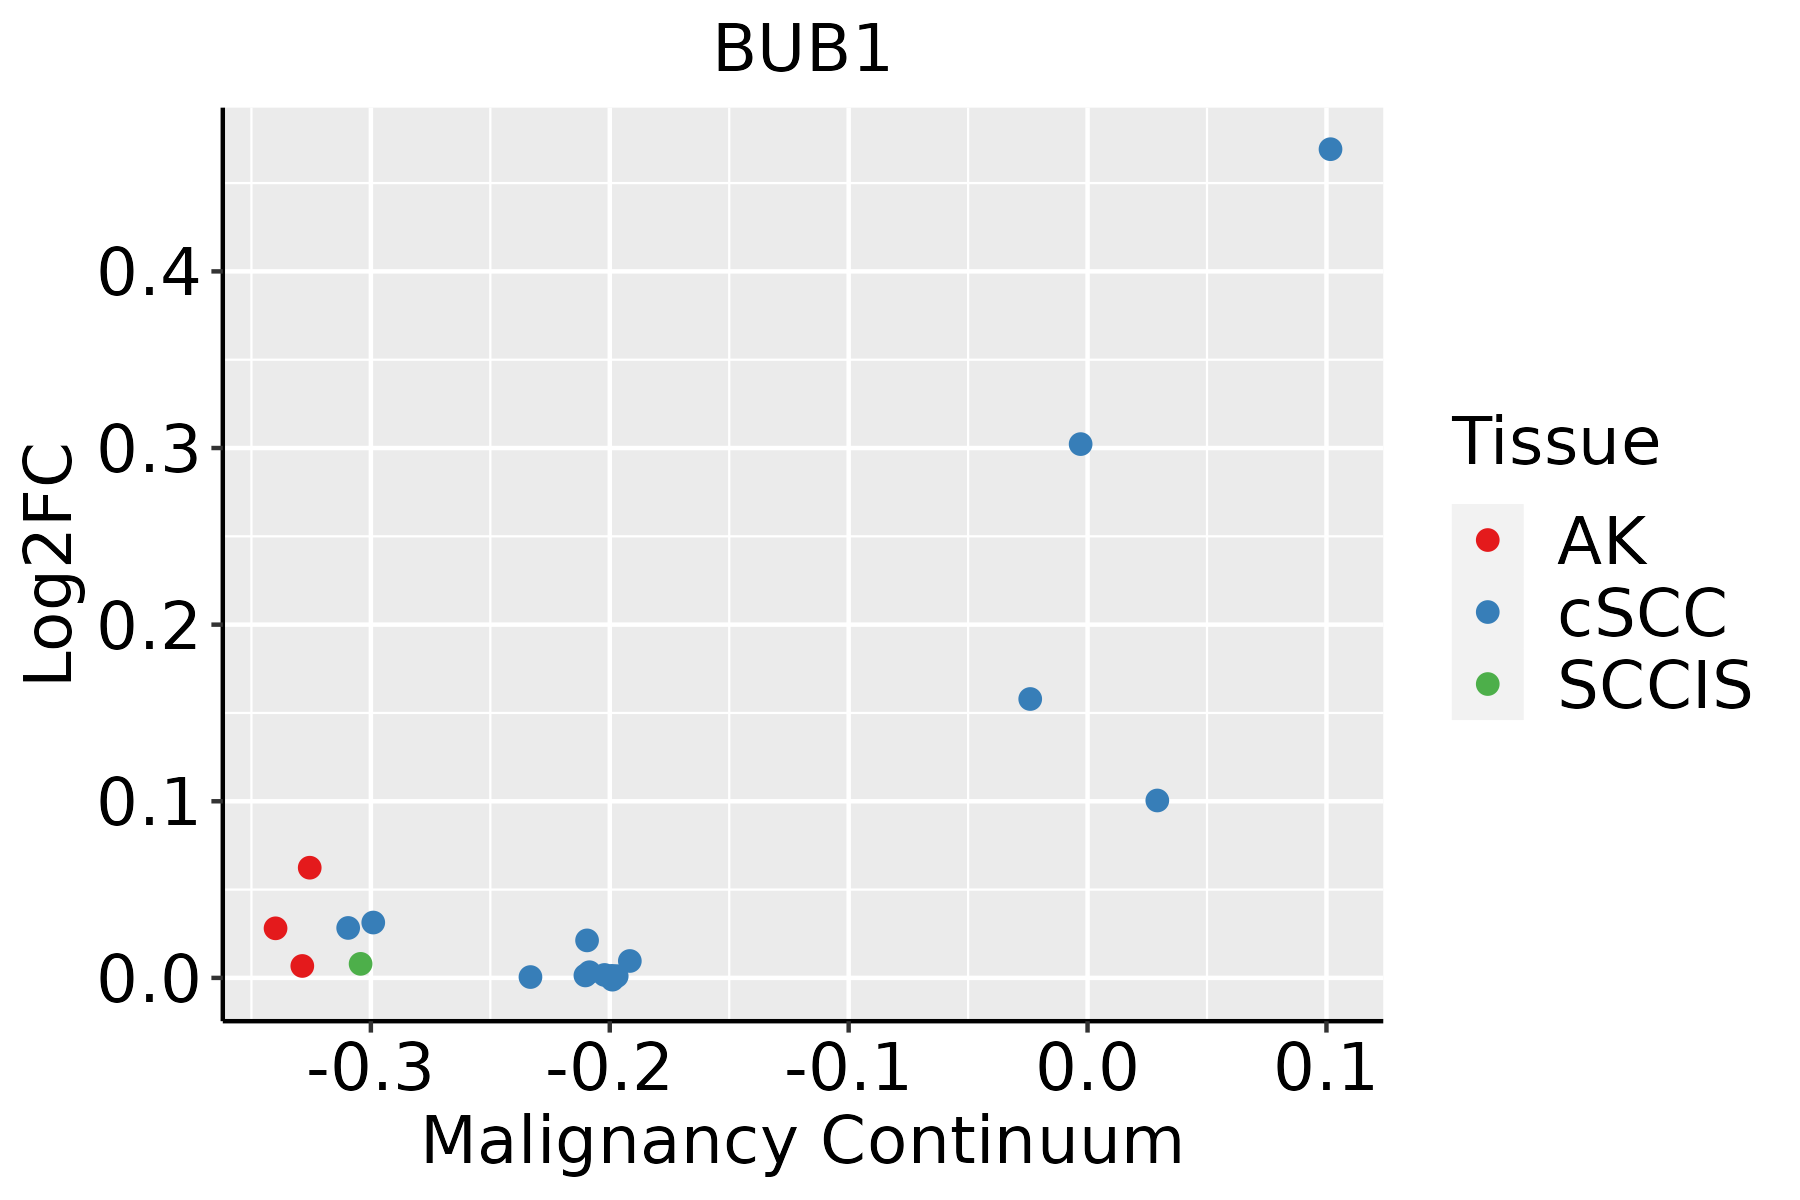 | AK: Actinic keratosis |
| cSCC: Cutaneous squamous cell carcinoma | ||
| SCCIS:squamous cell carcinoma in situ | ||
| Thyroid | 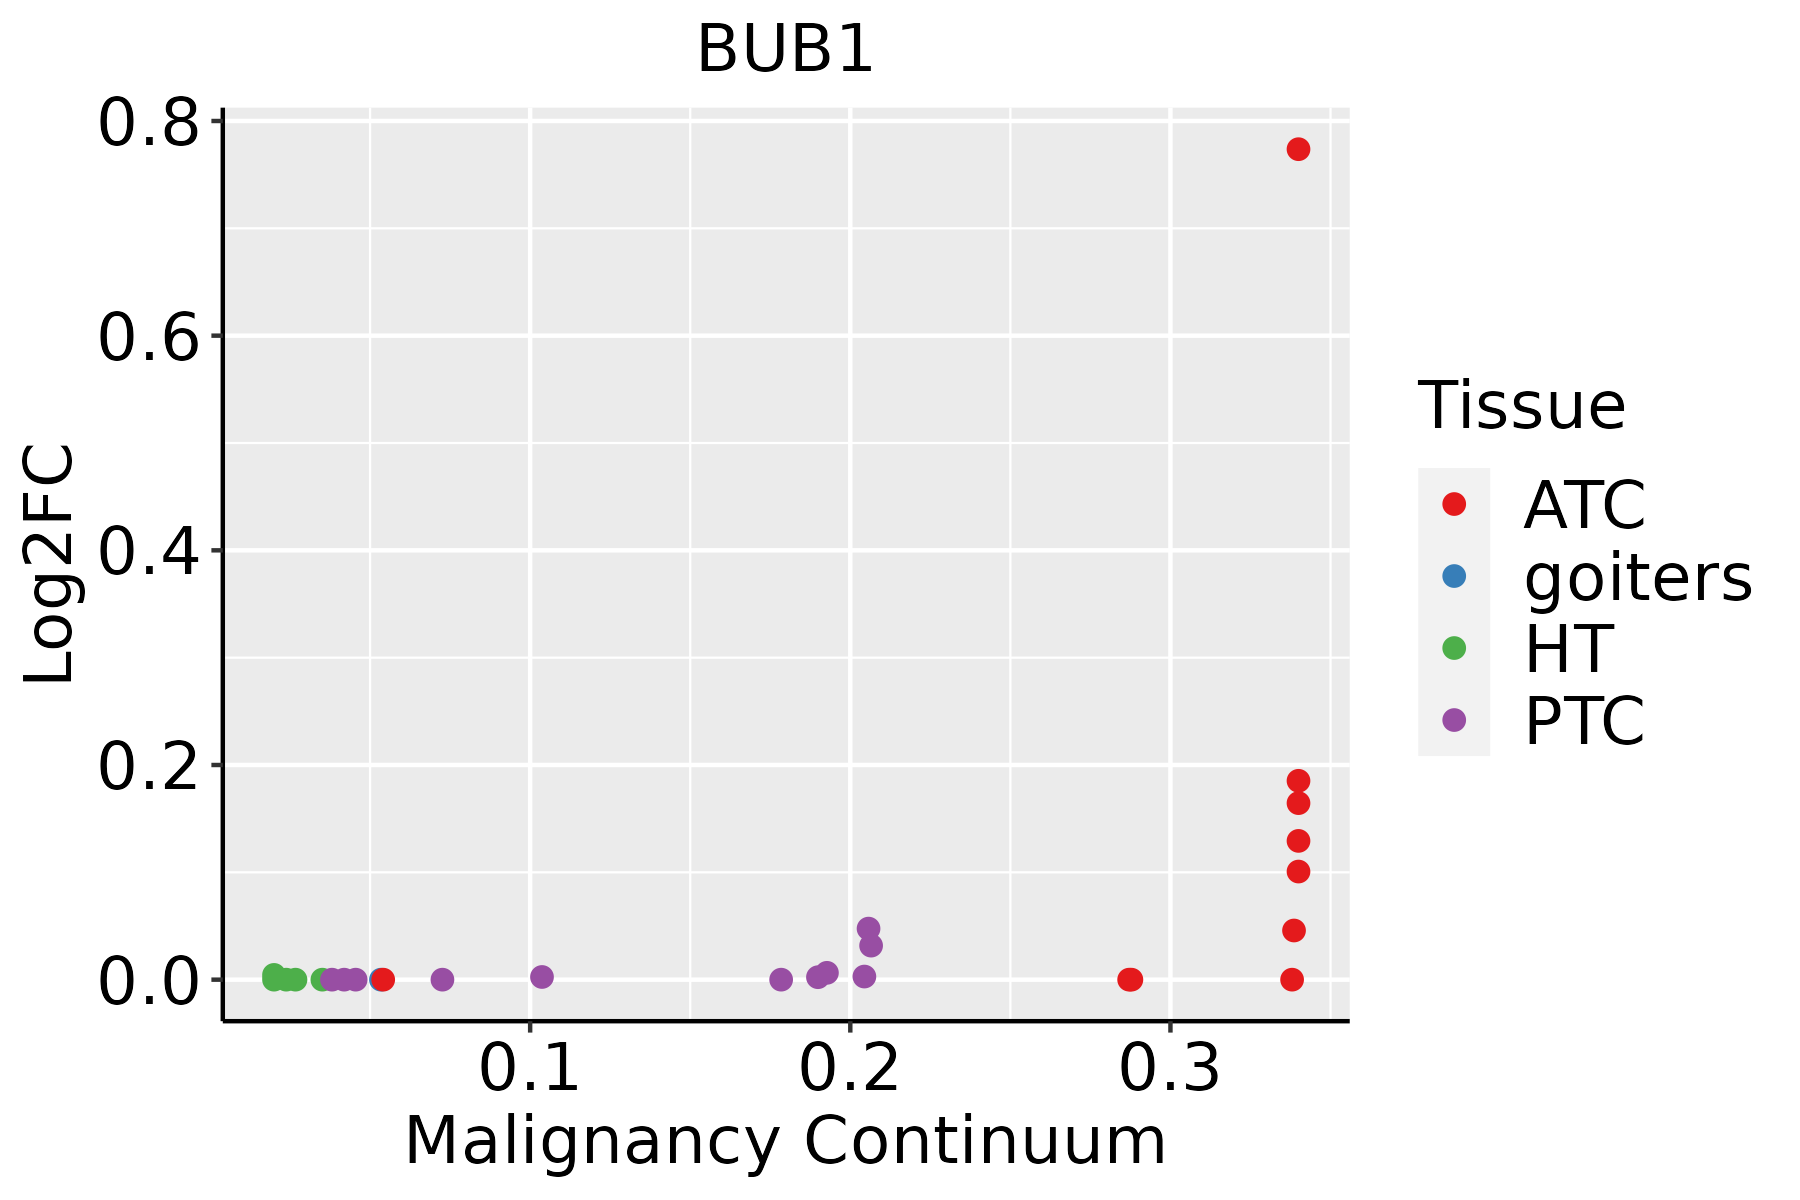 | ATC: Anaplastic thyroid cancer |
| HT: Hashimoto's thyroiditis | ||
| PTC: Papillary thyroid cancer |
| ∗log2FC in expression of this searched gene in stem-like cells from each diseased tissue sample relative to stem-like cells in normal samples in each tissue plotted against the malignancy continuum. Samples are colored based on if they are from different disease stage. |
Top |
Malignant transformation related pathway analysis |
| Find out the enriched GO biological processes and KEGG pathways involved in transition from healthy to precancer to cancer |
| Tissue | Disease Stage | Enriched GO biological Processes |
| Colorectum | AD |  |
| Colorectum | SER |  |
| Colorectum | MSS |  |
| Colorectum | MSI-H |  |
| Colorectum | FAP |  |
| ∗Top 15 enriched GO BP terms are showed in the bar plot of each disease state in each tissue. Each row represents a significant GO biological process which is colored according to the -log10(p.adjust). |
| Page: 1 2 3 4 5 6 7 8 9 |
| GO ID | Tissue | Disease Stage | Description | Gene Ratio | Bg Ratio | pvalue | p.adjust | Count |
| GO:00513043 | Skin | cSCC | chromosome separation | 44/4864 | 96/18723 | 2.05e-05 | 2.40e-04 | 44 |
| GO:00458413 | Skin | cSCC | negative regulation of mitotic metaphase/anaphase transition | 23/4864 | 40/18723 | 2.37e-05 | 2.72e-04 | 23 |
| GO:190198812 | Skin | cSCC | negative regulation of cell cycle phase transition | 94/4864 | 249/18723 | 2.65e-05 | 3.00e-04 | 94 |
| GO:001094812 | Skin | cSCC | negative regulation of cell cycle process | 108/4864 | 294/18723 | 2.75e-05 | 3.09e-04 | 108 |
| GO:00070943 | Skin | cSCC | mitotic spindle assembly checkpoint | 22/4864 | 38/18723 | 3.07e-05 | 3.40e-04 | 22 |
| GO:00711733 | Skin | cSCC | spindle assembly checkpoint | 22/4864 | 38/18723 | 3.07e-05 | 3.40e-04 | 22 |
| GO:00711743 | Skin | cSCC | mitotic spindle checkpoint | 22/4864 | 38/18723 | 3.07e-05 | 3.40e-04 | 22 |
| GO:00330463 | Skin | cSCC | negative regulation of sister chromatid segregation | 24/4864 | 43/18723 | 3.11e-05 | 3.42e-04 | 24 |
| GO:00330483 | Skin | cSCC | negative regulation of mitotic sister chromatid segregation | 24/4864 | 43/18723 | 3.11e-05 | 3.42e-04 | 24 |
| GO:20008163 | Skin | cSCC | negative regulation of mitotic sister chromatid separation | 24/4864 | 43/18723 | 3.11e-05 | 3.42e-04 | 24 |
| GO:000007512 | Skin | cSCC | cell cycle checkpoint | 68/4864 | 169/18723 | 3.37e-05 | 3.67e-04 | 68 |
| GO:00315773 | Skin | cSCC | spindle checkpoint | 22/4864 | 39/18723 | 5.32e-05 | 5.38e-04 | 22 |
| GO:00070935 | Skin | cSCC | mitotic cell cycle checkpoint | 54/4864 | 129/18723 | 5.99e-05 | 5.87e-04 | 54 |
| GO:19021003 | Skin | cSCC | negative regulation of metaphase/anaphase transition of cell cycle | 23/4864 | 42/18723 | 6.79e-05 | 6.58e-04 | 23 |
| GO:00519853 | Skin | cSCC | negative regulation of chromosome segregation | 24/4864 | 45/18723 | 8.34e-05 | 7.94e-04 | 24 |
| GO:19058193 | Skin | cSCC | negative regulation of chromosome separation | 24/4864 | 45/18723 | 8.34e-05 | 7.94e-04 | 24 |
| GO:000706212 | Skin | cSCC | sister chromatid cohesion | 30/4864 | 62/18723 | 1.23e-04 | 1.13e-03 | 30 |
| GO:00070637 | Skin | cSCC | regulation of sister chromatid cohesion | 12/4864 | 21/18723 | 2.40e-03 | 1.38e-02 | 12 |
| GO:014001416 | Thyroid | ATC | mitotic nuclear division | 171/6293 | 287/18723 | 1.13e-19 | 1.66e-17 | 171 |
| GO:003304423 | Thyroid | ATC | regulation of chromosome organization | 119/6293 | 187/18723 | 3.55e-17 | 3.40e-15 | 119 |
| Page: 1 2 3 4 5 6 7 8 |
| Pathway ID | Tissue | Disease Stage | Description | Gene Ratio | Bg Ratio | pvalue | p.adjust | qvalue | Count |
| hsa0411023 | Esophagus | ESCC | Cell cycle | 126/4205 | 157/8465 | 1.34e-15 | 5.60e-14 | 2.87e-14 | 126 |
| hsa041146 | Esophagus | ESCC | Oocyte meiosis | 77/4205 | 131/8465 | 2.19e-02 | 4.80e-02 | 2.46e-02 | 77 |
| hsa0411033 | Esophagus | ESCC | Cell cycle | 126/4205 | 157/8465 | 1.34e-15 | 5.60e-14 | 2.87e-14 | 126 |
| hsa0411411 | Esophagus | ESCC | Oocyte meiosis | 77/4205 | 131/8465 | 2.19e-02 | 4.80e-02 | 2.46e-02 | 77 |
| Page: 1 |
Top |
Cell-cell communication analysis |
| Identification of potential cell-cell interactions between two cell types and their ligand-receptor pairs for different disease states |
| Ligand | Receptor | LRpair | Pathway | Tissue | Disease Stage |
| Page: 1 |
Top |
Single-cell gene regulatory network inference analysis |
| Find out the significant the regulons (TFs) and the target genes of each regulon across cell types for different disease states |
| TF | Cell Type | Tissue | Disease Stage | Target Gene | RSS | Regulon Activity |
| ∗The dot plots of a searched regulon are shown for all cell subpopulations in each disease state of each tissue based on the regulon specific score inferred using pySCENIC and by calculating the average expression. |
| Page: 1 |
Top |
Somatic mutation of malignant transformation related genes |
| Annotation of somatic variants for genes involved in malignant transformation |
| Hugo Symbol | Variant Class | Variant Classification | dbSNP RS | HGVSc | HGVSp | HGVSp Short | SWISSPROT | BIOTYPE | SIFT | PolyPhen | Tumor Sample Barcode | Tissue | Histology | Sex | Age | Stage | Therapy Types | Drugs | Outcome |
| BUB1 | SNV | Missense_Mutation | c.2854N>C | p.Asp952His | p.D952H | O43683 | protein_coding | deleterious(0) | probably_damaging(1) | TCGA-BH-A0HP-01 | Breast | breast invasive carcinoma | Female | >=65 | III/IV | Chemotherapy | doxorubicin | SD | |
| BUB1 | SNV | Missense_Mutation | c.1234N>G | p.Thr412Ala | p.T412A | O43683 | protein_coding | tolerated(0.22) | benign(0) | TCGA-D8-A1XK-01 | Breast | breast invasive carcinoma | Female | <65 | I/II | Chemotherapy | doxorubicine+cyclophosphamide | SD | |
| BUB1 | SNV | Missense_Mutation | c.1426N>G | p.Gln476Glu | p.Q476E | O43683 | protein_coding | deleterious(0) | probably_damaging(0.996) | TCGA-E2-A15H-01 | Breast | breast invasive carcinoma | Female | <65 | I/II | Chemotherapy | herceptin | SD | |
| BUB1 | SNV | Missense_Mutation | rs867863036 | c.2029N>T | p.Arg677Cys | p.R677C | O43683 | protein_coding | tolerated(0.16) | benign(0) | TCGA-C5-A7CL-01 | Cervix | cervical & endocervical cancer | Female | <65 | III/IV | Chemotherapy | cisplatin | PD |
| BUB1 | SNV | Missense_Mutation | novel | c.1513N>G | p.Gln505Glu | p.Q505E | O43683 | protein_coding | tolerated(0.32) | benign(0.13) | TCGA-EA-A3HU-01 | Cervix | cervical & endocervical cancer | Female | <65 | I/II | Unknown | Unknown | SD |
| BUB1 | SNV | Missense_Mutation | novel | c.114N>G | p.Phe38Leu | p.F38L | O43683 | protein_coding | tolerated(0.93) | benign(0.237) | TCGA-EA-A3HU-01 | Cervix | cervical & endocervical cancer | Female | <65 | I/II | Unknown | Unknown | SD |
| BUB1 | SNV | Missense_Mutation | c.1416N>A | p.Met472Ile | p.M472I | O43683 | protein_coding | deleterious(0) | probably_damaging(0.993) | TCGA-Q1-A73O-01 | Cervix | cervical & endocervical cancer | Female | <65 | I/II | Chemotherapy | cisplatin | CR | |
| BUB1 | insertion | Frame_Shift_Ins | novel | c.3096_3097insT | p.His1033SerfsTer32 | p.H1033Sfs*32 | O43683 | protein_coding | TCGA-VS-A9UJ-01 | Cervix | cervical & endocervical cancer | Female | <65 | I/II | Unknown | Unknown | PD | ||
| BUB1 | SNV | Missense_Mutation | novel | c.1129N>A | p.Ala377Thr | p.A377T | O43683 | protein_coding | tolerated(0.16) | benign(0) | TCGA-5M-AAT6-01 | Colorectum | colon adenocarcinoma | Female | <65 | III/IV | Unknown | Unknown | PD |
| BUB1 | SNV | Missense_Mutation | rs548365437 | c.1010N>T | p.Ala337Val | p.A337V | O43683 | protein_coding | tolerated(0.15) | benign(0.005) | TCGA-A6-2686-01 | Colorectum | colon adenocarcinoma | Female | >=65 | I/II | Unknown | Unknown | SD |
| Page: 1 2 3 4 5 6 7 8 9 10 11 |
Top |
Related drugs of malignant transformation related genes |
| Identification of chemicals and drugs interact with genes involved in malignant transfromation |
| (DGIdb 4.0) |
| Entrez ID | Symbol | Category | Interaction Types | Drug Claim Name | Drug Name | PMIDs |
| 699 | BUB1 | KINASE, ENZYME, SERINE THREONINE KINASE, DRUGGABLE GENOME | inhibitor | 249565789 | ||
| 699 | BUB1 | KINASE, ENZYME, SERINE THREONINE KINASE, DRUGGABLE GENOME | inhibitor | 249565790 | ||
| 699 | BUB1 | KINASE, ENZYME, SERINE THREONINE KINASE, DRUGGABLE GENOME | SCHEMBL17766424 | |||
| 699 | BUB1 | KINASE, ENZYME, SERINE THREONINE KINASE, DRUGGABLE GENOME | inhibitor | 249565792 | ||
| 699 | BUB1 | KINASE, ENZYME, SERINE THREONINE KINASE, DRUGGABLE GENOME | inhibitor | 315661212 | ||
| 699 | BUB1 | KINASE, ENZYME, SERINE THREONINE KINASE, DRUGGABLE GENOME | inhibitor | 249565791 | ||
| 699 | BUB1 | KINASE, ENZYME, SERINE THREONINE KINASE, DRUGGABLE GENOME | SCHEMBL16365841 | |||
| 699 | BUB1 | KINASE, ENZYME, SERINE THREONINE KINASE, DRUGGABLE GENOME | SCHEMBL16322760 | |||
| 699 | BUB1 | KINASE, ENZYME, SERINE THREONINE KINASE, DRUGGABLE GENOME | inhibitor | 315661211 |
| Page: 1 |

Copyright 2023-Present -The University of Texas Health Science Center at Houston |