
|
|||||
|
 | |
| |
| |
| |
| |
| |
|
Gene: BRD1 |
Gene summary for BRD1 |
| Gene information | Species | Human | Gene symbol | BRD1 | Gene ID | 23774 |
| Gene name | bromodomain containing 1 | |
| Gene Alias | BRL | |
| Cytomap | 22q13.33 | |
| Gene Type | protein-coding | GO ID | GO:0002262 | UniProtAcc | A0A024R4V5 |
Top |
Malignant transformation analysis |
| Identification of the aberrant gene expression in precancerous and cancerous lesions by comparing the gene expression of stem-like cells in diseased tissues with normal stem cells |
| Entrez ID | Symbol | Replicates | Species | Organ | Tissue | Adj P-value | Log2FC | Malignancy |
| 23774 | BRD1 | male-WTA | Human | Thyroid | PTC | 2.99e-21 | 1.33e-01 | 0.1037 |
| 23774 | BRD1 | PTC01 | Human | Thyroid | PTC | 4.45e-02 | -9.52e-03 | 0.1899 |
| 23774 | BRD1 | PTC04 | Human | Thyroid | PTC | 3.18e-11 | 2.53e-01 | 0.1927 |
| 23774 | BRD1 | PTC05 | Human | Thyroid | PTC | 2.19e-17 | 4.10e-01 | 0.2065 |
| 23774 | BRD1 | PTC06 | Human | Thyroid | PTC | 6.35e-30 | 5.92e-01 | 0.2057 |
| 23774 | BRD1 | PTC07 | Human | Thyroid | PTC | 1.64e-34 | 5.20e-01 | 0.2044 |
| 23774 | BRD1 | ATC12 | Human | Thyroid | ATC | 4.76e-07 | 7.78e-02 | 0.34 |
| 23774 | BRD1 | ATC13 | Human | Thyroid | ATC | 6.09e-32 | 5.61e-01 | 0.34 |
| 23774 | BRD1 | ATC2 | Human | Thyroid | ATC | 9.16e-11 | 7.10e-01 | 0.34 |
| 23774 | BRD1 | ATC3 | Human | Thyroid | ATC | 2.31e-02 | 1.49e-01 | 0.338 |
| 23774 | BRD1 | ATC4 | Human | Thyroid | ATC | 2.41e-08 | 1.25e-01 | 0.34 |
| 23774 | BRD1 | ATC5 | Human | Thyroid | ATC | 4.92e-34 | 6.17e-01 | 0.34 |
| Page: 1 |
| Tissue | Expression Dynamics | Abbreviation |
| Thyroid | 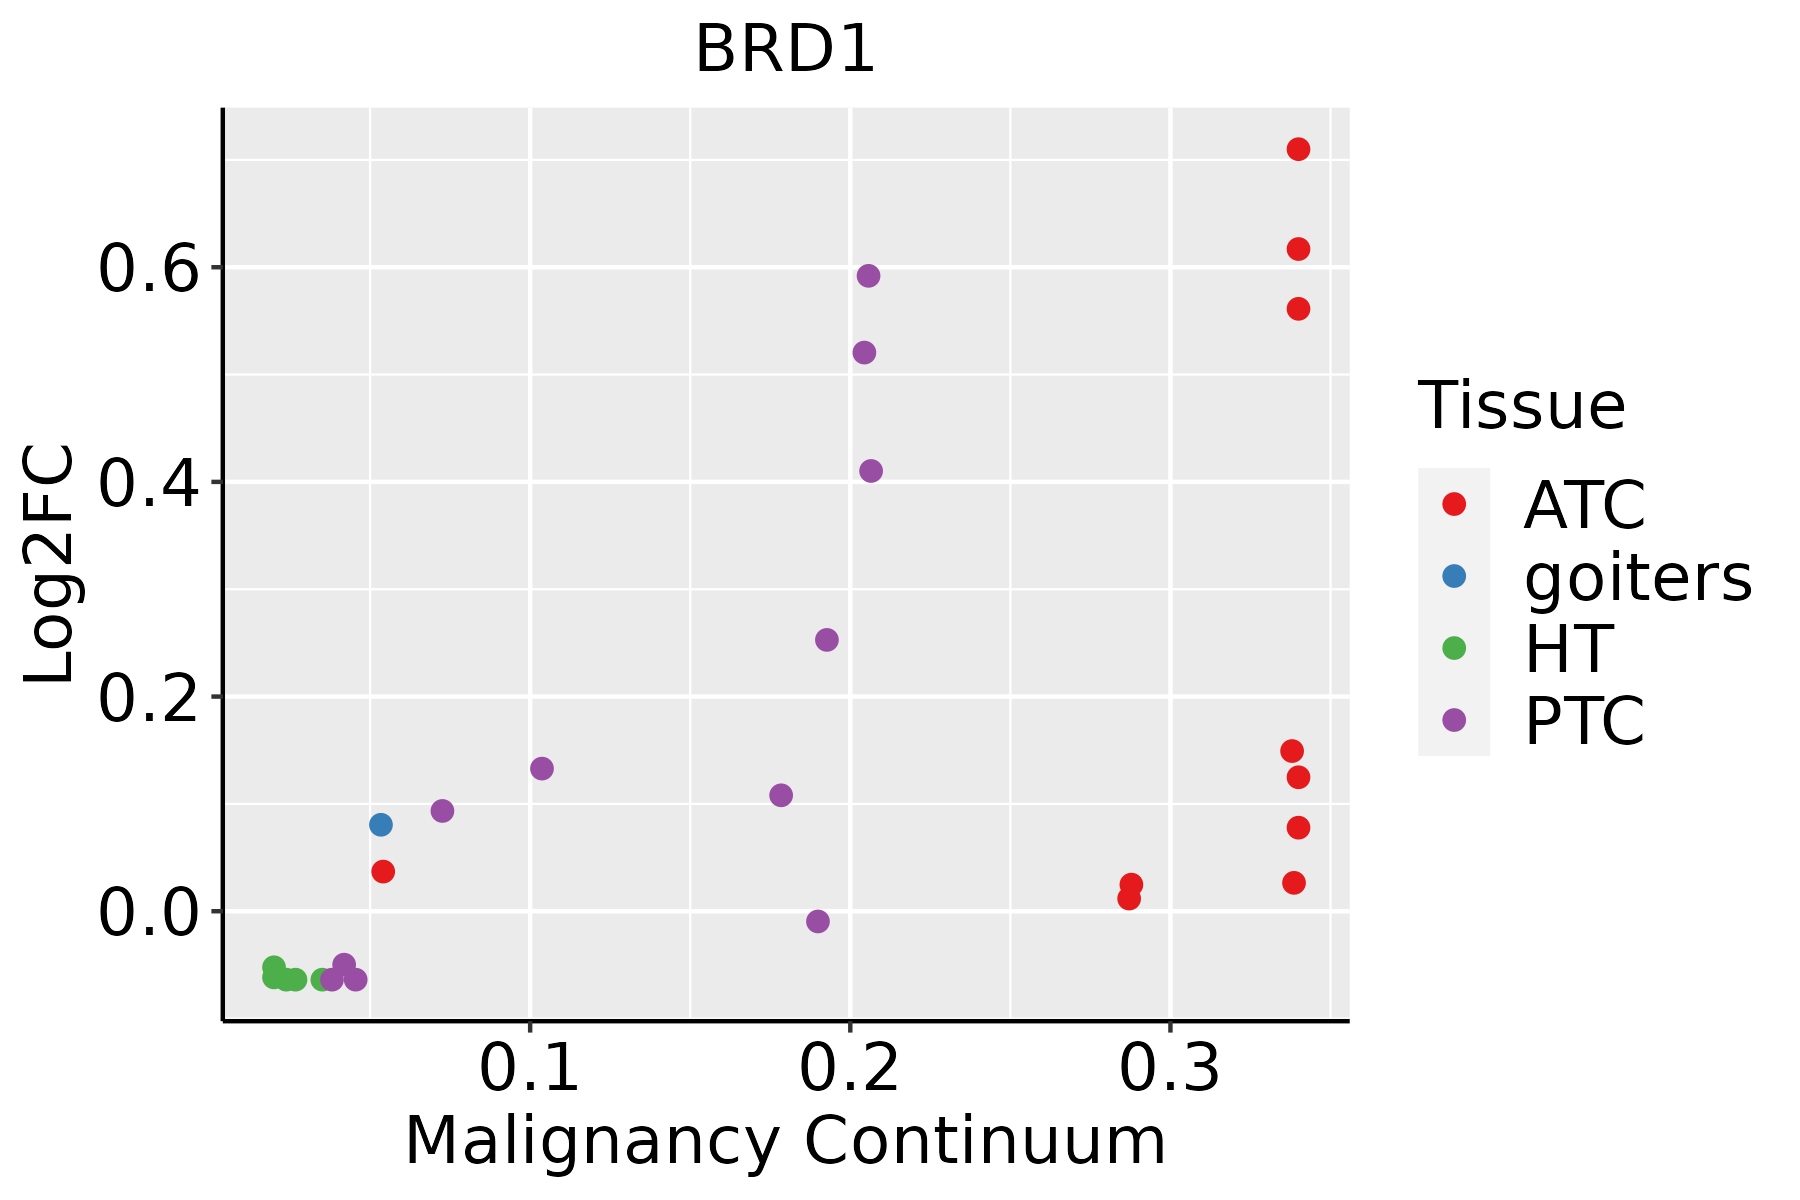 | ATC: Anaplastic thyroid cancer |
| HT: Hashimoto's thyroiditis | ||
| PTC: Papillary thyroid cancer |
| ∗log2FC in expression of this searched gene in stem-like cells from each diseased tissue sample relative to stem-like cells in normal samples in each tissue plotted against the malignancy continuum. Samples are colored based on if they are from different disease stage. |
Top |
Malignant transformation related pathway analysis |
| Find out the enriched GO biological processes and KEGG pathways involved in transition from healthy to precancer to cancer |
| Tissue | Disease Stage | Enriched GO biological Processes |
| Colorectum | AD |  |
| Colorectum | SER |  |
| Colorectum | MSS |  |
| Colorectum | MSI-H |  |
| Colorectum | FAP |  |
| ∗Top 15 enriched GO BP terms are showed in the bar plot of each disease state in each tissue. Each row represents a significant GO biological process which is colored according to the -log10(p.adjust). |
| Page: 1 2 3 4 5 6 7 8 9 |
| GO ID | Tissue | Disease Stage | Description | Gene Ratio | Bg Ratio | pvalue | p.adjust | Count |
| GO:005507616 | Oral cavity | LP | transition metal ion homeostasis | 54/4623 | 138/18723 | 1.19e-04 | 1.40e-03 | 54 |
| GO:004691615 | Oral cavity | LP | cellular transition metal ion homeostasis | 46/4623 | 115/18723 | 2.02e-04 | 2.20e-03 | 46 |
| GO:007266515 | Oral cavity | LP | protein localization to vacuole | 30/4623 | 67/18723 | 2.60e-04 | 2.71e-03 | 30 |
| GO:006146212 | Oral cavity | LP | protein localization to lysosome | 21/4623 | 46/18723 | 1.56e-03 | 1.20e-02 | 21 |
| GO:007258313 | Oral cavity | LP | clathrin-dependent endocytosis | 20/4623 | 47/18723 | 5.42e-03 | 3.30e-02 | 20 |
| GO:007258321 | Oral cavity | EOLP | clathrin-dependent endocytosis | 19/2218 | 47/18723 | 6.00e-07 | 1.56e-05 | 19 |
| GO:000689825 | Oral cavity | EOLP | receptor-mediated endocytosis | 55/2218 | 244/18723 | 1.64e-06 | 3.82e-05 | 55 |
| GO:004311223 | Oral cavity | EOLP | receptor metabolic process | 37/2218 | 166/18723 | 1.00e-04 | 1.14e-03 | 37 |
| GO:007266522 | Oral cavity | EOLP | protein localization to vacuole | 19/2218 | 67/18723 | 2.01e-04 | 2.02e-03 | 19 |
| GO:000736913 | Oral cavity | EOLP | gastrulation | 39/2218 | 185/18723 | 2.29e-04 | 2.25e-03 | 39 |
| GO:003162314 | Oral cavity | EOLP | receptor internalization | 23/2218 | 113/18723 | 6.37e-03 | 3.15e-02 | 23 |
| GO:004311231 | Oral cavity | NEOLP | receptor metabolic process | 40/2005 | 166/18723 | 6.24e-07 | 1.82e-05 | 40 |
| GO:000689831 | Oral cavity | NEOLP | receptor-mediated endocytosis | 51/2005 | 244/18723 | 2.08e-06 | 4.87e-05 | 51 |
| GO:000736921 | Oral cavity | NEOLP | gastrulation | 38/2005 | 185/18723 | 5.90e-05 | 7.93e-04 | 38 |
| GO:007258331 | Oral cavity | NEOLP | clathrin-dependent endocytosis | 15/2005 | 47/18723 | 7.12e-05 | 9.27e-04 | 15 |
| GO:003162322 | Oral cavity | NEOLP | receptor internalization | 26/2005 | 113/18723 | 1.24e-04 | 1.47e-03 | 26 |
| GO:007266531 | Oral cavity | NEOLP | protein localization to vacuole | 17/2005 | 67/18723 | 5.39e-04 | 4.73e-03 | 17 |
| GO:006146221 | Oral cavity | NEOLP | protein localization to lysosome | 11/2005 | 46/18723 | 7.99e-03 | 3.95e-02 | 11 |
| GO:001003818 | Prostate | BPH | response to metal ion | 104/3107 | 373/18723 | 2.32e-08 | 6.99e-07 | 104 |
| GO:00550769 | Prostate | BPH | transition metal ion homeostasis | 43/3107 | 138/18723 | 1.66e-05 | 2.07e-04 | 43 |
| Page: 1 2 3 4 5 6 7 8 9 |
| Pathway ID | Tissue | Disease Stage | Description | Gene Ratio | Bg Ratio | pvalue | p.adjust | qvalue | Count |
| Page: 1 |
Top |
Cell-cell communication analysis |
| Identification of potential cell-cell interactions between two cell types and their ligand-receptor pairs for different disease states |
| Ligand | Receptor | LRpair | Pathway | Tissue | Disease Stage |
| Page: 1 |
Top |
Single-cell gene regulatory network inference analysis |
| Find out the significant the regulons (TFs) and the target genes of each regulon across cell types for different disease states |
| TF | Cell Type | Tissue | Disease Stage | Target Gene | RSS | Regulon Activity |
| ∗The dot plots of a searched regulon are shown for all cell subpopulations in each disease state of each tissue based on the regulon specific score inferred using pySCENIC and by calculating the average expression. |
| Page: 1 |
Top |
Somatic mutation of malignant transformation related genes |
| Annotation of somatic variants for genes involved in malignant transformation |
| Hugo Symbol | Variant Class | Variant Classification | dbSNP RS | HGVSc | HGVSp | HGVSp Short | SWISSPROT | BIOTYPE | SIFT | PolyPhen | Tumor Sample Barcode | Tissue | Histology | Sex | Age | Stage | Therapy Types | Drugs | Outcome |
| BRD1 | SNV | Missense_Mutation | c.808G>A | p.Asp270Asn | p.D270N | O95696 | protein_coding | deleterious(0.03) | benign(0.062) | TCGA-AN-A046-01 | Breast | breast invasive carcinoma | Female | >=65 | I/II | Unknown | Unknown | SD | |
| BRD1 | SNV | Missense_Mutation | c.1426N>A | p.Ala476Thr | p.A476T | O95696 | protein_coding | deleterious(0.01) | benign(0.234) | TCGA-AO-A128-01 | Breast | breast invasive carcinoma | Female | <65 | I/II | Chemotherapy | doxorubicin | SD | |
| BRD1 | SNV | Missense_Mutation | c.928N>A | p.Glu310Lys | p.E310K | O95696 | protein_coding | deleterious(0) | probably_damaging(0.999) | TCGA-BH-A28Q-01 | Breast | breast invasive carcinoma | Female | <65 | I/II | Unknown | Unknown | SD | |
| BRD1 | deletion | Frame_Shift_Del | novel | c.1587delG | p.His530ThrfsTer9 | p.H530Tfs*9 | O95696 | protein_coding | TCGA-E2-A1LK-01 | Breast | breast invasive carcinoma | Female | >=65 | III/IV | Unknown | Unknown | PD | ||
| BRD1 | SNV | Missense_Mutation | rs773212689 | c.3526N>T | p.Arg1176Cys | p.R1176C | O95696 | protein_coding | deleterious(0) | possibly_damaging(0.812) | TCGA-2W-A8YY-01 | Cervix | cervical & endocervical cancer | Female | <65 | I/II | Chemotherapy | cisplatin | CR |
| BRD1 | SNV | Missense_Mutation | c.643N>A | p.Ala215Thr | p.A215T | O95696 | protein_coding | deleterious(0) | probably_damaging(0.999) | TCGA-2W-A8YY-01 | Cervix | cervical & endocervical cancer | Female | <65 | I/II | Chemotherapy | cisplatin | CR | |
| BRD1 | SNV | Missense_Mutation | novel | c.28N>T | p.Gly10Cys | p.G10C | O95696 | protein_coding | tolerated(0.08) | possibly_damaging(0.497) | TCGA-2W-A8YY-01 | Cervix | cervical & endocervical cancer | Female | <65 | I/II | Chemotherapy | cisplatin | CR |
| BRD1 | SNV | Missense_Mutation | c.2020N>A | p.Gly674Ser | p.G674S | O95696 | protein_coding | deleterious(0.02) | probably_damaging(1) | TCGA-C5-A1MI-01 | Cervix | cervical & endocervical cancer | Female | <65 | I/II | Chemotherapy | cisplatin | PD | |
| BRD1 | SNV | Missense_Mutation | c.964N>T | p.Arg322Trp | p.R322W | O95696 | protein_coding | deleterious(0) | probably_damaging(1) | TCGA-C5-A1MJ-01 | Cervix | cervical & endocervical cancer | Female | <65 | I/II | Unknown | Unknown | SD | |
| BRD1 | SNV | Missense_Mutation | c.646N>A | p.Val216Met | p.V216M | O95696 | protein_coding | deleterious(0) | probably_damaging(1) | TCGA-EK-A2RJ-01 | Cervix | cervical & endocervical cancer | Female | <65 | I/II | Unknown | Unknown | SD |
| Page: 1 2 3 4 5 6 7 8 9 10 11 12 13 14 15 |
Top |
Related drugs of malignant transformation related genes |
| Identification of chemicals and drugs interact with genes involved in malignant transfromation |
| (DGIdb 4.0) |
| Entrez ID | Symbol | Category | Interaction Types | Drug Claim Name | Drug Name | PMIDs |
| 23774 | BRD1 | ENZYME | inhibitor | 252166774 | ||
| 23774 | BRD1 | ENZYME | inhibitor | 336446910 |
| Page: 1 |

Copyright 2023-Present -The University of Texas Health Science Center at Houston |