
|
|||||
|
 | |
| |
| |
| |
| |
| |
|
Gene: BOD1 |
Gene summary for BOD1 |
| Gene information | Species | Human | Gene symbol | BOD1 | Gene ID | 91272 |
| Gene name | biorientation of chromosomes in cell division 1 | |
| Gene Alias | FAM44B | |
| Cytomap | 5q35.2 | |
| Gene Type | protein-coding | GO ID | GO:0000070 | UniProtAcc | Q96IK1 |
Top |
Malignant transformation analysis |
| Identification of the aberrant gene expression in precancerous and cancerous lesions by comparing the gene expression of stem-like cells in diseased tissues with normal stem cells |
| Entrez ID | Symbol | Replicates | Species | Organ | Tissue | Adj P-value | Log2FC | Malignancy |
| 91272 | BOD1 | LZE20T | Human | Esophagus | ESCC | 2.13e-02 | -1.03e-02 | 0.0662 |
| 91272 | BOD1 | LZE24T | Human | Esophagus | ESCC | 2.11e-14 | 3.75e-01 | 0.0596 |
| 91272 | BOD1 | P1T-E | Human | Esophagus | ESCC | 5.36e-05 | 3.55e-01 | 0.0875 |
| 91272 | BOD1 | P2T-E | Human | Esophagus | ESCC | 7.26e-61 | 1.04e+00 | 0.1177 |
| 91272 | BOD1 | P4T-E | Human | Esophagus | ESCC | 4.24e-29 | 6.81e-01 | 0.1323 |
| 91272 | BOD1 | P5T-E | Human | Esophagus | ESCC | 5.25e-27 | 5.98e-01 | 0.1327 |
| 91272 | BOD1 | P8T-E | Human | Esophagus | ESCC | 3.65e-19 | 2.17e-01 | 0.0889 |
| 91272 | BOD1 | P9T-E | Human | Esophagus | ESCC | 9.49e-10 | 1.99e-01 | 0.1131 |
| 91272 | BOD1 | P10T-E | Human | Esophagus | ESCC | 2.41e-56 | 9.80e-01 | 0.116 |
| 91272 | BOD1 | P11T-E | Human | Esophagus | ESCC | 2.07e-14 | 7.44e-01 | 0.1426 |
| 91272 | BOD1 | P12T-E | Human | Esophagus | ESCC | 2.21e-27 | 5.49e-01 | 0.1122 |
| 91272 | BOD1 | P15T-E | Human | Esophagus | ESCC | 1.99e-28 | 8.01e-01 | 0.1149 |
| 91272 | BOD1 | P16T-E | Human | Esophagus | ESCC | 3.72e-35 | 6.23e-01 | 0.1153 |
| 91272 | BOD1 | P17T-E | Human | Esophagus | ESCC | 9.67e-09 | 4.36e-01 | 0.1278 |
| 91272 | BOD1 | P20T-E | Human | Esophagus | ESCC | 1.18e-17 | 2.57e-01 | 0.1124 |
| 91272 | BOD1 | P21T-E | Human | Esophagus | ESCC | 5.18e-16 | 4.31e-01 | 0.1617 |
| 91272 | BOD1 | P22T-E | Human | Esophagus | ESCC | 2.91e-51 | 8.73e-01 | 0.1236 |
| 91272 | BOD1 | P23T-E | Human | Esophagus | ESCC | 5.79e-28 | 8.10e-01 | 0.108 |
| 91272 | BOD1 | P24T-E | Human | Esophagus | ESCC | 6.72e-21 | 2.64e-01 | 0.1287 |
| 91272 | BOD1 | P26T-E | Human | Esophagus | ESCC | 5.74e-37 | 6.96e-01 | 0.1276 |
| Page: 1 2 3 4 5 6 |
| Tissue | Expression Dynamics | Abbreviation |
| Esophagus | 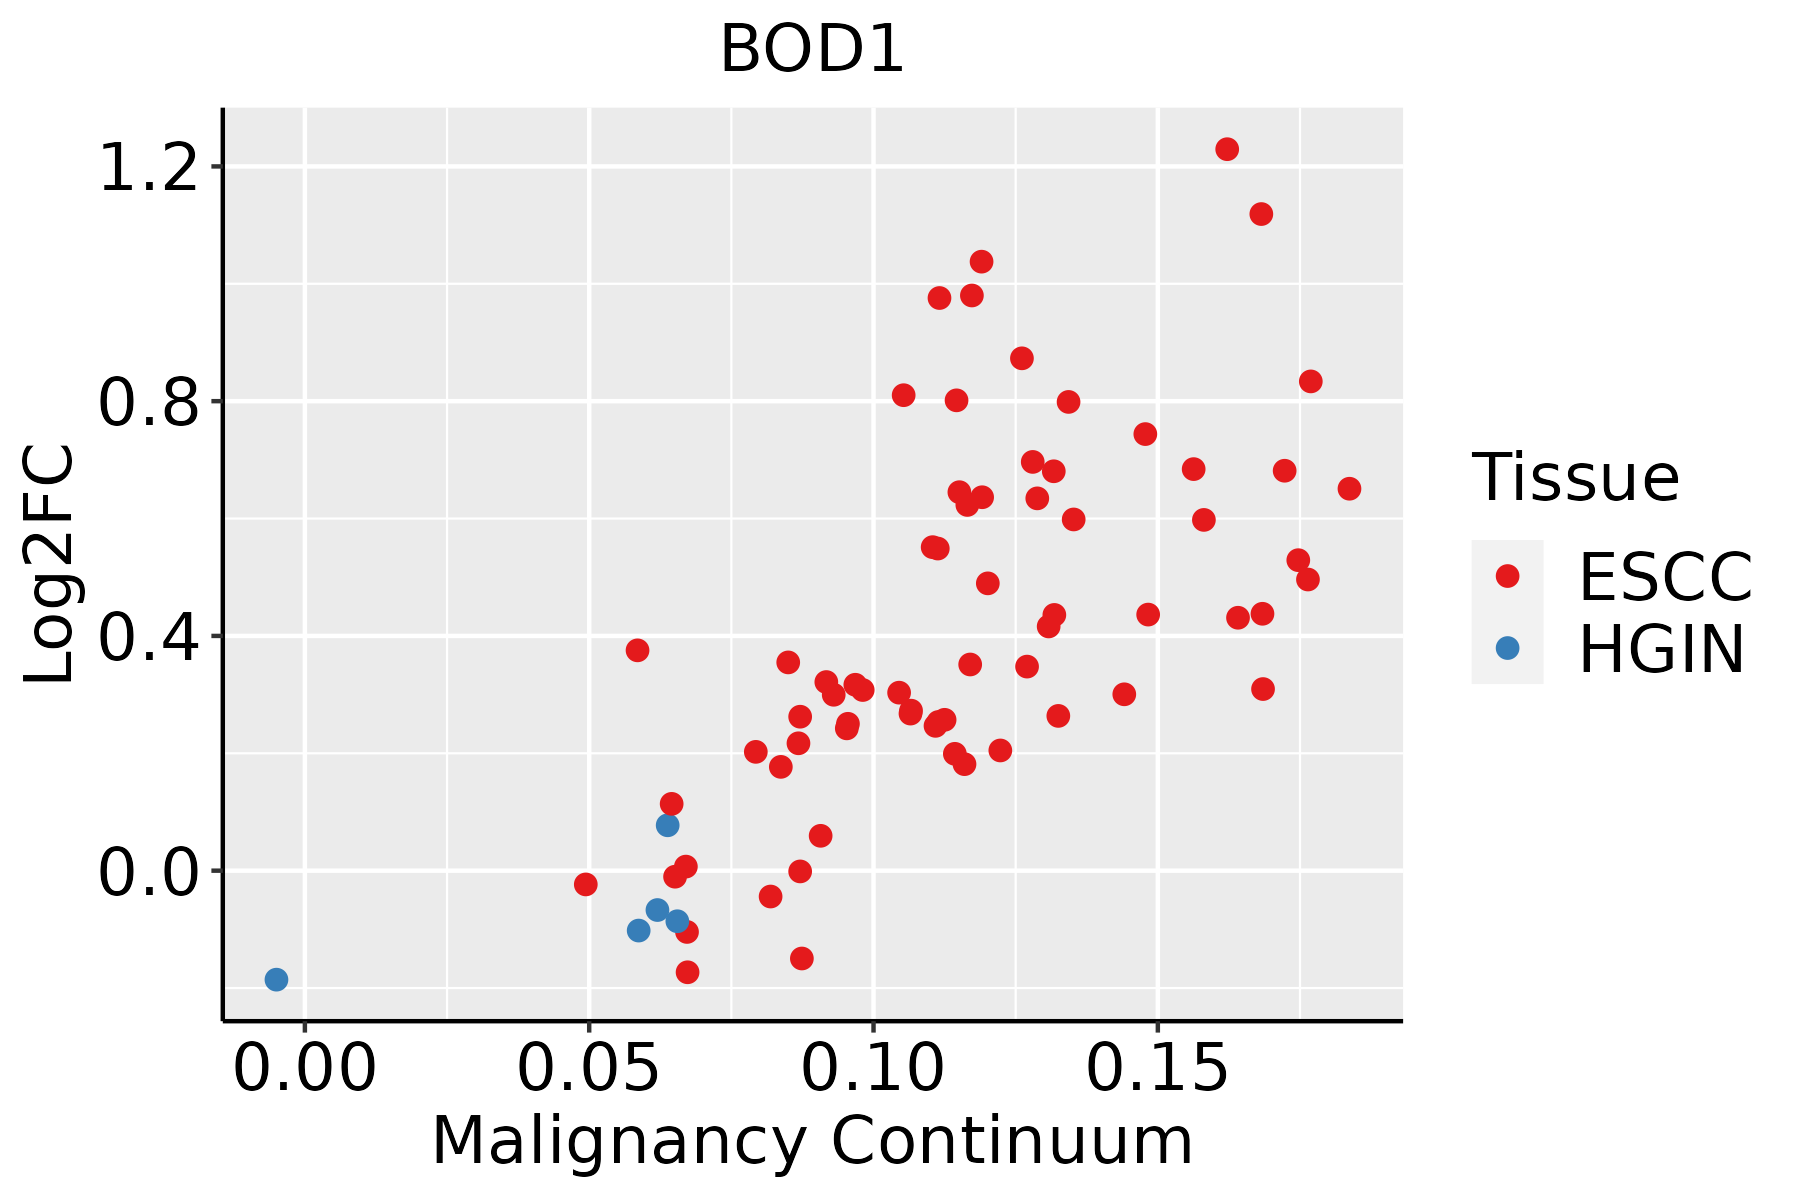 | ESCC: Esophageal squamous cell carcinoma |
| HGIN: High-grade intraepithelial neoplasias | ||
| LGIN: Low-grade intraepithelial neoplasias | ||
| Liver | 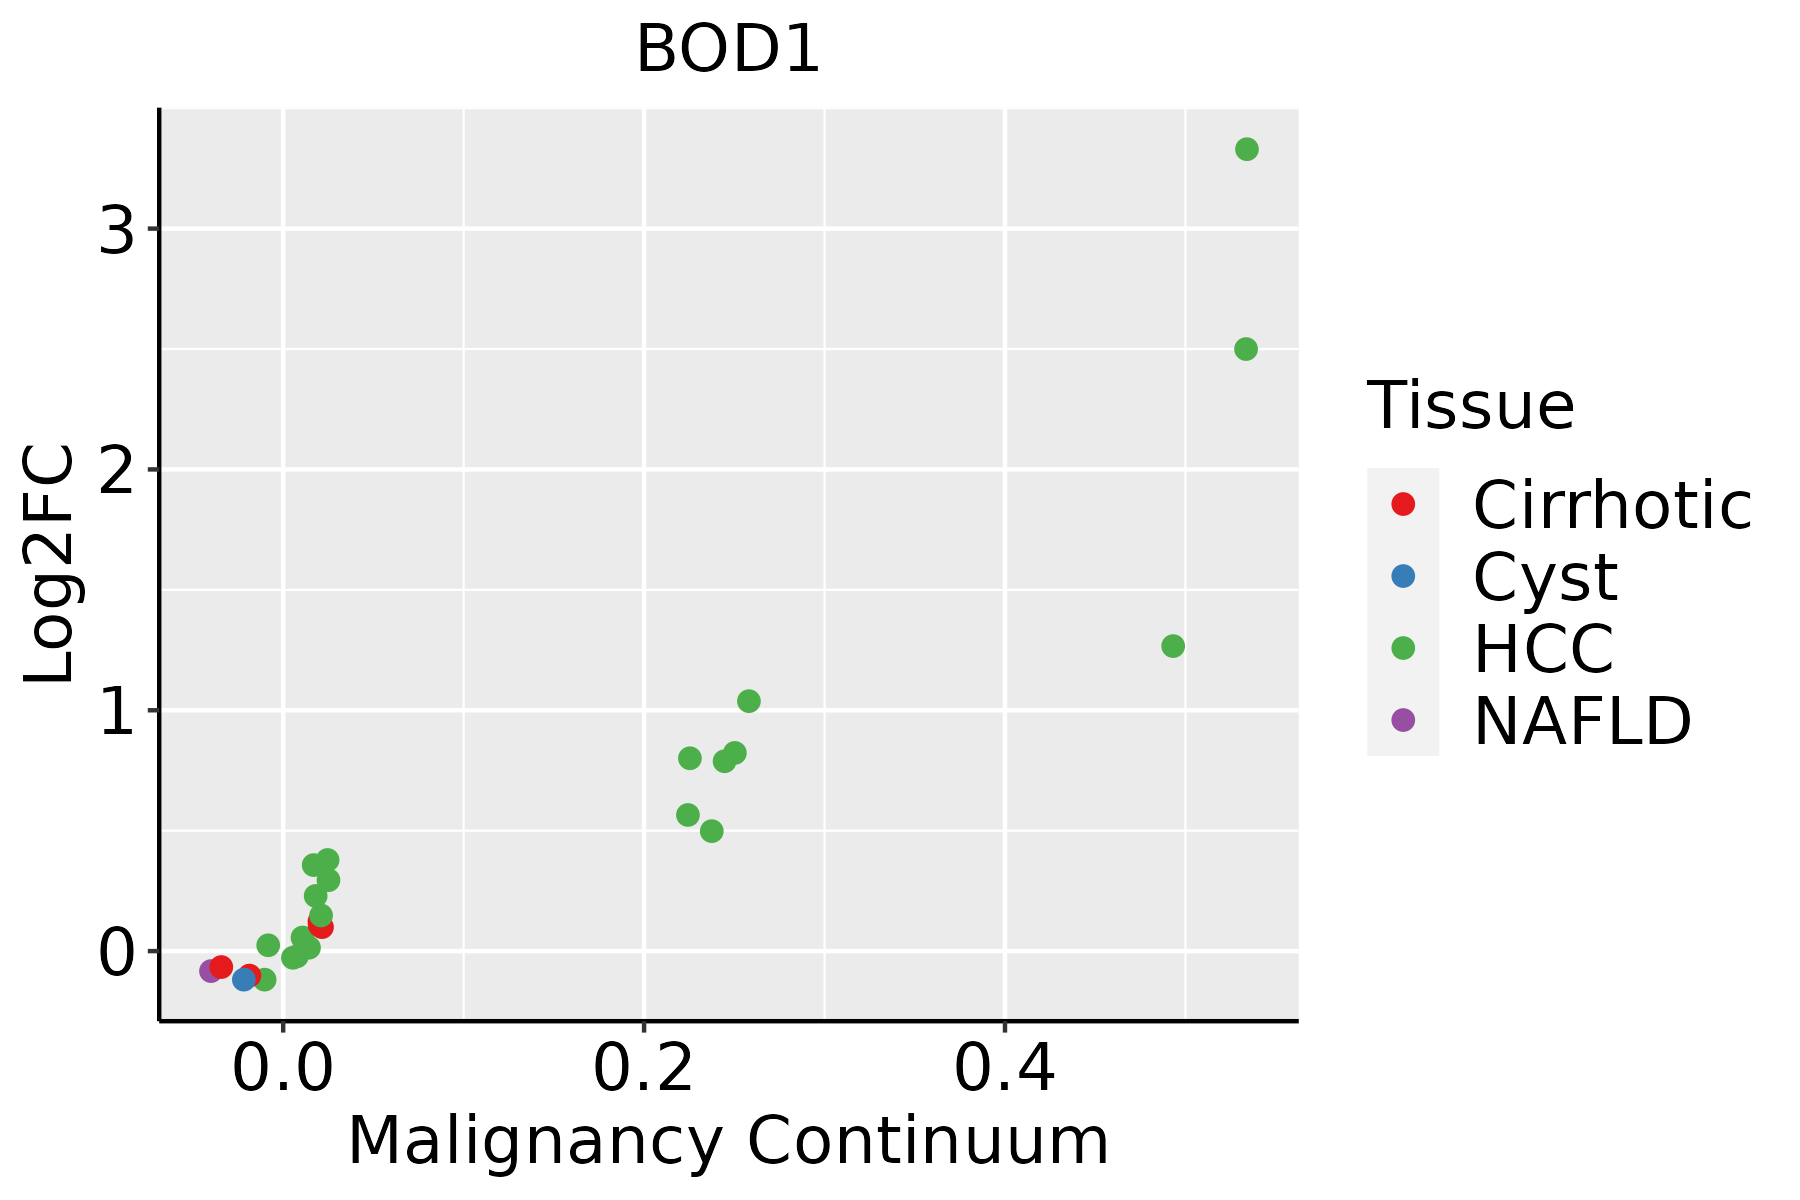 | HCC: Hepatocellular carcinoma |
| NAFLD: Non-alcoholic fatty liver disease | ||
| Oral Cavity |  | EOLP: Erosive Oral lichen planus |
| LP: leukoplakia | ||
| NEOLP: Non-erosive oral lichen planus | ||
| OSCC: Oral squamous cell carcinoma | ||
| Skin | 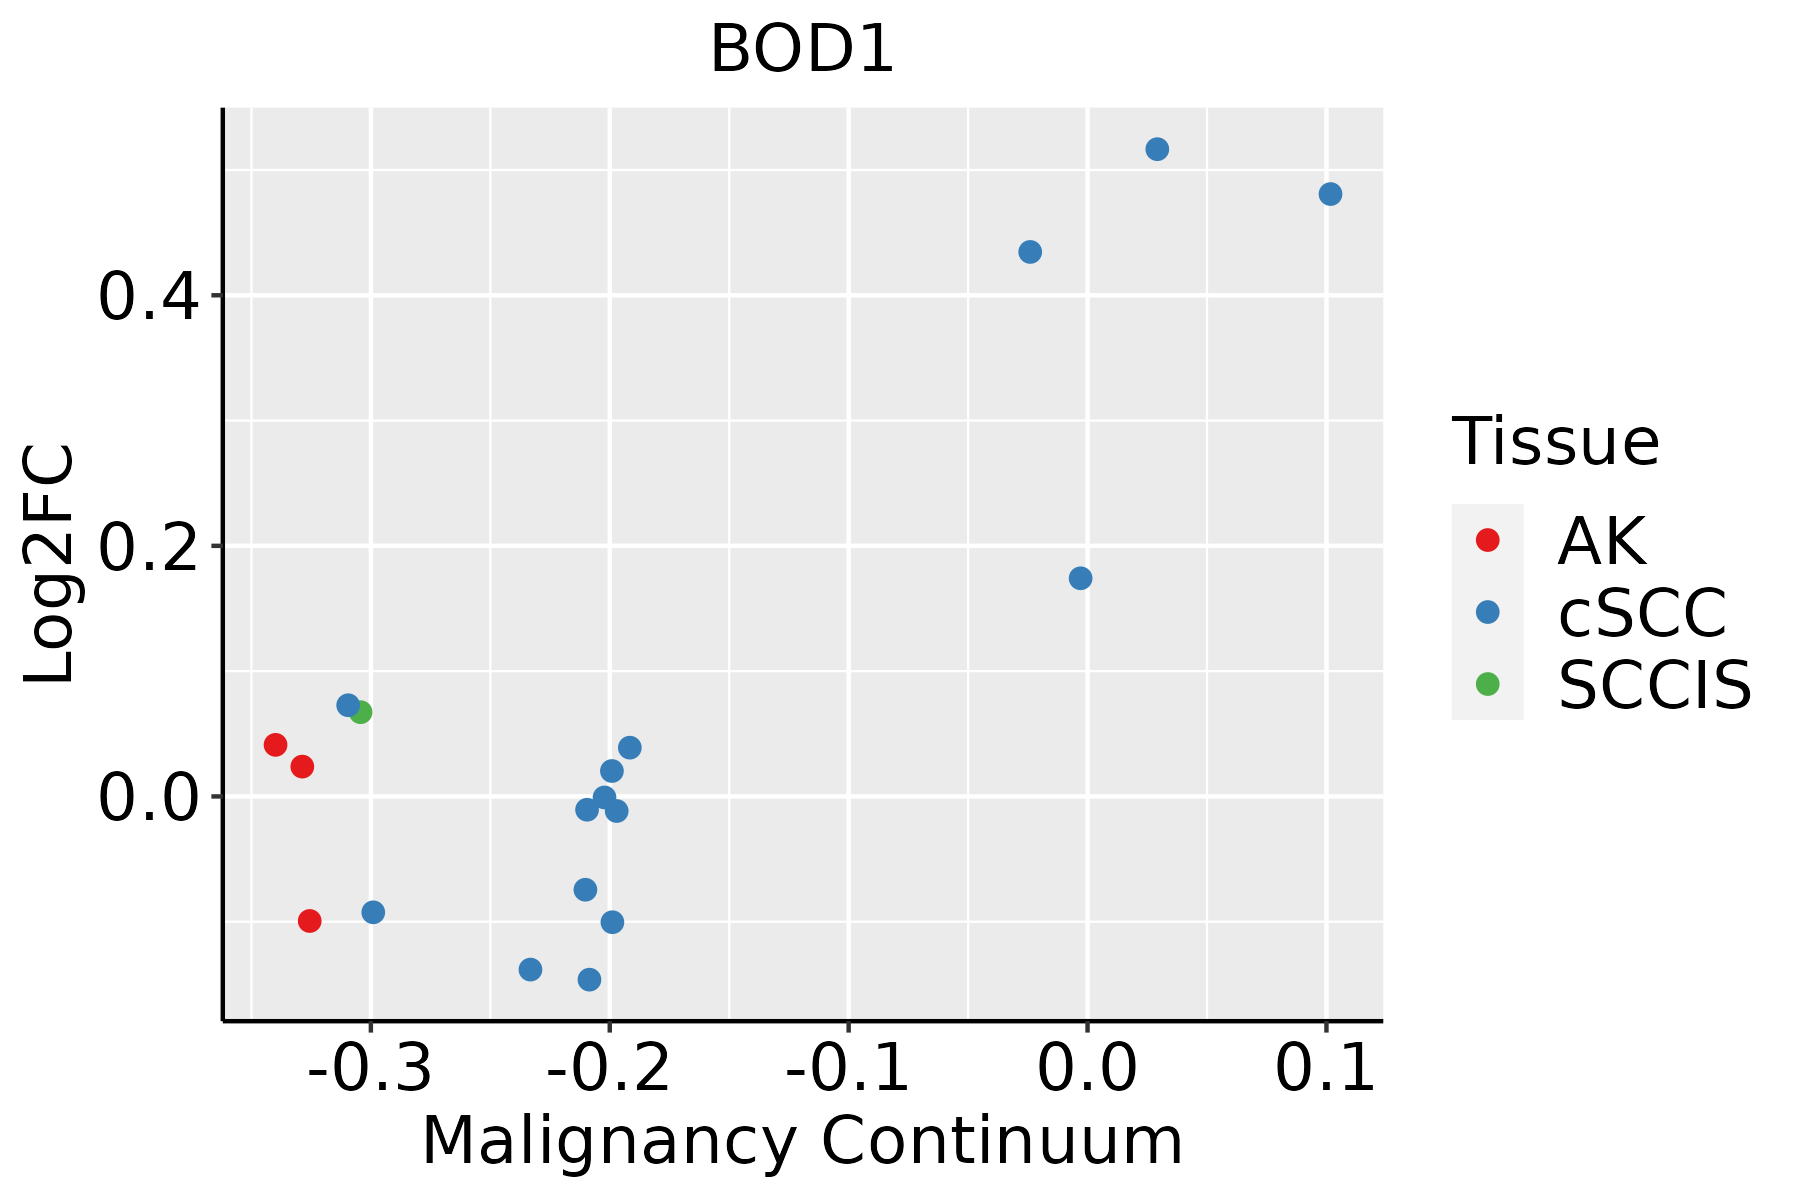 | AK: Actinic keratosis |
| cSCC: Cutaneous squamous cell carcinoma | ||
| SCCIS:squamous cell carcinoma in situ | ||
| Thyroid | 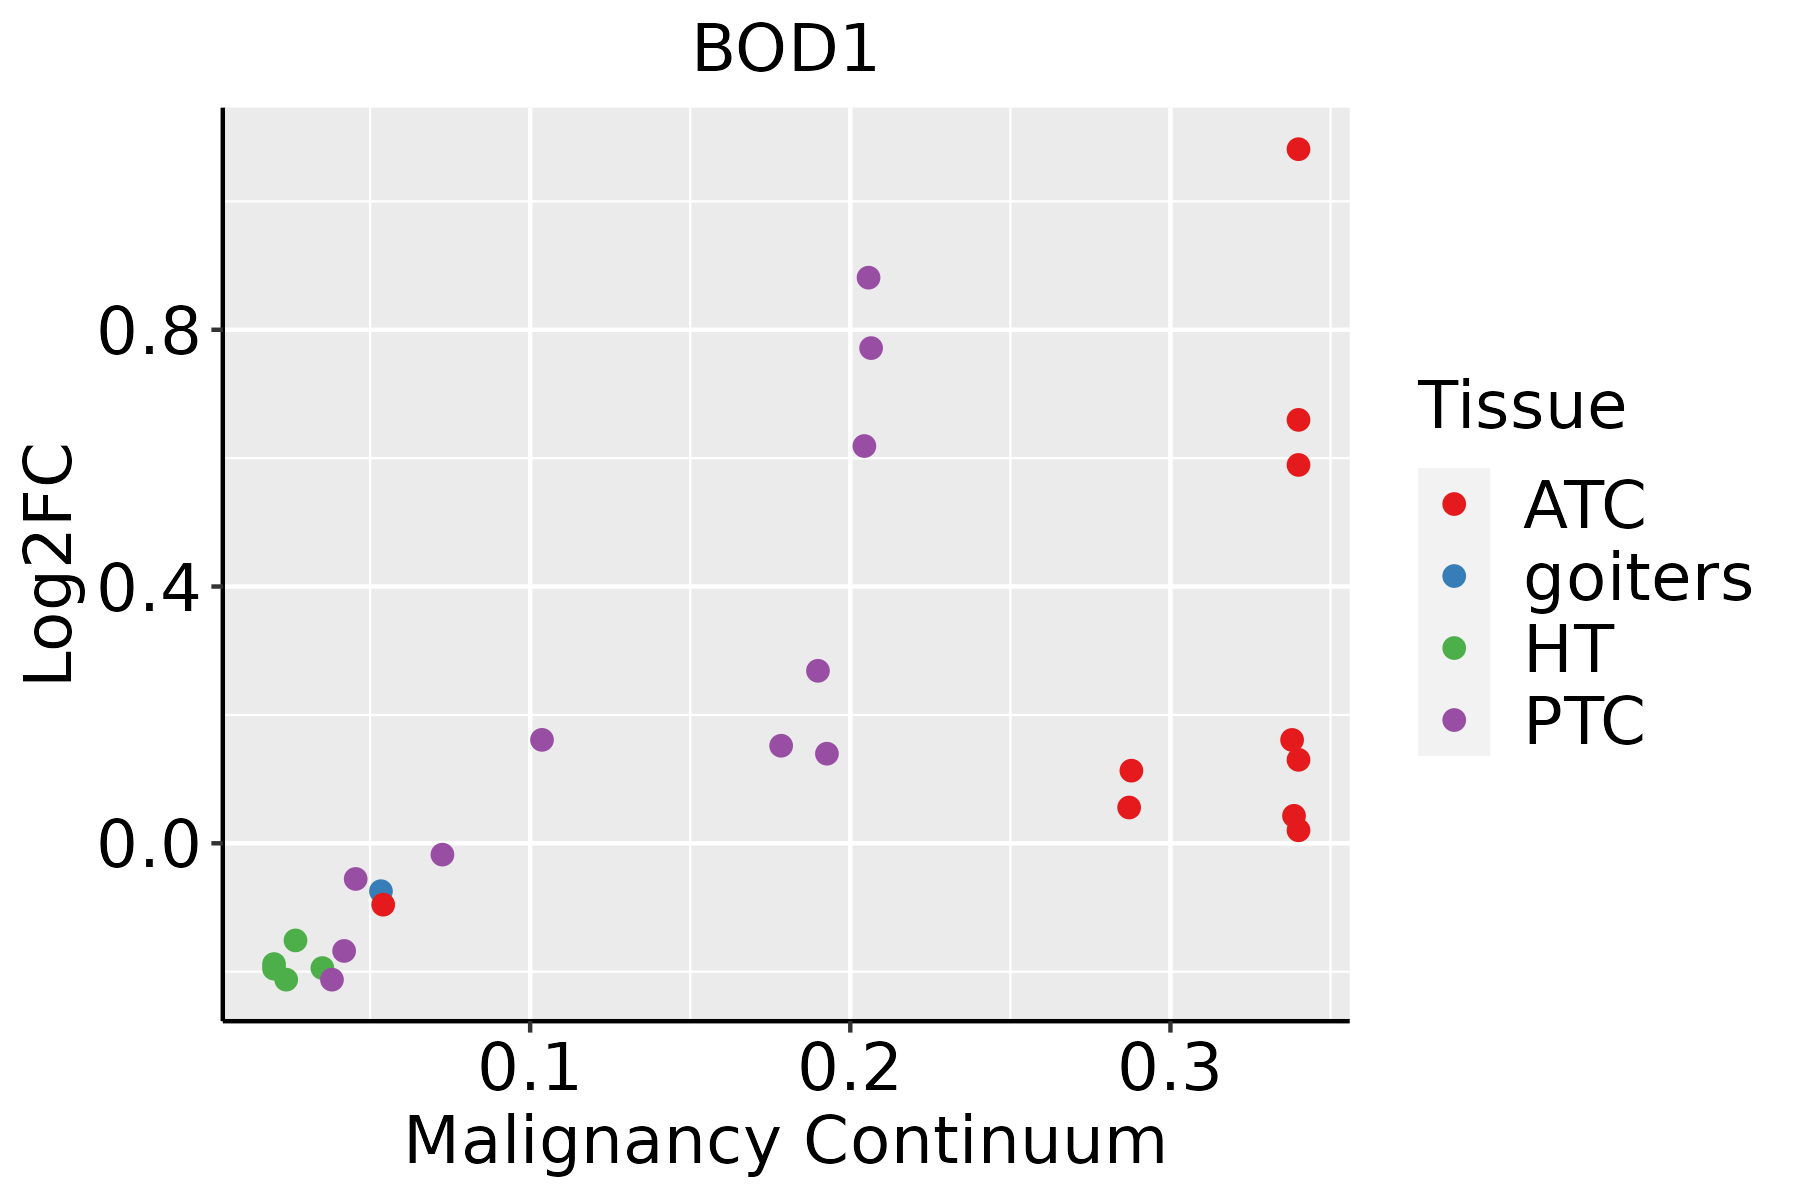 | ATC: Anaplastic thyroid cancer |
| HT: Hashimoto's thyroiditis | ||
| PTC: Papillary thyroid cancer |
| ∗log2FC in expression of this searched gene in stem-like cells from each diseased tissue sample relative to stem-like cells in normal samples in each tissue plotted against the malignancy continuum. Samples are colored based on if they are from different disease stage. |
Top |
Malignant transformation related pathway analysis |
| Find out the enriched GO biological processes and KEGG pathways involved in transition from healthy to precancer to cancer |
| Tissue | Disease Stage | Enriched GO biological Processes |
| Colorectum | AD |  |
| Colorectum | SER |  |
| Colorectum | MSS |  |
| Colorectum | MSI-H |  |
| Colorectum | FAP |  |
| ∗Top 15 enriched GO BP terms are showed in the bar plot of each disease state in each tissue. Each row represents a significant GO biological process which is colored according to the -log10(p.adjust). |
| Page: 1 2 3 4 5 6 7 8 9 |
| GO ID | Tissue | Disease Stage | Description | Gene Ratio | Bg Ratio | pvalue | p.adjust | Count |
| GO:0000819 | Liver | Cirrhotic | sister chromatid segregation | 65/4634 | 202/18723 | 1.01e-02 | 4.52e-02 | 65 |
| GO:00070644 | Liver | Cirrhotic | mitotic sister chromatid cohesion | 13/4634 | 28/18723 | 1.03e-02 | 4.59e-02 | 13 |
| GO:00353084 | Liver | Cirrhotic | negative regulation of protein dephosphorylation | 15/4634 | 34/18723 | 1.05e-02 | 4.66e-02 | 15 |
| GO:001056322 | Liver | HCC | negative regulation of phosphorus metabolic process | 259/7958 | 442/18723 | 4.29e-12 | 1.92e-10 | 259 |
| GO:004593622 | Liver | HCC | negative regulation of phosphate metabolic process | 258/7958 | 441/18723 | 6.00e-12 | 2.60e-10 | 258 |
| GO:014001411 | Liver | HCC | mitotic nuclear division | 174/7958 | 287/18723 | 3.74e-10 | 1.23e-08 | 174 |
| GO:005165621 | Liver | HCC | establishment of organelle localization | 226/7958 | 390/18723 | 4.15e-10 | 1.34e-08 | 226 |
| GO:0000070 | Liver | HCC | mitotic sister chromatid segregation | 110/7958 | 168/18723 | 1.42e-09 | 4.25e-08 | 110 |
| GO:00008191 | Liver | HCC | sister chromatid segregation | 128/7958 | 202/18723 | 1.59e-09 | 4.73e-08 | 128 |
| GO:0007059 | Liver | HCC | chromosome segregation | 197/7958 | 346/18723 | 3.57e-08 | 7.87e-07 | 197 |
| GO:001631121 | Liver | HCC | dephosphorylation | 230/7958 | 417/18723 | 1.00e-07 | 1.96e-06 | 230 |
| GO:000647021 | Liver | HCC | protein dephosphorylation | 162/7958 | 281/18723 | 1.91e-07 | 3.46e-06 | 162 |
| GO:003530412 | Liver | HCC | regulation of protein dephosphorylation | 62/7958 | 90/18723 | 3.66e-07 | 6.22e-06 | 62 |
| GO:0098813 | Liver | HCC | nuclear chromosome segregation | 157/7958 | 281/18723 | 3.82e-06 | 4.95e-05 | 157 |
| GO:003530312 | Liver | HCC | regulation of dephosphorylation | 80/7958 | 128/18723 | 3.85e-06 | 4.98e-05 | 80 |
| GO:00062601 | Liver | HCC | DNA replication | 146/7958 | 260/18723 | 5.68e-06 | 7.02e-05 | 146 |
| GO:0048285 | Liver | HCC | organelle fission | 254/7958 | 488/18723 | 1.07e-05 | 1.23e-04 | 254 |
| GO:0007080 | Liver | HCC | mitotic metaphase plate congression | 36/7958 | 50/18723 | 2.28e-05 | 2.41e-04 | 36 |
| GO:004366612 | Liver | HCC | regulation of phosphoprotein phosphatase activity | 39/7958 | 58/18723 | 1.22e-04 | 1.02e-03 | 39 |
| GO:005134622 | Liver | HCC | negative regulation of hydrolase activity | 195/7958 | 379/18723 | 2.44e-04 | 1.82e-03 | 195 |
| Page: 1 2 3 4 5 6 7 8 9 10 11 12 13 14 15 16 |
| Pathway ID | Tissue | Disease Stage | Description | Gene Ratio | Bg Ratio | pvalue | p.adjust | qvalue | Count |
| Page: 1 |
Top |
Cell-cell communication analysis |
| Identification of potential cell-cell interactions between two cell types and their ligand-receptor pairs for different disease states |
| Ligand | Receptor | LRpair | Pathway | Tissue | Disease Stage |
| Page: 1 |
Top |
Single-cell gene regulatory network inference analysis |
| Find out the significant the regulons (TFs) and the target genes of each regulon across cell types for different disease states |
| TF | Cell Type | Tissue | Disease Stage | Target Gene | RSS | Regulon Activity |
| ∗The dot plots of a searched regulon are shown for all cell subpopulations in each disease state of each tissue based on the regulon specific score inferred using pySCENIC and by calculating the average expression. |
| Page: 1 |
Top |
Somatic mutation of malignant transformation related genes |
| Annotation of somatic variants for genes involved in malignant transformation |
| Hugo Symbol | Variant Class | Variant Classification | dbSNP RS | HGVSc | HGVSp | HGVSp Short | SWISSPROT | BIOTYPE | SIFT | PolyPhen | Tumor Sample Barcode | Tissue | Histology | Sex | Age | Stage | Therapy Types | Drugs | Outcome |
| BOD1 | SNV | Missense_Mutation | novel | c.530N>A | p.Pro177His | p.P177H | Q96IK1 | protein_coding | deleterious(0) | benign(0.293) | TCGA-A6-2672-01 | Colorectum | colon adenocarcinoma | Female | >=65 | III/IV | Unknown | Unknown | SD |
| BOD1 | SNV | Missense_Mutation | novel | c.206G>A | p.Arg69His | p.R69H | Q96IK1 | protein_coding | deleterious(0.01) | probably_damaging(0.974) | TCGA-AA-3864-01 | Colorectum | colon adenocarcinoma | Male | >=65 | I/II | Unknown | Unknown | SD |
| BOD1 | SNV | Missense_Mutation | novel | c.527N>G | p.Asp176Gly | p.D176G | Q96IK1 | protein_coding | deleterious(0.01) | benign(0) | TCGA-AA-3949-01 | Colorectum | colon adenocarcinoma | Female | >=65 | III/IV | Unknown | Unknown | SD |
| BOD1 | SNV | Missense_Mutation | novel | c.327N>A | p.Asn109Lys | p.N109K | Q96IK1 | protein_coding | deleterious(0.01) | probably_damaging(0.962) | TCGA-AJ-A3EL-01 | Endometrium | uterine corpus endometrioid carcinoma | Female | <65 | I/II | Unknown | Unknown | SD |
| BOD1 | SNV | Missense_Mutation | rs747435012 | c.517N>A | p.Glu173Lys | p.E173K | Q96IK1 | protein_coding | tolerated(0.08) | benign(0.089) | TCGA-AP-A1DK-01 | Endometrium | uterine corpus endometrioid carcinoma | Female | <65 | I/II | Unknown | Unknown | SD |
| BOD1 | SNV | Missense_Mutation | rs758005393 | c.254N>C | p.Leu85Pro | p.L85P | Q96IK1 | protein_coding | deleterious(0.02) | benign(0.333) | TCGA-BG-A0VZ-01 | Endometrium | uterine corpus endometrioid carcinoma | Female | <65 | III/IV | Chemotherapy | cisplatin | CR |
| BOD1 | SNV | Missense_Mutation | rs565588980 | c.541T>A | p.Ser181Thr | p.S181T | Q96IK1 | protein_coding | tolerated(0.09) | benign(0.014) | TCGA-D1-A175-01 | Endometrium | uterine corpus endometrioid carcinoma | Female | <65 | I/II | Chemotherapy | paclitaxel | SD |
| BOD1 | SNV | Missense_Mutation | novel | c.425N>G | p.Asn142Ser | p.N142S | Q96IK1 | protein_coding | tolerated(0.13) | possibly_damaging(0.518) | TCGA-BC-A8YO-01 | Liver | liver hepatocellular carcinoma | Female | >=65 | III/IV | Targeted Molecular therapy | sorafenib | PD |
| BOD1 | SNV | Missense_Mutation | novel | c.505N>A | p.Pro169Thr | p.P169T | Q96IK1 | protein_coding | tolerated(0.05) | possibly_damaging(0.469) | TCGA-18-3419-01 | Lung | lung squamous cell carcinoma | Male | >=65 | I/II | Unknown | Unknown | SD |
| BOD1 | insertion | Frame_Shift_Ins | novel | c.486dupA | p.Ala163SerfsTer34 | p.A163Sfs*34 | Q96IK1 | protein_coding | TCGA-VQ-A94U-01 | Stomach | stomach adenocarcinoma | Male | >=65 | I/II | Unknown | Unknown | SD |
| Page: 1 |
Top |
Related drugs of malignant transformation related genes |
| Identification of chemicals and drugs interact with genes involved in malignant transfromation |
| (DGIdb 4.0) |
| Entrez ID | Symbol | Category | Interaction Types | Drug Claim Name | Drug Name | PMIDs |
| Page: 1 |

Copyright 2023-Present -The University of Texas Health Science Center at Houston |