Schematic overview of the cellular and molecular mechanisms involved in the cancer progression, including the proposed cellular and molecular mechanisms in cancer cells trajectory. AT1: alveolar type 1 cells; AT2: alveolar type 2 cells; AAH: atypical adenomatous hyperplasia; AIS: adenocarcinoma in situ; MIA: minimally invasive adenocarcinoma; IA: invasive adenocarcinoma; EMT: epithelial-mesenchymal transition

Home

Download

Statistics

Help

Contact

Center for Computational Systems Medicine
leaf

Gene summary

leaf

Malignant transformation analysis

leaf

Malignant transformation related pathway analysis

leaf

Cell-cell communication analysis

leaf

Single-cell gene regulatory network inference analysis

leaf

Somatic mutation of malignant transformation related genes

leaf

Related drugs of malignant transformation related genes

Gene: BHLHE40

Gene summary for BHLHE40

check button Gene summary.

Gene informationSpeciesHuman
Gene symbol

BHLHE40

Gene ID

8553

Gene namebasic helix-loop-helix family member e40
Gene AliasBHLHB2
Cytomap3p26.1
Gene Typeprotein-coding
GO ID

GO:0000122

UniProtAcc

O14503


Top

Malignant transformation analysis

check button Identification of the aberrant gene expression in precancerous and cancerous lesions by comparing the gene expression of stem-like cells in diseased tissues with normal stem cells
check button Malignant transformation involving gene list.
Entrez IDSymbolReplicatesSpeciesOrganTissueAdj P-valueLog2FCMalignancy
8553BHLHE40GSM4909281HumanBreastIDC1.01e-04-3.46e-010.21
8553BHLHE40GSM4909285HumanBreastIDC3.82e-107.88e-020.21
8553BHLHE40GSM4909286HumanBreastIDC1.63e-22-5.36e-010.1081
8553BHLHE40GSM4909290HumanBreastIDC4.99e-02-3.48e-010.2096
8553BHLHE40GSM4909293HumanBreastIDC1.56e-05-2.11e-010.1581
8553BHLHE40GSM4909294HumanBreastIDC5.73e-17-4.63e-010.2022
8553BHLHE40GSM4909296HumanBreastIDC1.36e-06-3.75e-010.1524
8553BHLHE40GSM4909298HumanBreastIDC7.74e-08-1.43e-020.1551
8553BHLHE40GSM4909308HumanBreastIDC2.69e-038.69e-020.158
8553BHLHE40GSM4909311HumanBreastIDC5.34e-12-2.93e-010.1534
8553BHLHE40GSM4909319HumanBreastIDC1.25e-13-1.65e-010.1563
8553BHLHE40GSM4909320HumanBreastIDC1.07e-02-4.54e-010.1575
8553BHLHE40ctrl6HumanBreastPrecancer5.47e-281.11e+00-0.0061
8553BHLHE40brca1HumanBreastPrecancer1.27e-09-3.97e-01-0.0338
8553BHLHE40brca2HumanBreastPrecancer2.56e-045.31e-02-0.024
8553BHLHE40brca7HumanBreastPrecancer1.24e-071.04e+00-0.009
8553BHLHE40brca10HumanBreastPrecancer7.85e-811.42e+00-0.0029
8553BHLHE40NCCBC5HumanBreastDCIS2.90e-02-2.98e-010.2046
8553BHLHE40P1HumanBreastIDC1.26e-03-2.47e-010.1527
8553BHLHE40DCIS2HumanBreastDCIS5.58e-301.95e-020.0085
Page: 1 2 3 4 5 6 7 8 9 10 11 

check button Transcriptomic changes along malignancy continuum.
TissueExpression DynamicsAbbreviation
BreastThe image shows the transcriptomic changes along malignancy continuum.log2FC in expression of this searched gene in stem-like cells from each diseased tissue sample relative to stem-like cells in normal samples in each tissue plotted against the malignancy continuum. Samples are colored based on if they are from different disease stage.
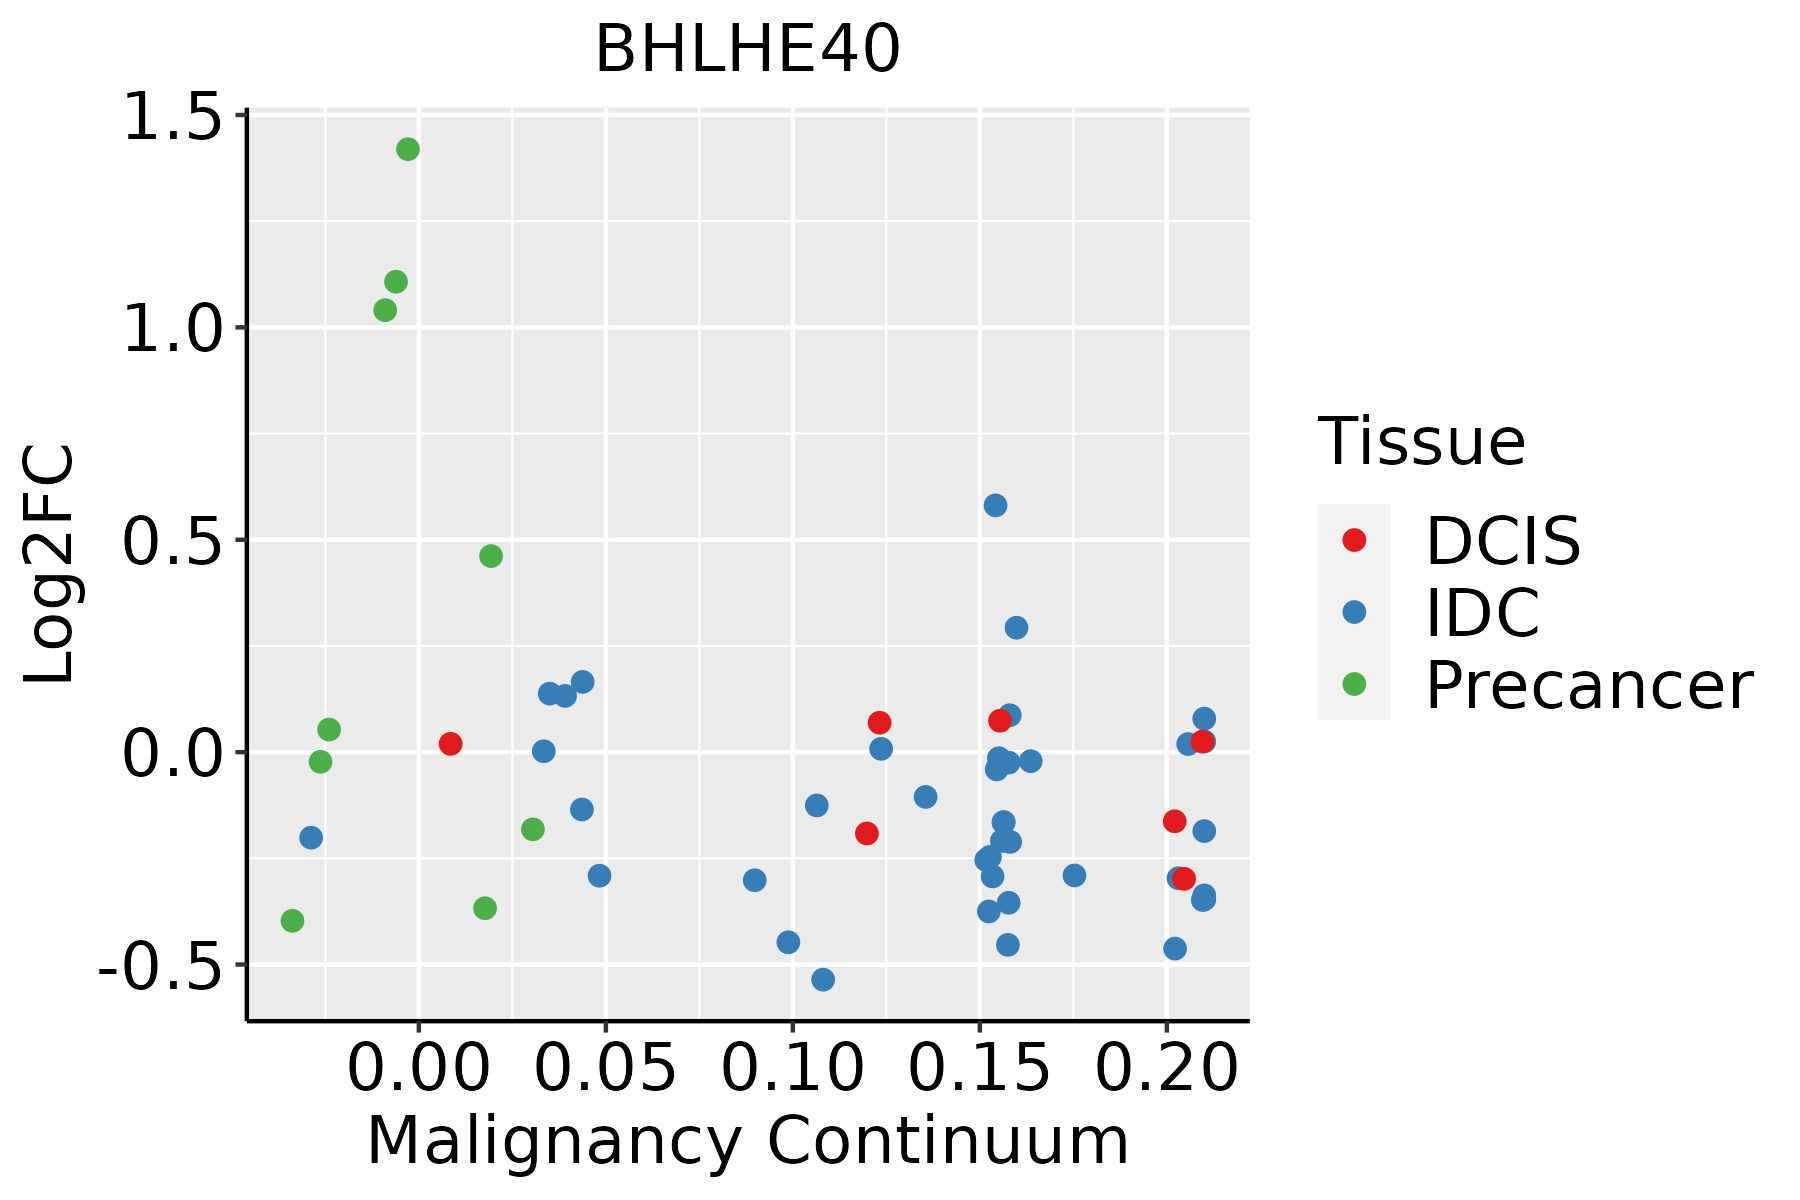
IDC: Invasive ductal carcinoma
DCIS: Ductal carcinoma in situ
Precancer(BRCA1-mut): Precancerous lesion from BRCA1 mutation carriers
EndometriumThe image shows the transcriptomic changes along malignancy continuum.log2FC in expression of this searched gene in stem-like cells from each diseased tissue sample relative to stem-like cells in normal samples in each tissue plotted against the malignancy continuum. Samples are colored based on if they are from different disease stage.AEH: Atypical endometrial hyperplasia
EEC: Endometrioid Cancer
EsophagusThe image shows the transcriptomic changes along malignancy continuum.log2FC in expression of this searched gene in stem-like cells from each diseased tissue sample relative to stem-like cells in normal samples in each tissue plotted against the malignancy continuum. Samples are colored based on if they are from different disease stage.
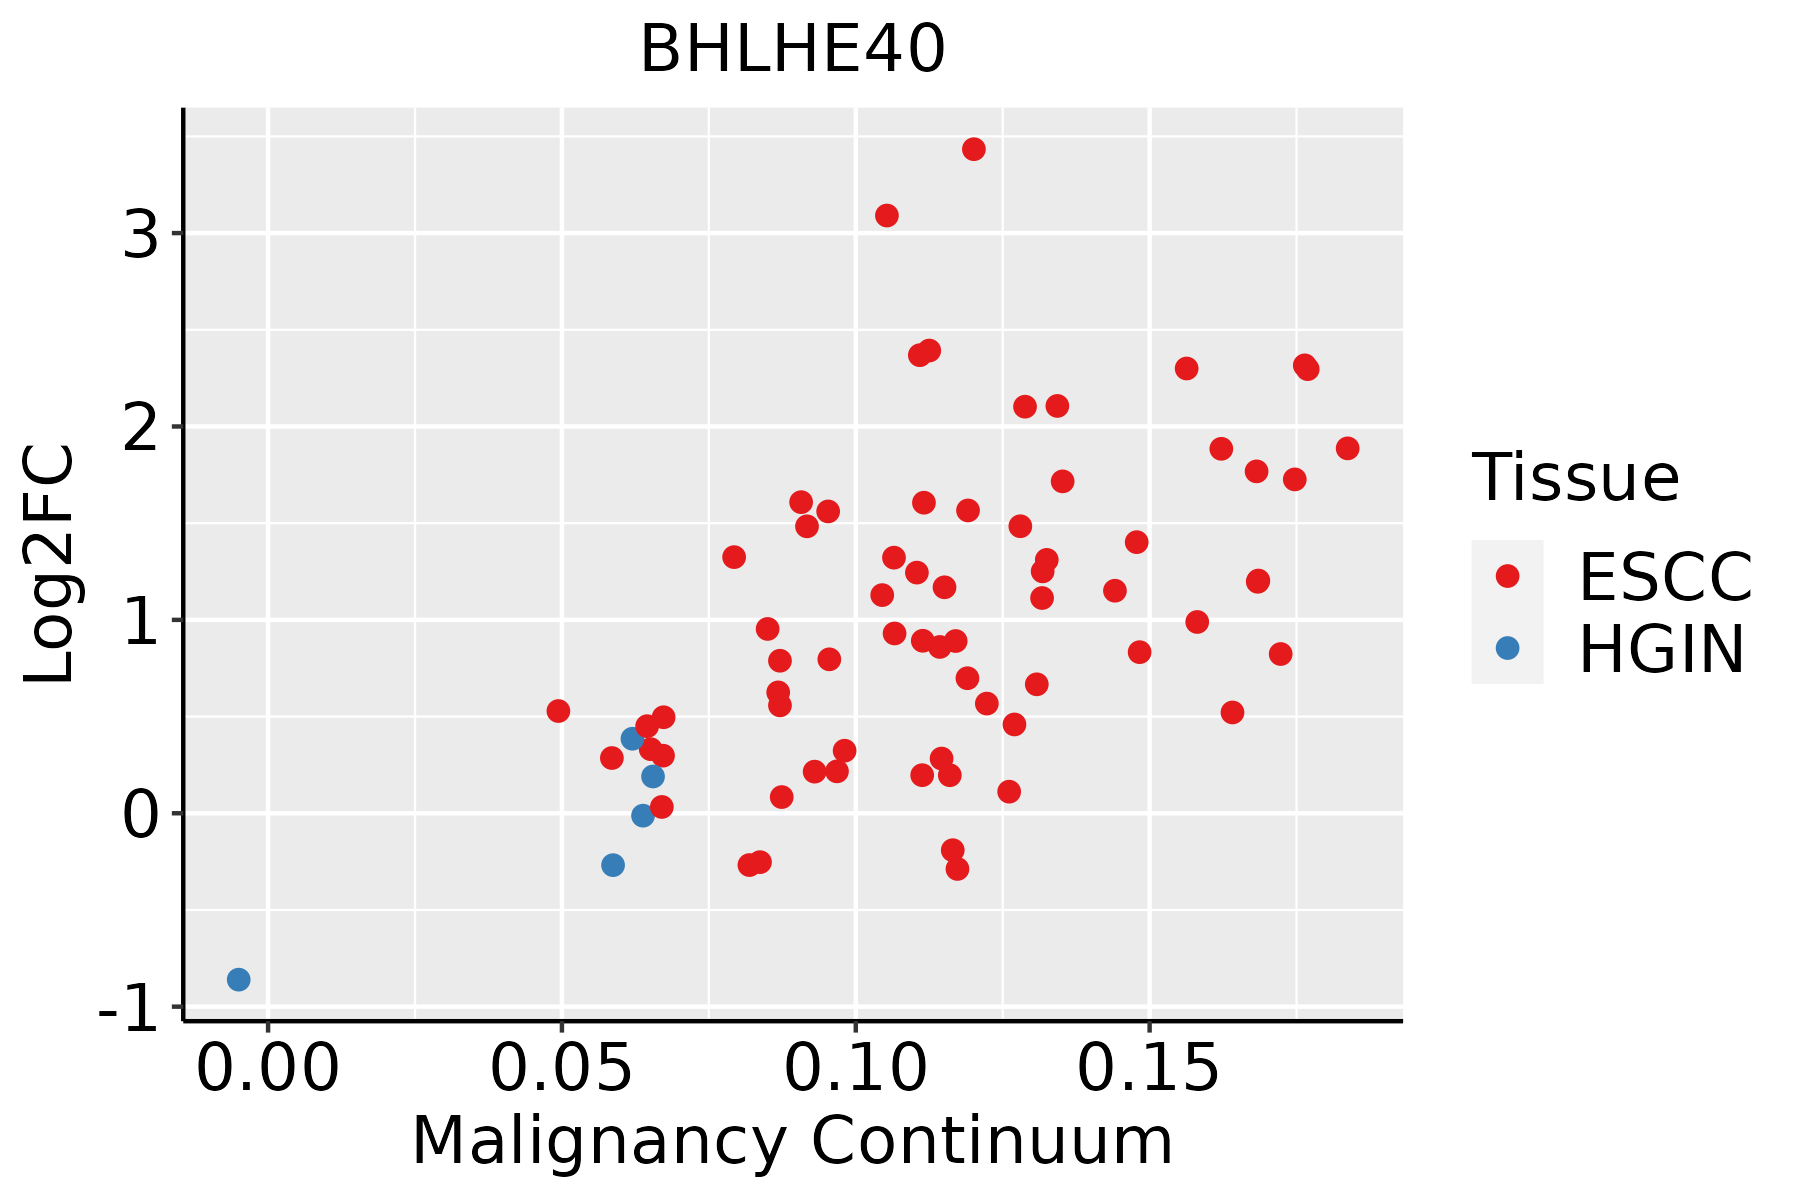
ESCC: Esophageal squamous cell carcinoma
HGIN: High-grade intraepithelial neoplasias
LGIN: Low-grade intraepithelial neoplasias
GCThe image shows the transcriptomic changes along malignancy continuum.log2FC in expression of this searched gene in stem-like cells from each diseased tissue sample relative to stem-like cells in normal samples in each tissue plotted against the malignancy continuum. Samples are colored based on if they are from different disease stage.
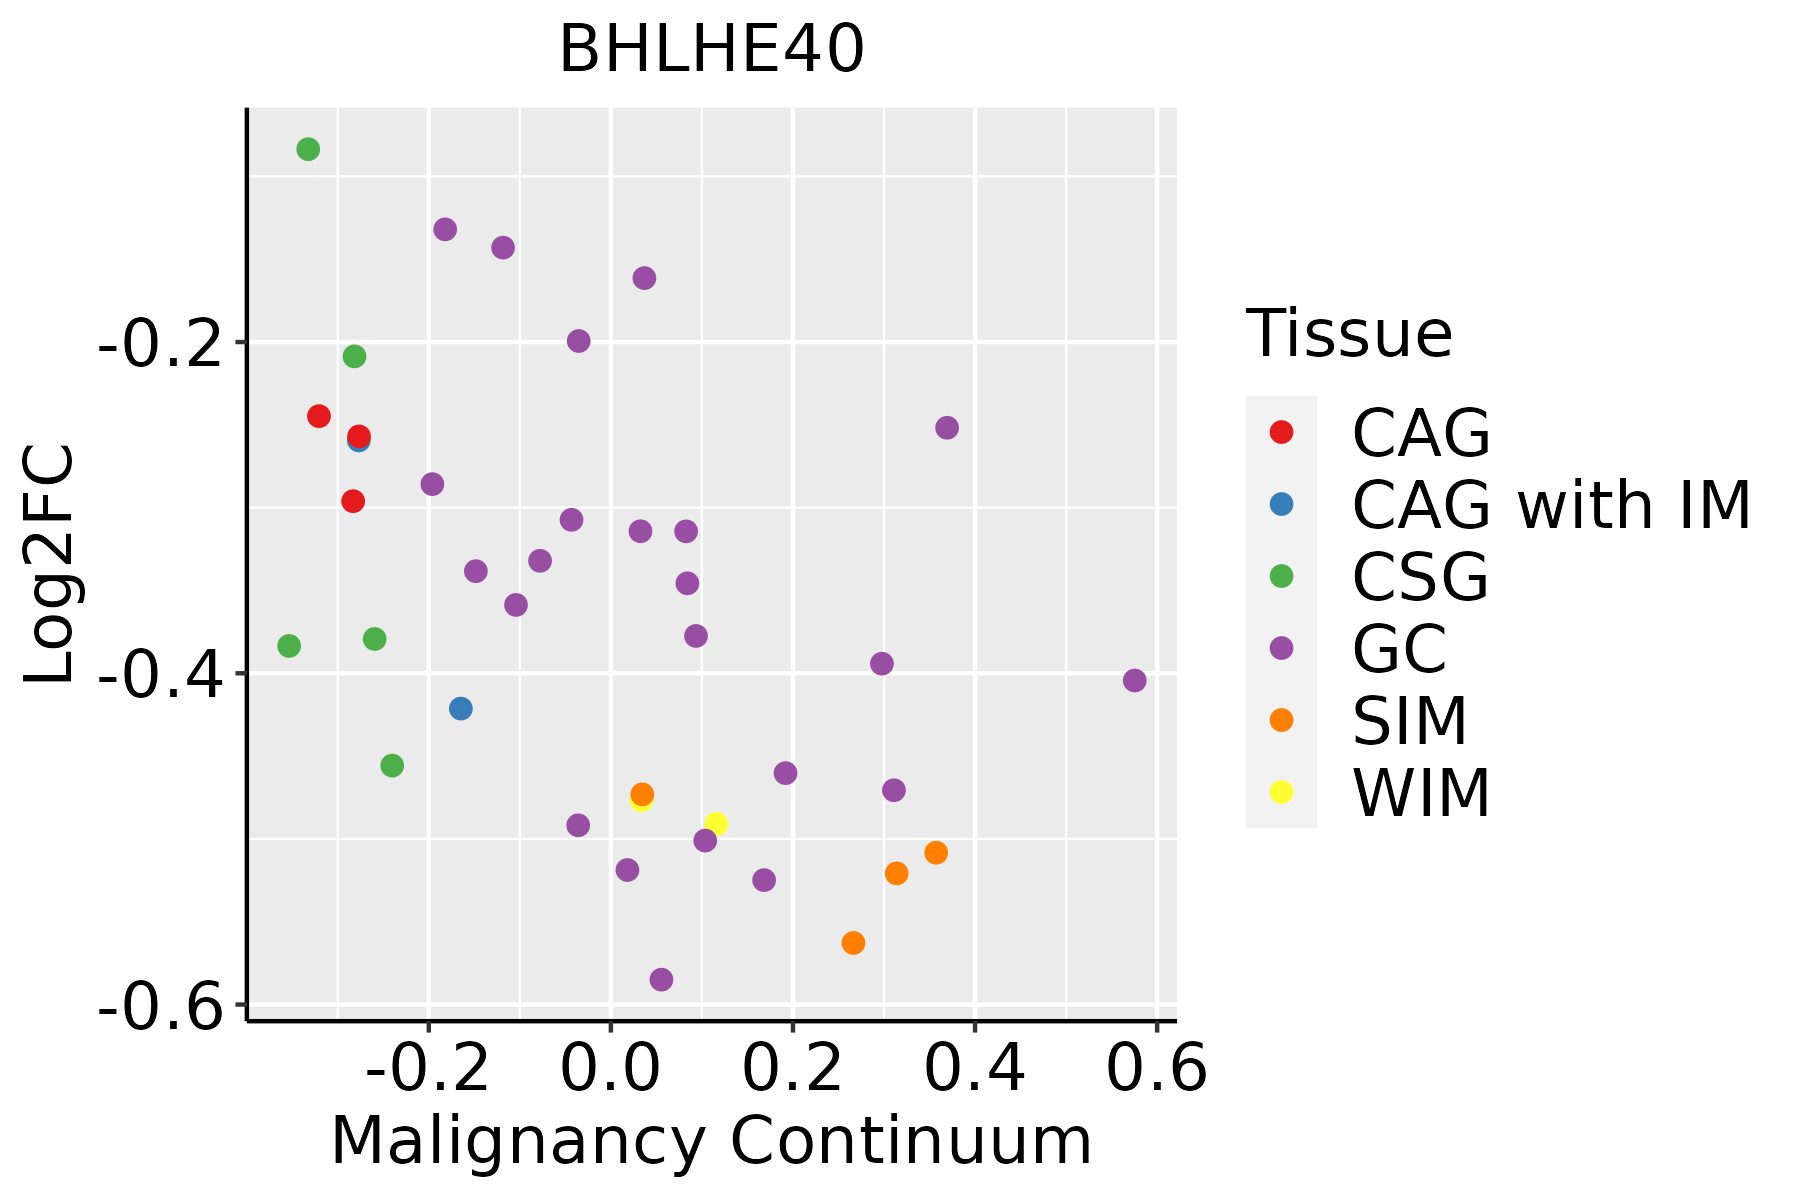
CAG: Chronic atrophic gastritis
CAG with IM: Chronic atrophic gastritis with intestinal metaplasia
CSG: Chronic superficial gastritis
GC: Gastric cancer
SIM: Severe intestinal metaplasia
WIM: Wild intestinal metaplasia
LiverThe image shows the transcriptomic changes along malignancy continuum.log2FC in expression of this searched gene in stem-like cells from each diseased tissue sample relative to stem-like cells in normal samples in each tissue plotted against the malignancy continuum. Samples are colored based on if they are from different disease stage.
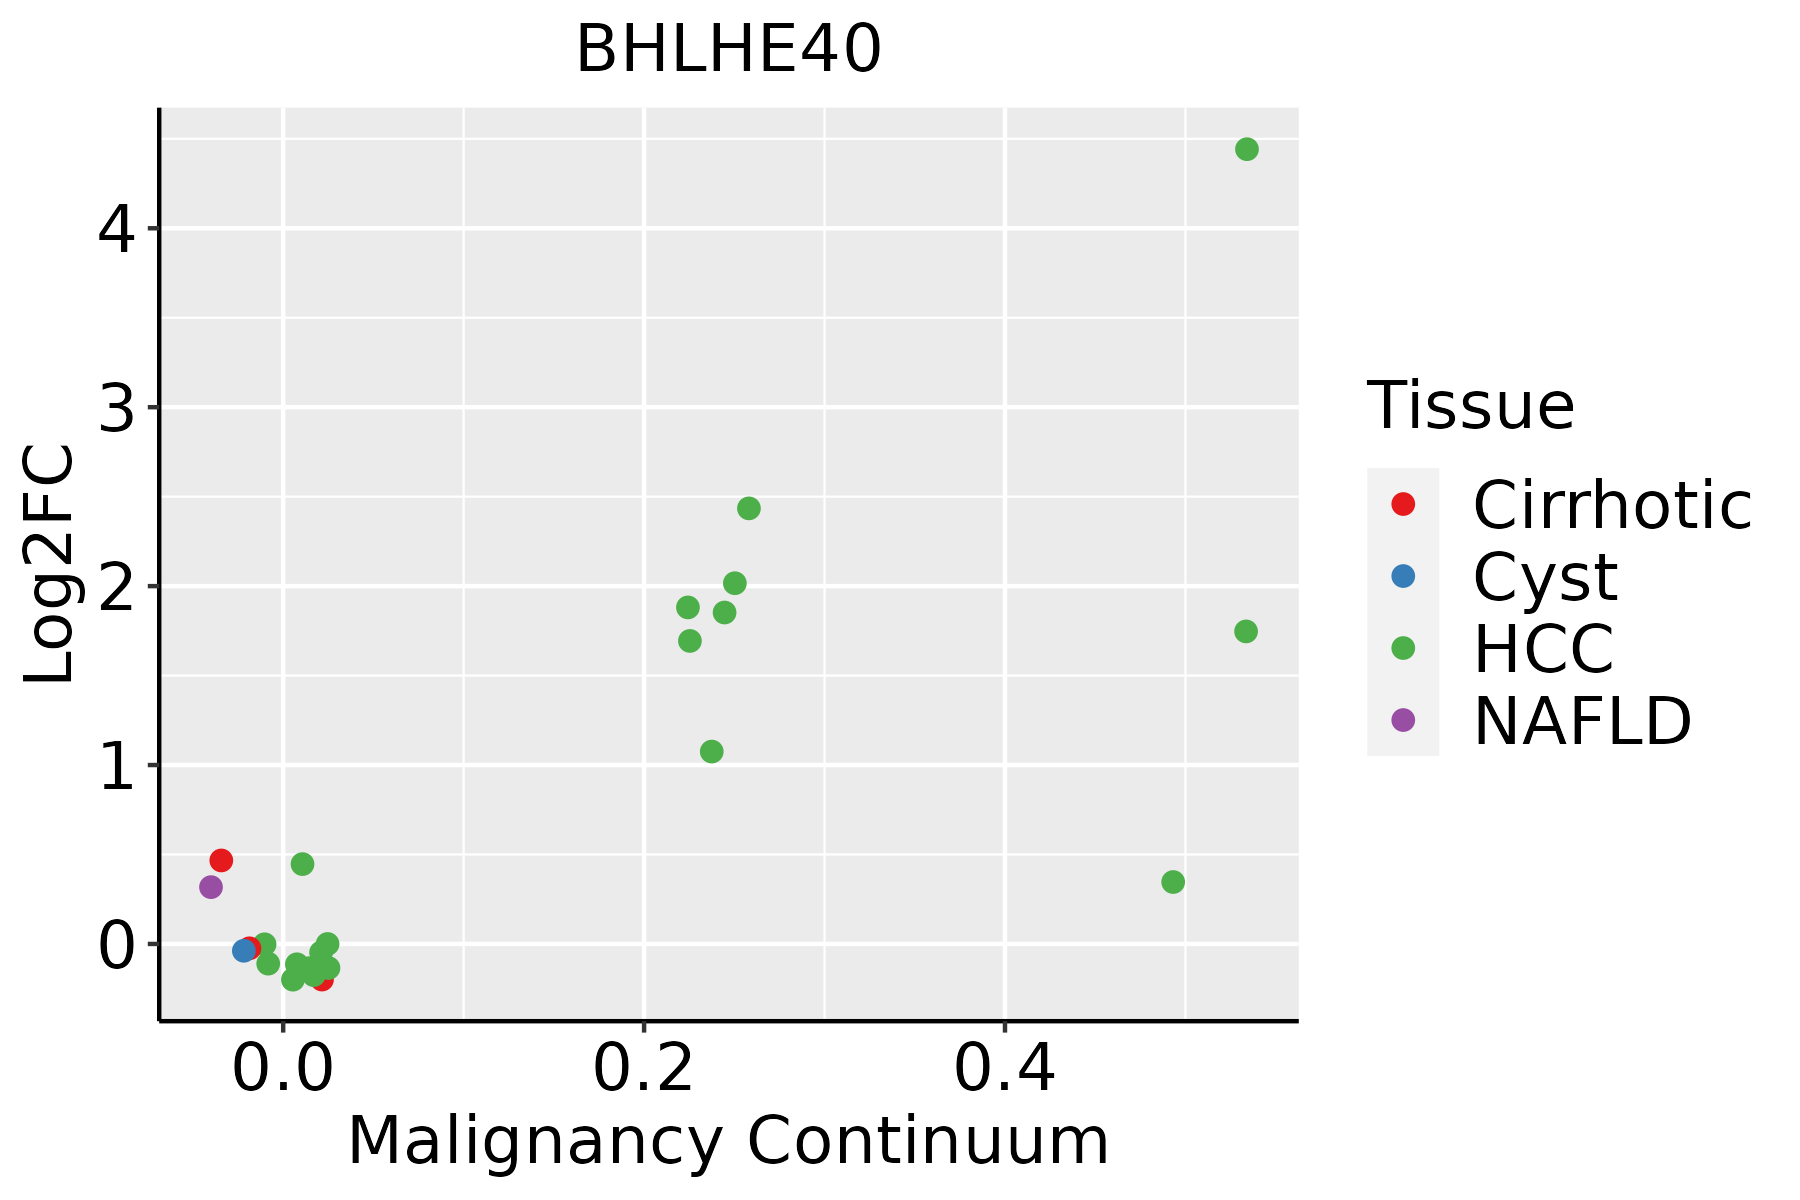
HCC: Hepatocellular carcinoma
NAFLD: Non-alcoholic fatty liver disease
LungThe image shows the transcriptomic changes along malignancy continuum.log2FC in expression of this searched gene in stem-like cells from each diseased tissue sample relative to stem-like cells in normal samples in each tissue plotted against the malignancy continuum. Samples are colored based on if they are from different disease stage.AAH: Atypical adenomatous hyperplasia
AIS: Adenocarcinoma in situ
IAC: Invasive lung adenocarcinoma
MIA: Minimally invasive adenocarcinoma
Oral CavityThe image shows the transcriptomic changes along malignancy continuum.log2FC in expression of this searched gene in stem-like cells from each diseased tissue sample relative to stem-like cells in normal samples in each tissue plotted against the malignancy continuum. Samples are colored based on if they are from different disease stage.
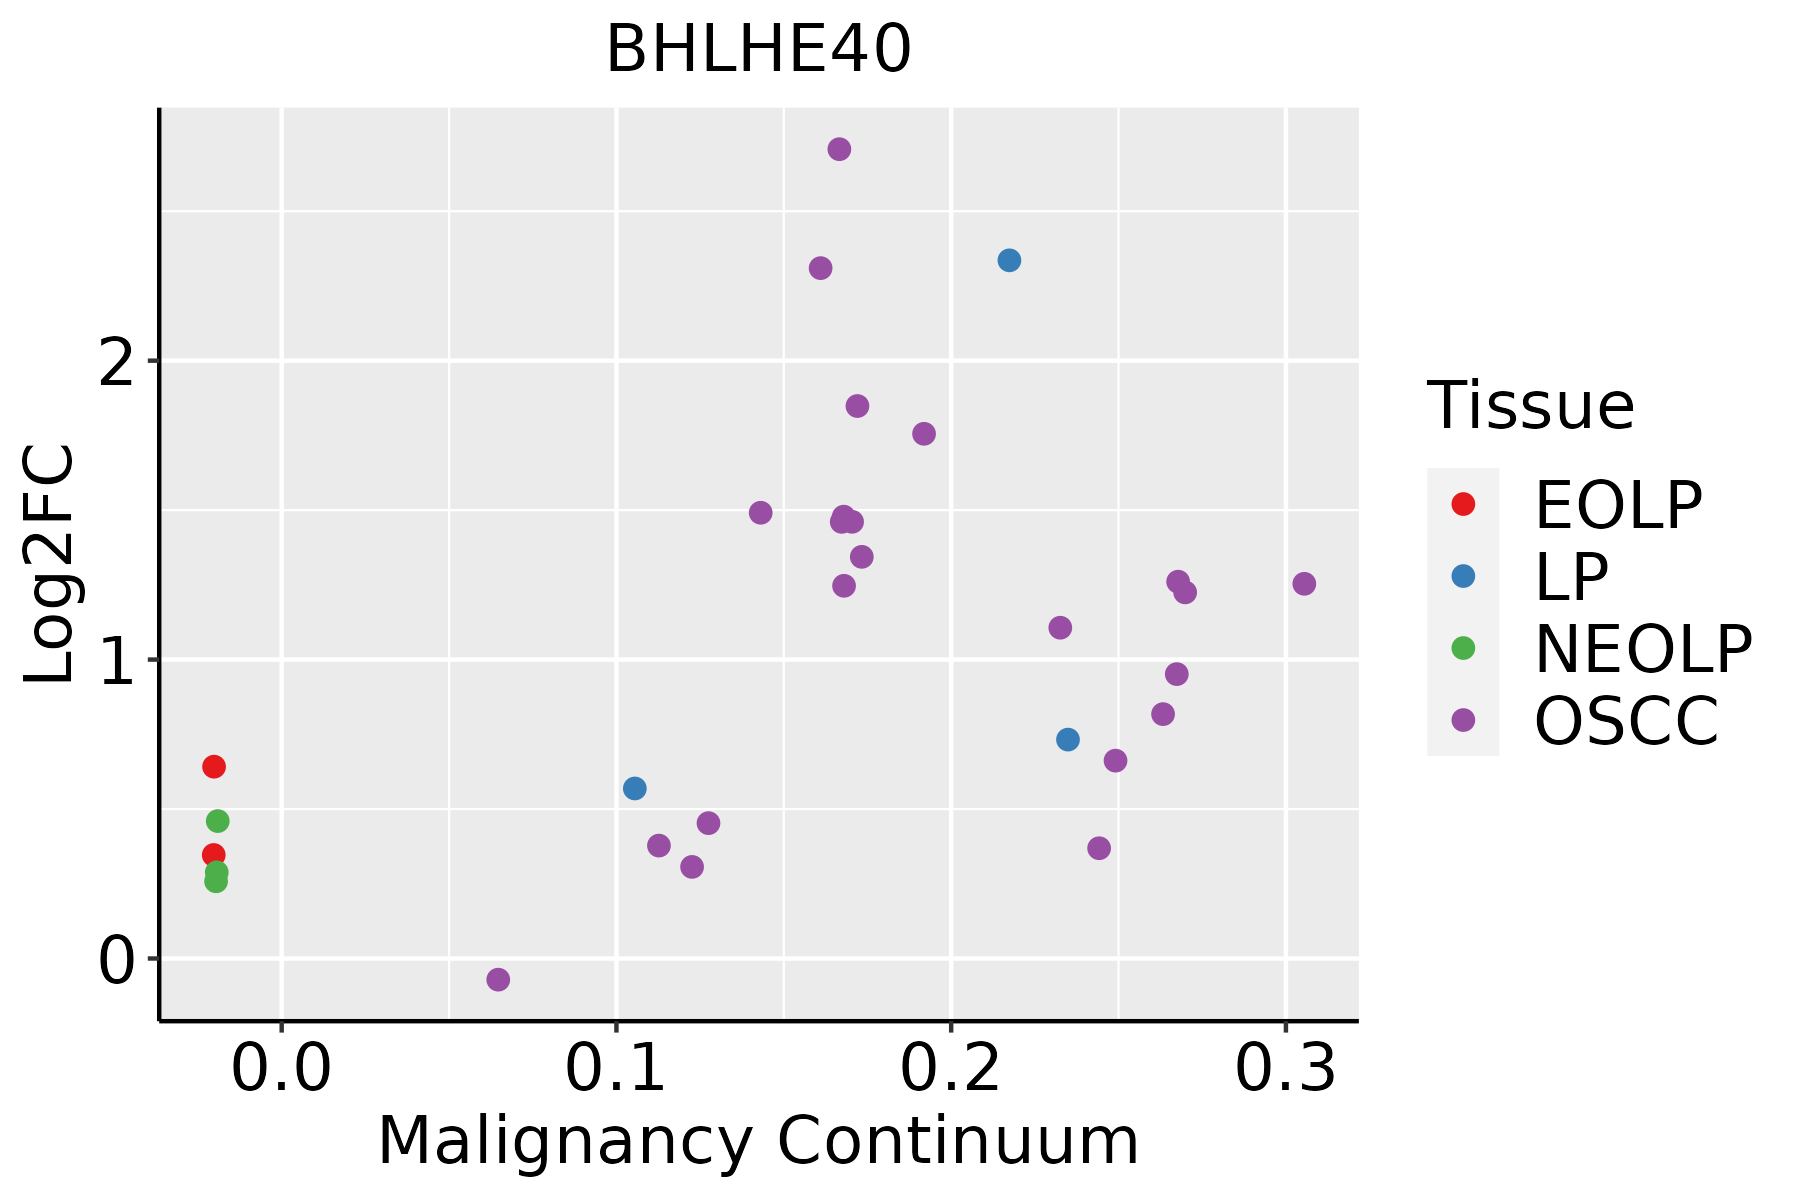
EOLP: Erosive Oral lichen planus
LP: leukoplakia
NEOLP: Non-erosive oral lichen planus
OSCC: Oral squamous cell carcinoma
ProstateThe image shows the transcriptomic changes along malignancy continuum.log2FC in expression of this searched gene in stem-like cells from each diseased tissue sample relative to stem-like cells in normal samples in each tissue plotted against the malignancy continuum. Samples are colored based on if they are from different disease stage.BPH: Benign Prostatic Hyperplasia
SkinThe image shows the transcriptomic changes along malignancy continuum.log2FC in expression of this searched gene in stem-like cells from each diseased tissue sample relative to stem-like cells in normal samples in each tissue plotted against the malignancy continuum. Samples are colored based on if they are from different disease stage.AK: Actinic keratosis
cSCC: Cutaneous squamous cell carcinoma
SCCIS:squamous cell carcinoma in situ
ThyroidThe image shows the transcriptomic changes along malignancy continuum.log2FC in expression of this searched gene in stem-like cells from each diseased tissue sample relative to stem-like cells in normal samples in each tissue plotted against the malignancy continuum. Samples are colored based on if they are from different disease stage.ATC: Anaplastic thyroid cancer
HT: Hashimoto's thyroiditis
PTC: Papillary thyroid cancer
∗log2FC in expression of this searched gene in stem-like cells from each diseased tissue sample relative to stem-like cells in normal samples in each tissue plotted against the malignancy continuum. Samples are colored based on if they are from different disease stage.

Top

Malignant transformation related pathway analysis

check buttonFind out the enriched GO biological processes and KEGG pathways involved in transition from healthy to precancer to cancer
check button Figure of enriched GO biological processes.
TissueDisease StageEnriched GO biological Processes
ColorectumADGO analysis - Figure of enriched GO biological processes: Top 15 enriched GO BP terms are showed in the bar plot of each disease state in each tissue. Each row represents a significant GO biological process which is colored according to the -log10(p.adjust).
ColorectumSERGO analysis - Figure of enriched GO biological processes: Top 15 enriched GO BP terms are showed in the bar plot of each disease state in each tissue. Each row represents a significant GO biological process which is colored according to the -log10(p.adjust).
ColorectumMSSGO analysis - Figure of enriched GO biological processes: Top 15 enriched GO BP terms are showed in the bar plot of each disease state in each tissue. Each row represents a significant GO biological process which is colored according to the -log10(p.adjust).
ColorectumMSI-HGO analysis - Figure of enriched GO biological processes: Top 15 enriched GO BP terms are showed in the bar plot of each disease state in each tissue. Each row represents a significant GO biological process which is colored according to the -log10(p.adjust).
ColorectumFAPGO analysis - Figure of enriched GO biological processes: Top 15 enriched GO BP terms are showed in the bar plot of each disease state in each tissue. Each row represents a significant GO biological process which is colored according to the -log10(p.adjust).
∗Top 15 enriched GO BP terms are showed in the bar plot of each disease state in each tissue. Each row represents a significant GO biological process which is colored according to the -log10(p.adjust).
Page: 1 2 3 4 5 6 7 8 9 

check button Enriched GO biological processes.
GO IDTissueDisease StageDescriptionGene RatioBg Ratiopvaluep.adjustCount
GO:005196012Oral cavityNEOLPregulation of nervous system development68/2005443/187231.46e-031.03e-0268
GO:004851110ProstateBPHrhythmic process96/3107298/187231.88e-111.31e-0996
GO:000762310ProstateBPHcircadian rhythm73/3107210/187231.02e-106.02e-0973
GO:00329228ProstateBPHcircadian regulation of gene expression34/310768/187232.01e-101.12e-0834
GO:00507678ProstateBPHregulation of neurogenesis92/3107364/187231.36e-051.78e-0492
GO:00427528ProstateBPHregulation of circadian rhythm37/3107121/187239.71e-059.04e-0437
GO:000931414ProstateBPHresponse to radiation105/3107456/187232.07e-041.70e-03105
GO:00510906ProstateBPHregulation of DNA-binding transcription factor activity100/3107440/187234.71e-043.37e-03100
GO:00519604ProstateBPHregulation of nervous system development100/3107443/187236.02e-044.16e-03100
GO:004851115ProstateTumorrhythmic process99/3246298/187231.65e-111.21e-0999
GO:000762315ProstateTumorcircadian rhythm75/3246210/187231.09e-106.79e-0975
GO:003292213ProstateTumorcircadian regulation of gene expression34/324668/187236.70e-103.39e-0834
GO:005076711ProstateTumorregulation of neurogenesis93/3246364/187234.45e-055.02e-0493
GO:004275214ProstateTumorregulation of circadian rhythm39/3246121/187234.69e-055.21e-0439
GO:000931415ProstateTumorresponse to radiation109/3246456/187231.94e-041.70e-03109
GO:005109014ProstateTumorregulation of DNA-binding transcription factor activity105/3246440/187232.69e-042.23e-03105
GO:005196011ProstateTumorregulation of nervous system development102/3246443/187231.20e-037.60e-03102
GO:00096491ProstateTumorentrainment of circadian clock12/324634/187239.19e-033.95e-0212
GO:000762323SkincSCCcircadian rhythm89/4864210/187231.55e-073.51e-0689
GO:000931424SkincSCCresponse to radiation166/4864456/187234.37e-078.41e-06166
Page: 1 2 3 4 5 6 7 

check button Enriched KEGG pathways.
Pathway IDTissueDisease StageDescriptionGene RatioBg Ratiopvaluep.adjustqvalueCount
hsa047105EsophagusESCCCircadian rhythm24/420534/84651.09e-022.51e-021.29e-0224
hsa0471012EsophagusESCCCircadian rhythm24/420534/84651.09e-022.51e-021.29e-0224
hsa047104ProstateBPHCircadian rhythm15/171834/84651.40e-035.85e-033.62e-0315
hsa0471011ProstateBPHCircadian rhythm15/171834/84651.40e-035.85e-033.62e-0315
Page: 1 

Top

Cell-cell communication analysis

check buttonIdentification of potential cell-cell interactions between two cell types and their ligand-receptor pairs for different disease states
LigandReceptorLRpairPathwayTissueDisease Stage
Page: 1 

Top

Single-cell gene regulatory network inference analysis

check buttonFind out the significant the regulons (TFs) and the target genes of each regulon across cell types for different disease states
TFCell TypeTissueDisease StageTarget GeneRSSRegulon Activity
BHLHE40CTColorectumADJDUOX2,DUOXA2,CKB, etc.6.23e-02The dot plots of a searched regulon are shown for all cell subpopulations in each disease state of each tissue based on the regulon specific score inferred using pySCENIC and by calculating the average expression.
BHLHE40DUCT1PancreasPDACSLC2A1,VMP1,VEGFA, etc.6.33e-01The dot plots of a searched regulon are shown for all cell subpopulations in each disease state of each tissue based on the regulon specific score inferred using pySCENIC and by calculating the average expression.
∗The dot plots of a searched regulon are shown for all cell subpopulations in each disease state of each tissue based on the regulon specific score inferred using pySCENIC and by calculating the average expression.
Page: 1 

Top

Somatic mutation of malignant transformation related genes

check buttonAnnotation of somatic variants for genes involved in malignant transformation
Hugo SymbolVariant ClassVariant ClassificationdbSNP RSHGVScHGVSpHGVSp ShortSWISSPROTBIOTYPESIFTPolyPhenTumor Sample BarcodeTissueHistologySexAgeStageTherapy TypesDrugsOutcome
BHLHE40deletionIn_Frame_Delc.344_352delNNNNNNNNNp.Gln115_Ile118delinsLeup.Q115_I118delinsLO14503protein_codingTCGA-A8-A09I-01Breastbreast invasive carcinomaFemale>=65I/IIHormone TherapyanastrozoleSD
BHLHE40insertionIn_Frame_Insnovelc.456_457insCTTACCTTGAAGCATp.Glu152_Val153insLeuThrLeuLysHisp.E152_V153insLTLKHO14503protein_codingTCGA-BH-A0B1-01Breastbreast invasive carcinomaFemale>=65I/IIChemotherapyadriamycinSD
BHLHE40insertionIn_Frame_Insnovelc.458_459insGAAAGCACTAACAAACCTAATTGATCAGCAp.Val153_Leu154insLysAlaLeuThrAsnLeuIleAspGlnGlnp.V153_L154insKALTNLIDQQO14503protein_codingTCGA-BH-A0B1-01Breastbreast invasive carcinomaFemale>=65I/IIChemotherapyadriamycinSD
BHLHE40insertionFrame_Shift_Insnovelc.1185_1186insAp.Leu396IlefsTer35p.L396Ifs*35O14503protein_codingTCGA-BH-A0EE-01Breastbreast invasive carcinomaFemale>=65I/IIChemotherapydocetaxelSD
BHLHE40insertionFrame_Shift_Insnovelc.1187_1188insTTCAGGATTCCCTAp.Leu396PhefsTer10p.L396Ffs*10O14503protein_codingTCGA-BH-A0EE-01Breastbreast invasive carcinomaFemale>=65I/IIChemotherapydocetaxelSD
BHLHE40SNVMissense_Mutationnovelc.91G>Ap.Ala31Thrp.A31TO14503protein_codingtolerated(0.47)benign(0.001)TCGA-2W-A8YY-01Cervixcervical & endocervical cancerFemale<65I/IIChemotherapycisplatinCR
BHLHE40SNVMissense_Mutationnovelc.208N>Cp.Glu70Glnp.E70QO14503protein_codingdeleterious(0)probably_damaging(0.93)TCGA-VS-A958-01Cervixcervical & endocervical cancerFemale<65I/IIChemotherapycisplatinCR
BHLHE40SNVMissense_Mutationrs775412121c.635N>Tp.Ser212Leup.S212LO14503protein_codingtolerated(0.26)benign(0.048)TCGA-AZ-4315-01Colorectumcolon adenocarcinomaMale<65I/IIUnknownUnknownSD
BHLHE40SNVMissense_Mutationc.353N>Gp.Ile118Serp.I118SO14503protein_codingdeleterious(0)possibly_damaging(0.745)TCGA-CA-6718-01Colorectumcolon adenocarcinomaMale<65I/IIUnknownUnknownPD
BHLHE40SNVMissense_Mutationc.1105N>Tp.Asp369Tyrp.D369YO14503protein_codingdeleterious(0)possibly_damaging(0.707)TCGA-F4-6856-01Colorectumcolon adenocarcinomaMale<65I/IIAncillaryleucovorinCR
Page: 1 2 3 4 5 

Top

Related drugs of malignant transformation related genes

check buttonIdentification of chemicals and drugs interact with genes involved in malignant transfromation
(DGIdb 4.0)
Entrez IDSymbolCategoryInteraction TypesDrug Claim NameDrug NamePMIDs
8553BHLHE40NATRICHOSTATIN A10737769
8553BHLHE40NARETINOIC ACID10737769
Page: 1