Schematic overview of the cellular and molecular mechanisms involved in the cancer progression, including the proposed cellular and molecular mechanisms in cancer cells trajectory. AT1: alveolar type 1 cells; AT2: alveolar type 2 cells; AAH: atypical adenomatous hyperplasia; AIS: adenocarcinoma in situ; MIA: minimally invasive adenocarcinoma; IA: invasive adenocarcinoma; EMT: epithelial-mesenchymal transition

Home

Download

Statistics

Help

Contact

Center for Computational Systems Medicine
leaf

Gene summary

leaf

Malignant transformation analysis

leaf

Malignant transformation related pathway analysis

leaf

Cell-cell communication analysis

leaf

Single-cell gene regulatory network inference analysis

leaf

Somatic mutation of malignant transformation related genes

leaf

Related drugs of malignant transformation related genes

Gene: BAG5

Gene summary for BAG5

check button Gene summary.

Gene informationSpeciesHuman
Gene symbol

BAG5

Gene ID

9529

Gene nameBAG cochaperone 5
Gene AliasBAG-5
Cytomap14q32.33
Gene Typeprotein-coding
GO ID

GO:0006457

UniProtAcc

A0A024R6M6


Top

Malignant transformation analysis

check button Identification of the aberrant gene expression in precancerous and cancerous lesions by comparing the gene expression of stem-like cells in diseased tissues with normal stem cells
check button Malignant transformation involving gene list.
Entrez IDSymbolReplicatesSpeciesOrganTissueAdj P-valueLog2FCMalignancy
9529BAG5LZE4THumanEsophagusESCC3.55e-092.53e-010.0811
9529BAG5LZE7THumanEsophagusESCC1.89e-031.46e-010.0667
9529BAG5LZE8THumanEsophagusESCC1.17e-051.71e-020.067
9529BAG5LZE20THumanEsophagusESCC2.68e-078.45e-020.0662
9529BAG5LZE24THumanEsophagusESCC3.03e-124.02e-010.0596
9529BAG5LZE6THumanEsophagusESCC9.62e-032.86e-020.0845
9529BAG5P1T-EHumanEsophagusESCC3.28e-031.78e-010.0875
9529BAG5P2T-EHumanEsophagusESCC1.13e-202.58e-010.1177
9529BAG5P4T-EHumanEsophagusESCC9.09e-164.40e-010.1323
9529BAG5P5T-EHumanEsophagusESCC3.96e-153.15e-010.1327
9529BAG5P8T-EHumanEsophagusESCC8.37e-163.43e-010.0889
9529BAG5P9T-EHumanEsophagusESCC1.26e-041.13e-010.1131
9529BAG5P10T-EHumanEsophagusESCC3.29e-611.25e+000.116
9529BAG5P11T-EHumanEsophagusESCC2.49e-092.65e-010.1426
9529BAG5P12T-EHumanEsophagusESCC1.25e-266.40e-010.1122
9529BAG5P15T-EHumanEsophagusESCC2.58e-266.03e-010.1149
9529BAG5P16T-EHumanEsophagusESCC9.41e-152.95e-010.1153
9529BAG5P17T-EHumanEsophagusESCC6.47e-142.97e-010.1278
9529BAG5P20T-EHumanEsophagusESCC6.63e-142.10e-010.1124
9529BAG5P21T-EHumanEsophagusESCC6.63e-152.12e-010.1617
Page: 1 2 3 4 5 6 

check button Transcriptomic changes along malignancy continuum.
TissueExpression DynamicsAbbreviation
EsophagusThe image shows the transcriptomic changes along malignancy continuum.log2FC in expression of this searched gene in stem-like cells from each diseased tissue sample relative to stem-like cells in normal samples in each tissue plotted against the malignancy continuum. Samples are colored based on if they are from different disease stage.
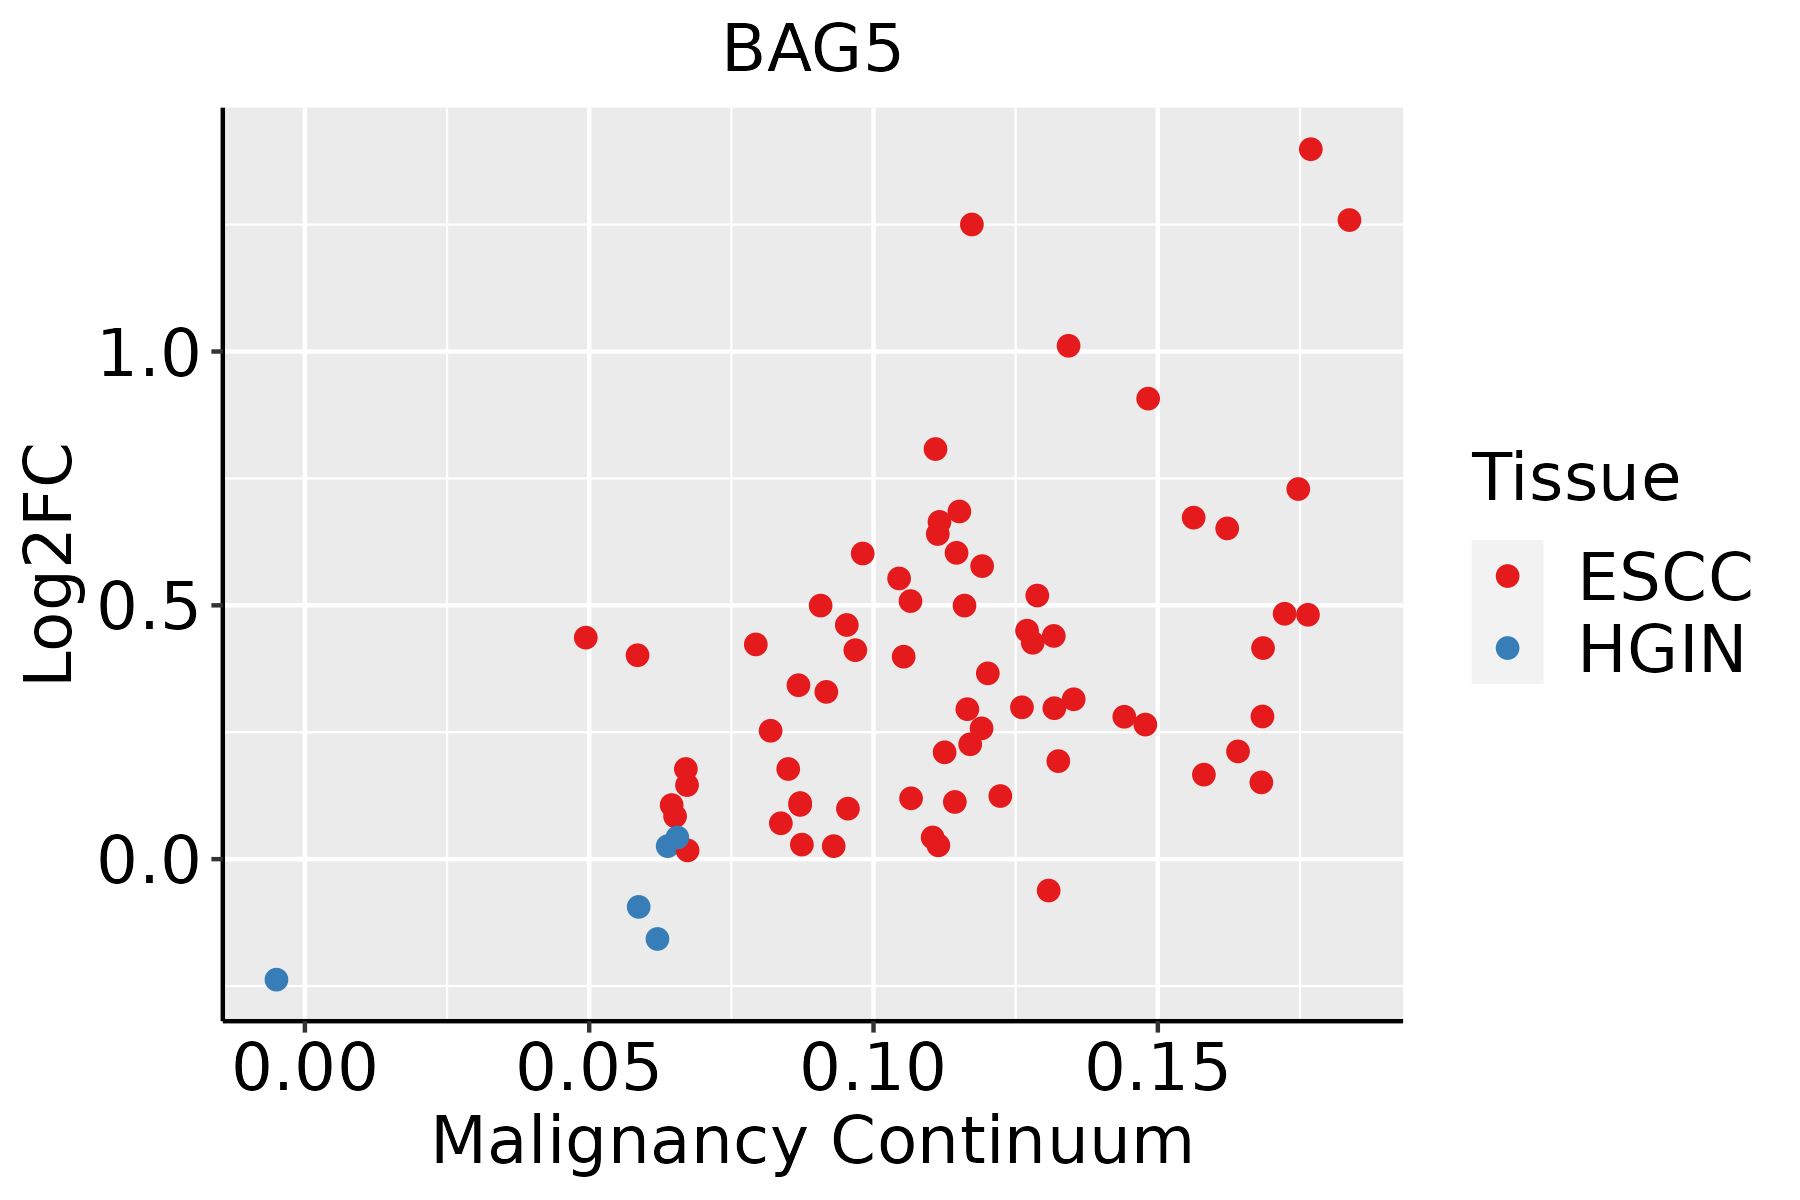
ESCC: Esophageal squamous cell carcinoma
HGIN: High-grade intraepithelial neoplasias
LGIN: Low-grade intraepithelial neoplasias
LiverThe image shows the transcriptomic changes along malignancy continuum.log2FC in expression of this searched gene in stem-like cells from each diseased tissue sample relative to stem-like cells in normal samples in each tissue plotted against the malignancy continuum. Samples are colored based on if they are from different disease stage.
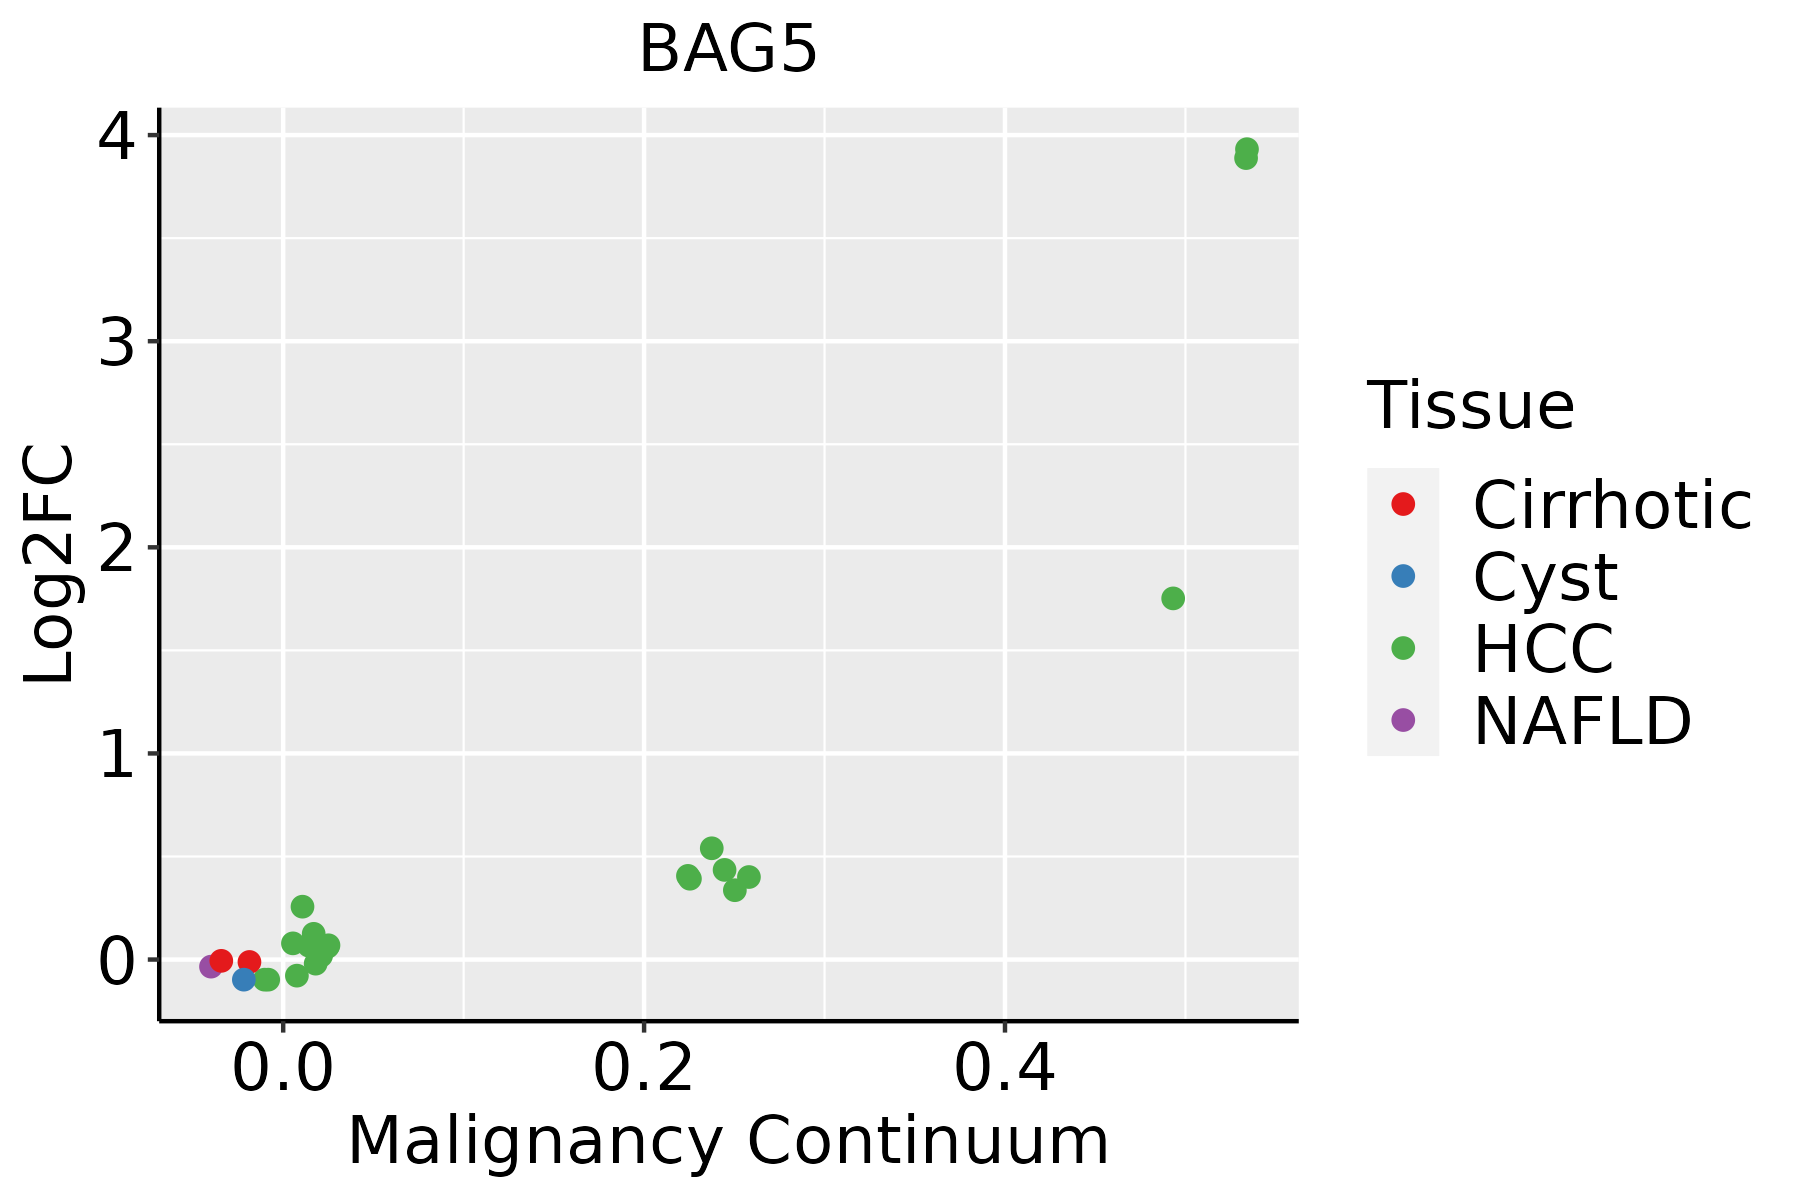
HCC: Hepatocellular carcinoma
NAFLD: Non-alcoholic fatty liver disease
Oral CavityThe image shows the transcriptomic changes along malignancy continuum.log2FC in expression of this searched gene in stem-like cells from each diseased tissue sample relative to stem-like cells in normal samples in each tissue plotted against the malignancy continuum. Samples are colored based on if they are from different disease stage.
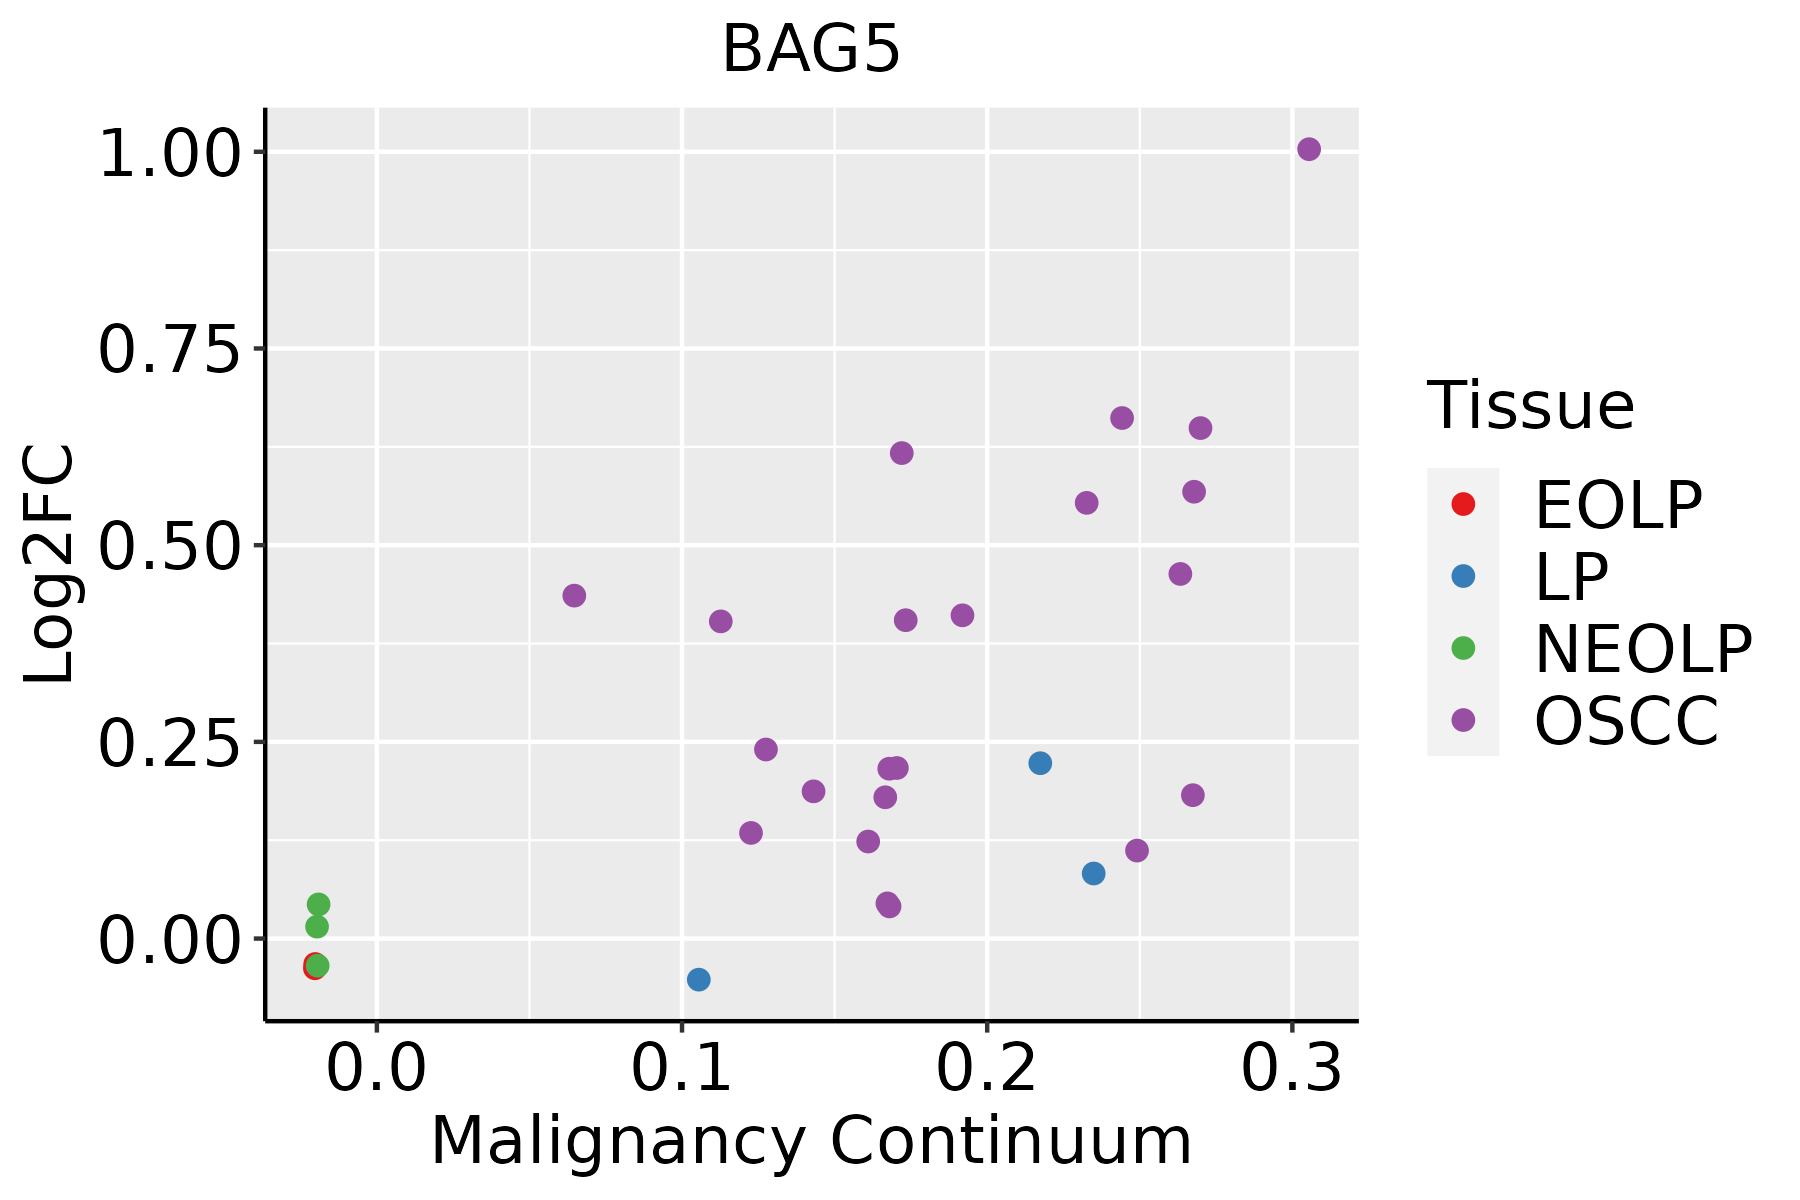
EOLP: Erosive Oral lichen planus
LP: leukoplakia
NEOLP: Non-erosive oral lichen planus
OSCC: Oral squamous cell carcinoma
SkinThe image shows the transcriptomic changes along malignancy continuum.log2FC in expression of this searched gene in stem-like cells from each diseased tissue sample relative to stem-like cells in normal samples in each tissue plotted against the malignancy continuum. Samples are colored based on if they are from different disease stage.
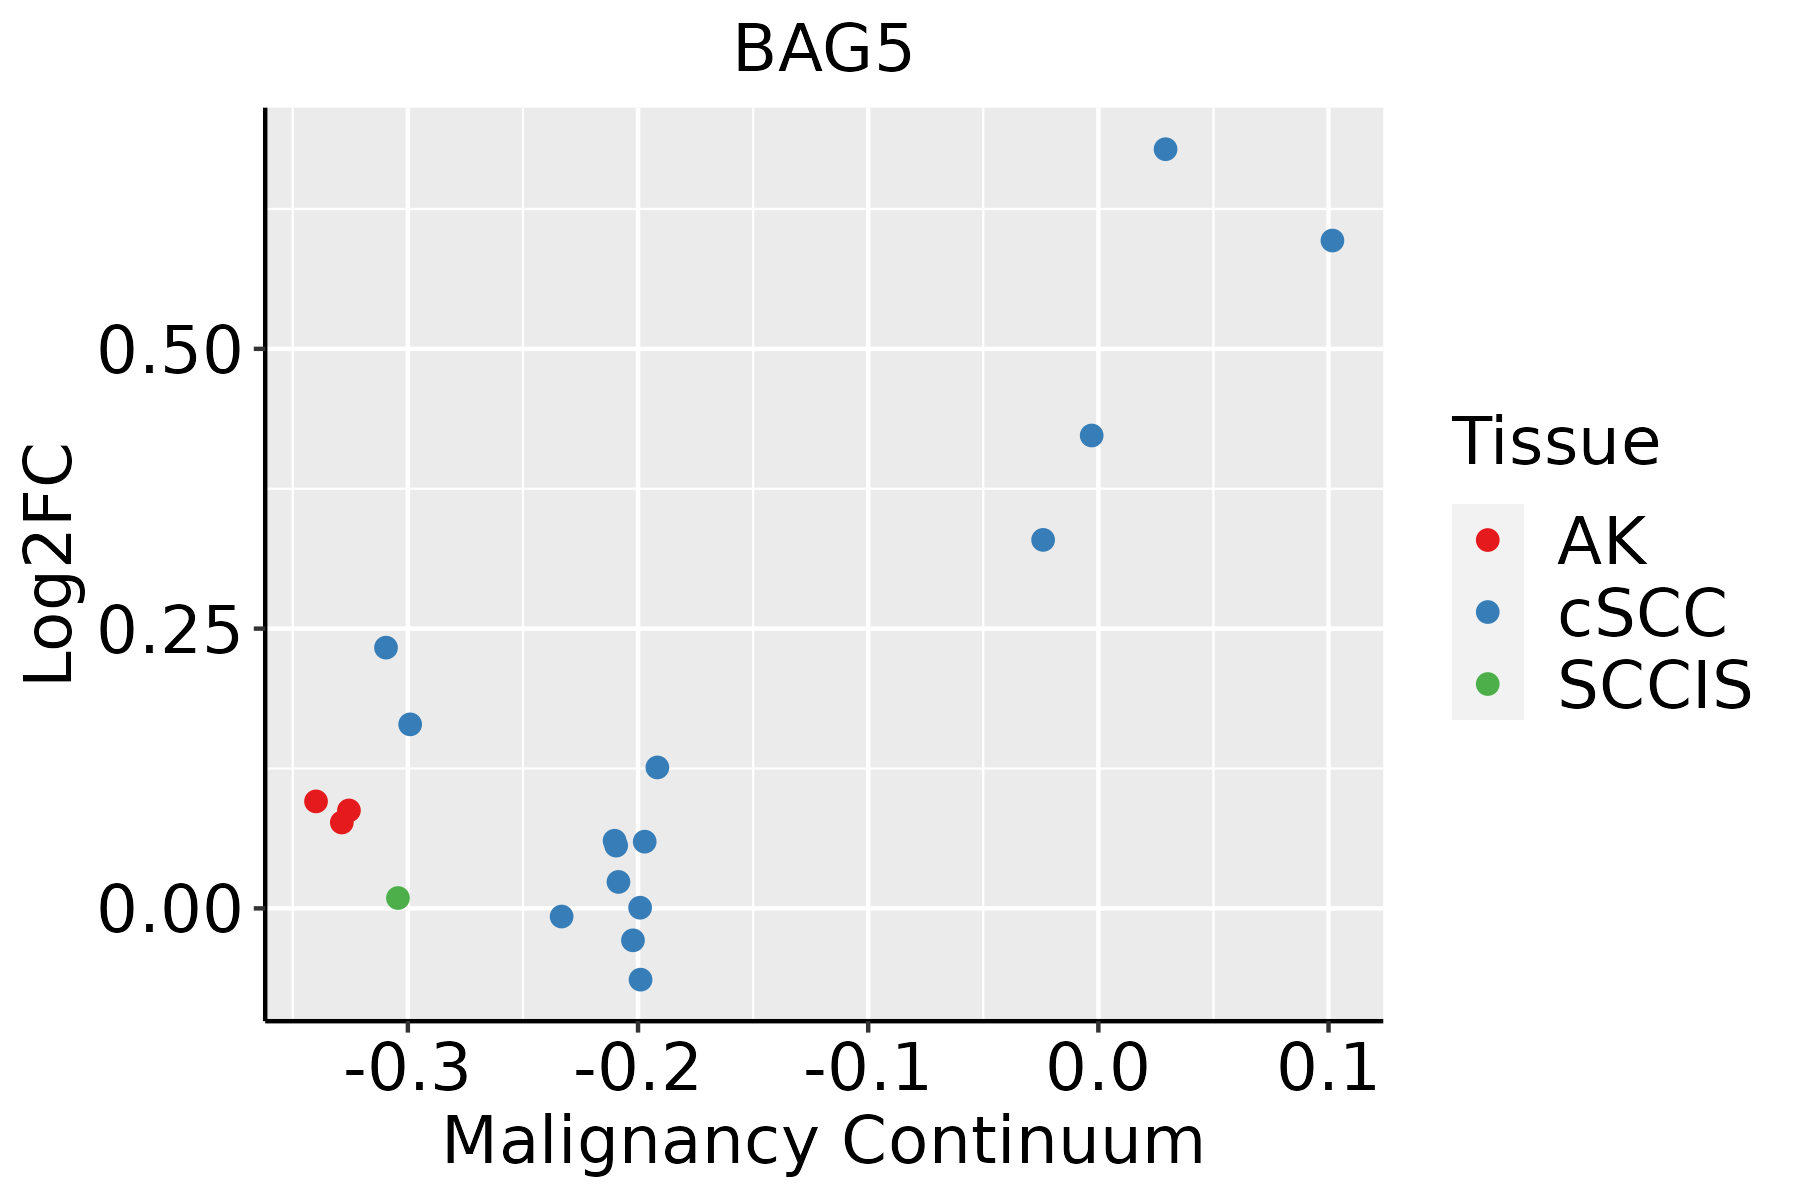
AK: Actinic keratosis
cSCC: Cutaneous squamous cell carcinoma
SCCIS:squamous cell carcinoma in situ
ThyroidThe image shows the transcriptomic changes along malignancy continuum.log2FC in expression of this searched gene in stem-like cells from each diseased tissue sample relative to stem-like cells in normal samples in each tissue plotted against the malignancy continuum. Samples are colored based on if they are from different disease stage.ATC: Anaplastic thyroid cancer
HT: Hashimoto's thyroiditis
PTC: Papillary thyroid cancer
∗log2FC in expression of this searched gene in stem-like cells from each diseased tissue sample relative to stem-like cells in normal samples in each tissue plotted against the malignancy continuum. Samples are colored based on if they are from different disease stage.

Top

Malignant transformation related pathway analysis

check buttonFind out the enriched GO biological processes and KEGG pathways involved in transition from healthy to precancer to cancer
check button Figure of enriched GO biological processes.
TissueDisease StageEnriched GO biological Processes
ColorectumADGO analysis - Figure of enriched GO biological processes: Top 15 enriched GO BP terms are showed in the bar plot of each disease state in each tissue. Each row represents a significant GO biological process which is colored according to the -log10(p.adjust).
ColorectumSERGO analysis - Figure of enriched GO biological processes: Top 15 enriched GO BP terms are showed in the bar plot of each disease state in each tissue. Each row represents a significant GO biological process which is colored according to the -log10(p.adjust).
ColorectumMSSGO analysis - Figure of enriched GO biological processes: Top 15 enriched GO BP terms are showed in the bar plot of each disease state in each tissue. Each row represents a significant GO biological process which is colored according to the -log10(p.adjust).
ColorectumMSI-HGO analysis - Figure of enriched GO biological processes: Top 15 enriched GO BP terms are showed in the bar plot of each disease state in each tissue. Each row represents a significant GO biological process which is colored according to the -log10(p.adjust).
ColorectumFAPGO analysis - Figure of enriched GO biological processes: Top 15 enriched GO BP terms are showed in the bar plot of each disease state in each tissue. Each row represents a significant GO biological process which is colored according to the -log10(p.adjust).
∗Top 15 enriched GO BP terms are showed in the bar plot of each disease state in each tissue. Each row represents a significant GO biological process which is colored according to the -log10(p.adjust).
Page: 1 2 3 4 5 6 7 8 9 

check button Enriched GO biological processes.
GO IDTissueDisease StageDescriptionGene RatioBg Ratiopvaluep.adjustCount
GO:190332112LiverCirrhoticnegative regulation of protein modification by small protein conjugation or removal40/463495/187231.50e-041.44e-0340
GO:19032017LiverCirrhoticregulation of oxidative stress-induced cell death33/463474/187231.51e-041.45e-0333
GO:005134812LiverCirrhoticnegative regulation of transferase activity93/4634268/187231.55e-041.47e-0393
GO:19021767LiverCirrhoticnegative regulation of oxidative stress-induced intrinsic apoptotic signaling pathway13/463420/187231.63e-041.54e-0313
GO:00420267LiverCirrhoticprotein refolding14/463423/187232.50e-042.26e-0314
GO:200005912LiverCirrhoticnegative regulation of ubiquitin-dependent protein catabolic process23/463448/187234.19e-043.45e-0323
GO:00708416LiverCirrhoticinclusion body assembly14/463424/187234.64e-043.75e-0314
GO:00900835LiverCirrhoticregulation of inclusion body assembly11/463417/187235.66e-044.44e-0311
GO:19004077LiverCirrhoticregulation of cellular response to oxidative stress36/463489/187237.79e-045.73e-0336
GO:190336311LiverCirrhoticnegative regulation of cellular protein catabolic process31/463475/187231.15e-037.84e-0331
GO:1903332LiverCirrhoticregulation of protein folding8/463412/187232.59e-031.53e-028
GO:190305111LiverCirrhoticnegative regulation of proteolysis involved in cellular protein catabolic process26/463464/187233.69e-032.03e-0226
GO:005143812LiverCirrhoticregulation of ubiquitin-protein transferase activity22/463453/187235.36e-032.73e-0222
GO:19032027LiverCirrhoticnegative regulation of oxidative stress-induced cell death22/463453/187235.36e-032.73e-0222
GO:19028827LiverCirrhoticregulation of response to oxidative stress36/463498/187235.44e-032.77e-0236
GO:003243511LiverCirrhoticnegative regulation of proteasomal ubiquitin-dependent protein catabolic process16/463435/187235.53e-032.80e-0216
GO:005144412LiverCirrhoticnegative regulation of ubiquitin-protein transferase activity10/463419/187238.23e-033.83e-0210
GO:001049822LiverHCCproteasomal protein catabolic process351/7958490/187236.92e-401.46e-36351
GO:004316122LiverHCCproteasome-mediated ubiquitin-dependent protein catabolic process299/7958412/187237.82e-368.27e-33299
GO:004217622LiverHCCregulation of protein catabolic process267/7958391/187232.45e-257.38e-23267
Page: 1 2 3 4 5 6 7 8 9 10 11 12 13 14 15 16 17 

check button Enriched KEGG pathways.
Pathway IDTissueDisease StageDescriptionGene RatioBg Ratiopvaluep.adjustqvalueCount
Page: 1 

Top

Cell-cell communication analysis

check buttonIdentification of potential cell-cell interactions between two cell types and their ligand-receptor pairs for different disease states
LigandReceptorLRpairPathwayTissueDisease Stage
Page: 1 

Top

Single-cell gene regulatory network inference analysis

check buttonFind out the significant the regulons (TFs) and the target genes of each regulon across cell types for different disease states
TFCell TypeTissueDisease StageTarget GeneRSSRegulon Activity
∗The dot plots of a searched regulon are shown for all cell subpopulations in each disease state of each tissue based on the regulon specific score inferred using pySCENIC and by calculating the average expression.
Page: 1 

Top

Somatic mutation of malignant transformation related genes

check buttonAnnotation of somatic variants for genes involved in malignant transformation
Hugo SymbolVariant ClassVariant ClassificationdbSNP RSHGVScHGVSpHGVSp ShortSWISSPROTBIOTYPESIFTPolyPhenTumor Sample BarcodeTissueHistologySexAgeStageTherapy TypesDrugsOutcome
BAG5SNVMissense_Mutationc.349N>Cp.Glu117Glnp.E117QQ9UL15protein_codingtolerated(0.48)probably_damaging(0.951)TCGA-AC-A23H-01Breastbreast invasive carcinomaFemale>=65I/IIUnknownUnknownPD
BAG5SNVMissense_Mutationnovelc.574N>Tp.His192Tyrp.H192YQ9UL15protein_codingdeleterious_low_confidence(0)benign(0.003)TCGA-PE-A5DE-01Breastbreast invasive carcinomaFemale<65I/IIChemotherapytaxotereCR
BAG5SNVMissense_Mutationnovelc.977N>Tp.Arg326Ilep.R326IQ9UL15protein_codingdeleterious_low_confidence(0)possibly_damaging(0.667)TCGA-2W-A8YY-01Cervixcervical & endocervical cancerFemale<65I/IIChemotherapycisplatinCR
BAG5SNVMissense_Mutationc.981N>Ap.Met327Ilep.M327IQ9UL15protein_codingtolerated_low_confidence(0.12)benign(0.083)TCGA-JW-A5VL-01Cervixcervical & endocervical cancerFemale<65I/IIUnknownUnknownSD
BAG5SNVMissense_Mutationnovelc.1057N>Ap.Gly353Serp.G353SQ9UL15protein_codingtolerated(0.19)benign(0.009)TCGA-JX-A3Q0-01Cervixcervical & endocervical cancerFemale<65III/IVUnknownUnknownSD
BAG5SNVMissense_Mutationc.981N>Cp.Met327Ilep.M327IQ9UL15protein_codingtolerated_low_confidence(0.12)benign(0.083)TCGA-Q1-A73O-01Cervixcervical & endocervical cancerFemale<65I/IIChemotherapycisplatinCR
BAG5SNVMissense_Mutationc.81N>Cp.Trp27Cysp.W27CQ9UL15protein_codingdeleterious_low_confidence(0)benign(0.023)TCGA-Q1-A73O-01Cervixcervical & endocervical cancerFemale<65I/IIChemotherapycisplatinCR
BAG5SNVMissense_Mutationnovelc.1431N>Gp.Ser477Argp.S477RQ9UL15protein_codingtolerated(0.07)possibly_damaging(0.734)TCGA-VS-A94Z-01Cervixcervical & endocervical cancerFemale<65I/IIChemotherapycisplatinCR
BAG5insertionFrame_Shift_Insnovelc.260_261insCTp.Thr88Terp.T88*Q9UL15protein_codingTCGA-LP-A7HU-01Cervixcervical & endocervical cancerFemale<65I/IIUnknownUnknownSD
BAG5SNVMissense_Mutationc.1438N>Ap.Asp480Asnp.D480NQ9UL15protein_codingdeleterious(0)probably_damaging(0.998)TCGA-AG-3892-01Colorectumrectum adenocarcinomaFemale<65I/IIUnknownUnknownSD
Page: 1 2 3 4 5 

Top

Related drugs of malignant transformation related genes

check buttonIdentification of chemicals and drugs interact with genes involved in malignant transfromation
(DGIdb 4.0)
Entrez IDSymbolCategoryInteraction TypesDrug Claim NameDrug NamePMIDs
Page: 1