
|
|||||
|
 | |
| |
| |
| |
| |
| |
|
Gene: ARHGAP18 |
Gene summary for ARHGAP18 |
| Gene information | Species | Human | Gene symbol | ARHGAP18 | Gene ID | 93663 |
| Gene name | Rho GTPase activating protein 18 | |
| Gene Alias | MacGAP | |
| Cytomap | 6q22.33 | |
| Gene Type | protein-coding | GO ID | GO:0000902 | UniProtAcc | Q8N392 |
Top |
Malignant transformation analysis |
| Identification of the aberrant gene expression in precancerous and cancerous lesions by comparing the gene expression of stem-like cells in diseased tissues with normal stem cells |
| Entrez ID | Symbol | Replicates | Species | Organ | Tissue | Adj P-value | Log2FC | Malignancy |
| 93663 | ARHGAP18 | CCI_2 | Human | Cervix | CC | 1.13e-02 | -5.70e-01 | 0.5249 |
| 93663 | ARHGAP18 | CCII_1 | Human | Cervix | CC | 1.59e-07 | -5.69e-01 | 0.3249 |
| 93663 | ARHGAP18 | Tumor | Human | Cervix | CC | 8.74e-23 | -5.69e-01 | 0.1241 |
| 93663 | ARHGAP18 | sample1 | Human | Cervix | CC | 4.22e-05 | -5.54e-01 | 0.0959 |
| 93663 | ARHGAP18 | sample3 | Human | Cervix | CC | 8.80e-23 | -5.60e-01 | 0.1387 |
| 93663 | ARHGAP18 | H2 | Human | Cervix | HSIL_HPV | 9.89e-13 | -5.01e-01 | 0.0632 |
| 93663 | ARHGAP18 | L1 | Human | Cervix | CC | 1.34e-06 | -5.37e-01 | 0.0802 |
| 93663 | ARHGAP18 | T1 | Human | Cervix | CC | 6.68e-08 | -4.86e-01 | 0.0918 |
| 93663 | ARHGAP18 | T3 | Human | Cervix | CC | 3.01e-21 | -5.77e-01 | 0.1389 |
| 93663 | ARHGAP18 | LZE4T | Human | Esophagus | ESCC | 3.37e-04 | 1.25e-01 | 0.0811 |
| 93663 | ARHGAP18 | LZE5T | Human | Esophagus | ESCC | 3.25e-04 | 5.37e-01 | 0.0514 |
| 93663 | ARHGAP18 | LZE24T | Human | Esophagus | ESCC | 4.42e-05 | 1.44e-01 | 0.0596 |
| 93663 | ARHGAP18 | LZE6T | Human | Esophagus | ESCC | 1.21e-02 | 2.03e-01 | 0.0845 |
| 93663 | ARHGAP18 | P2T-E | Human | Esophagus | ESCC | 8.24e-09 | 2.22e-01 | 0.1177 |
| 93663 | ARHGAP18 | P4T-E | Human | Esophagus | ESCC | 1.22e-03 | 7.49e-02 | 0.1323 |
| 93663 | ARHGAP18 | P5T-E | Human | Esophagus | ESCC | 2.05e-03 | 5.25e-03 | 0.1327 |
| 93663 | ARHGAP18 | P8T-E | Human | Esophagus | ESCC | 2.20e-37 | 8.67e-01 | 0.0889 |
| 93663 | ARHGAP18 | P10T-E | Human | Esophagus | ESCC | 1.90e-11 | 1.67e-01 | 0.116 |
| 93663 | ARHGAP18 | P12T-E | Human | Esophagus | ESCC | 3.68e-05 | 1.28e-01 | 0.1122 |
| 93663 | ARHGAP18 | P15T-E | Human | Esophagus | ESCC | 1.65e-05 | 1.39e-01 | 0.1149 |
| Page: 1 2 3 4 |
| Tissue | Expression Dynamics | Abbreviation |
| Cervix | 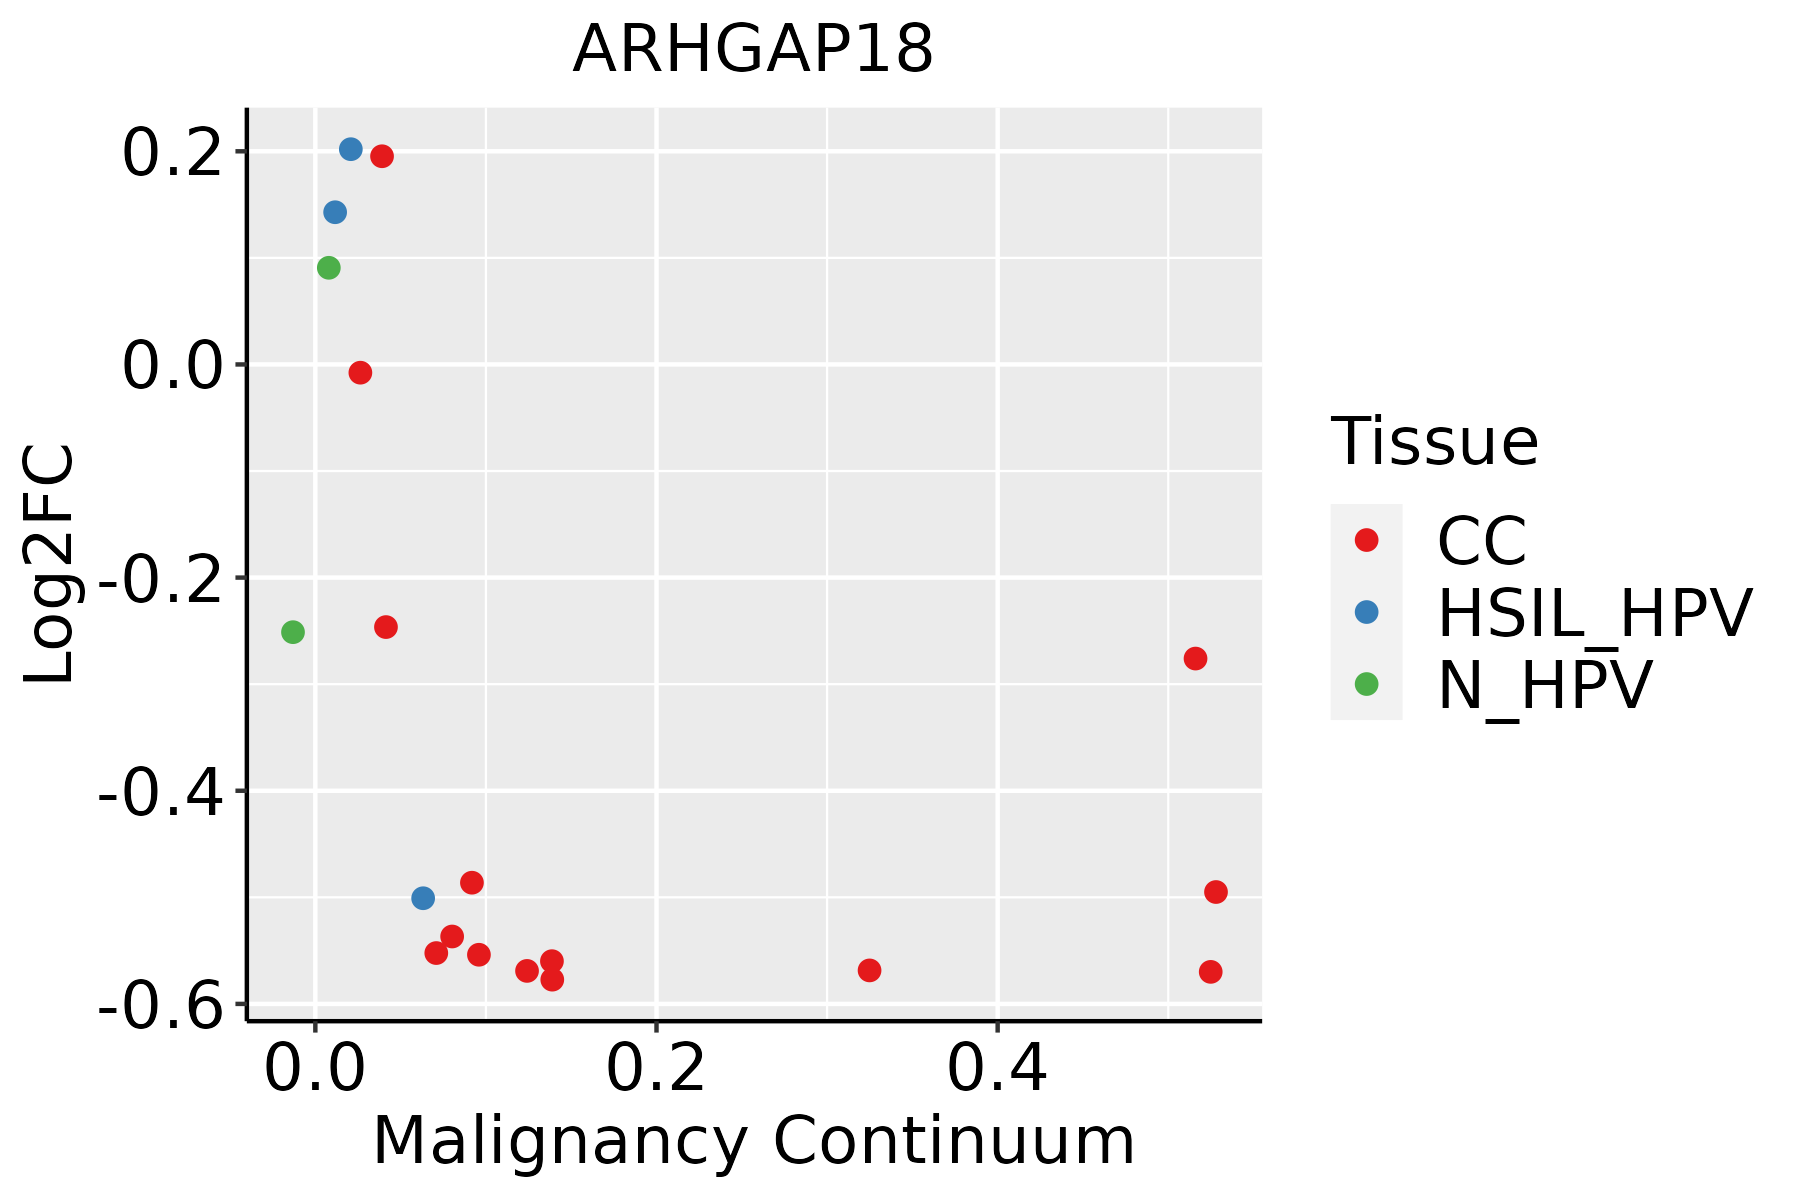 | CC: Cervix cancer |
| HSIL_HPV: HPV-infected high-grade squamous intraepithelial lesions | ||
| N_HPV: HPV-infected normal cervix | ||
| Esophagus |  | ESCC: Esophageal squamous cell carcinoma |
| HGIN: High-grade intraepithelial neoplasias | ||
| LGIN: Low-grade intraepithelial neoplasias | ||
| Oral Cavity | 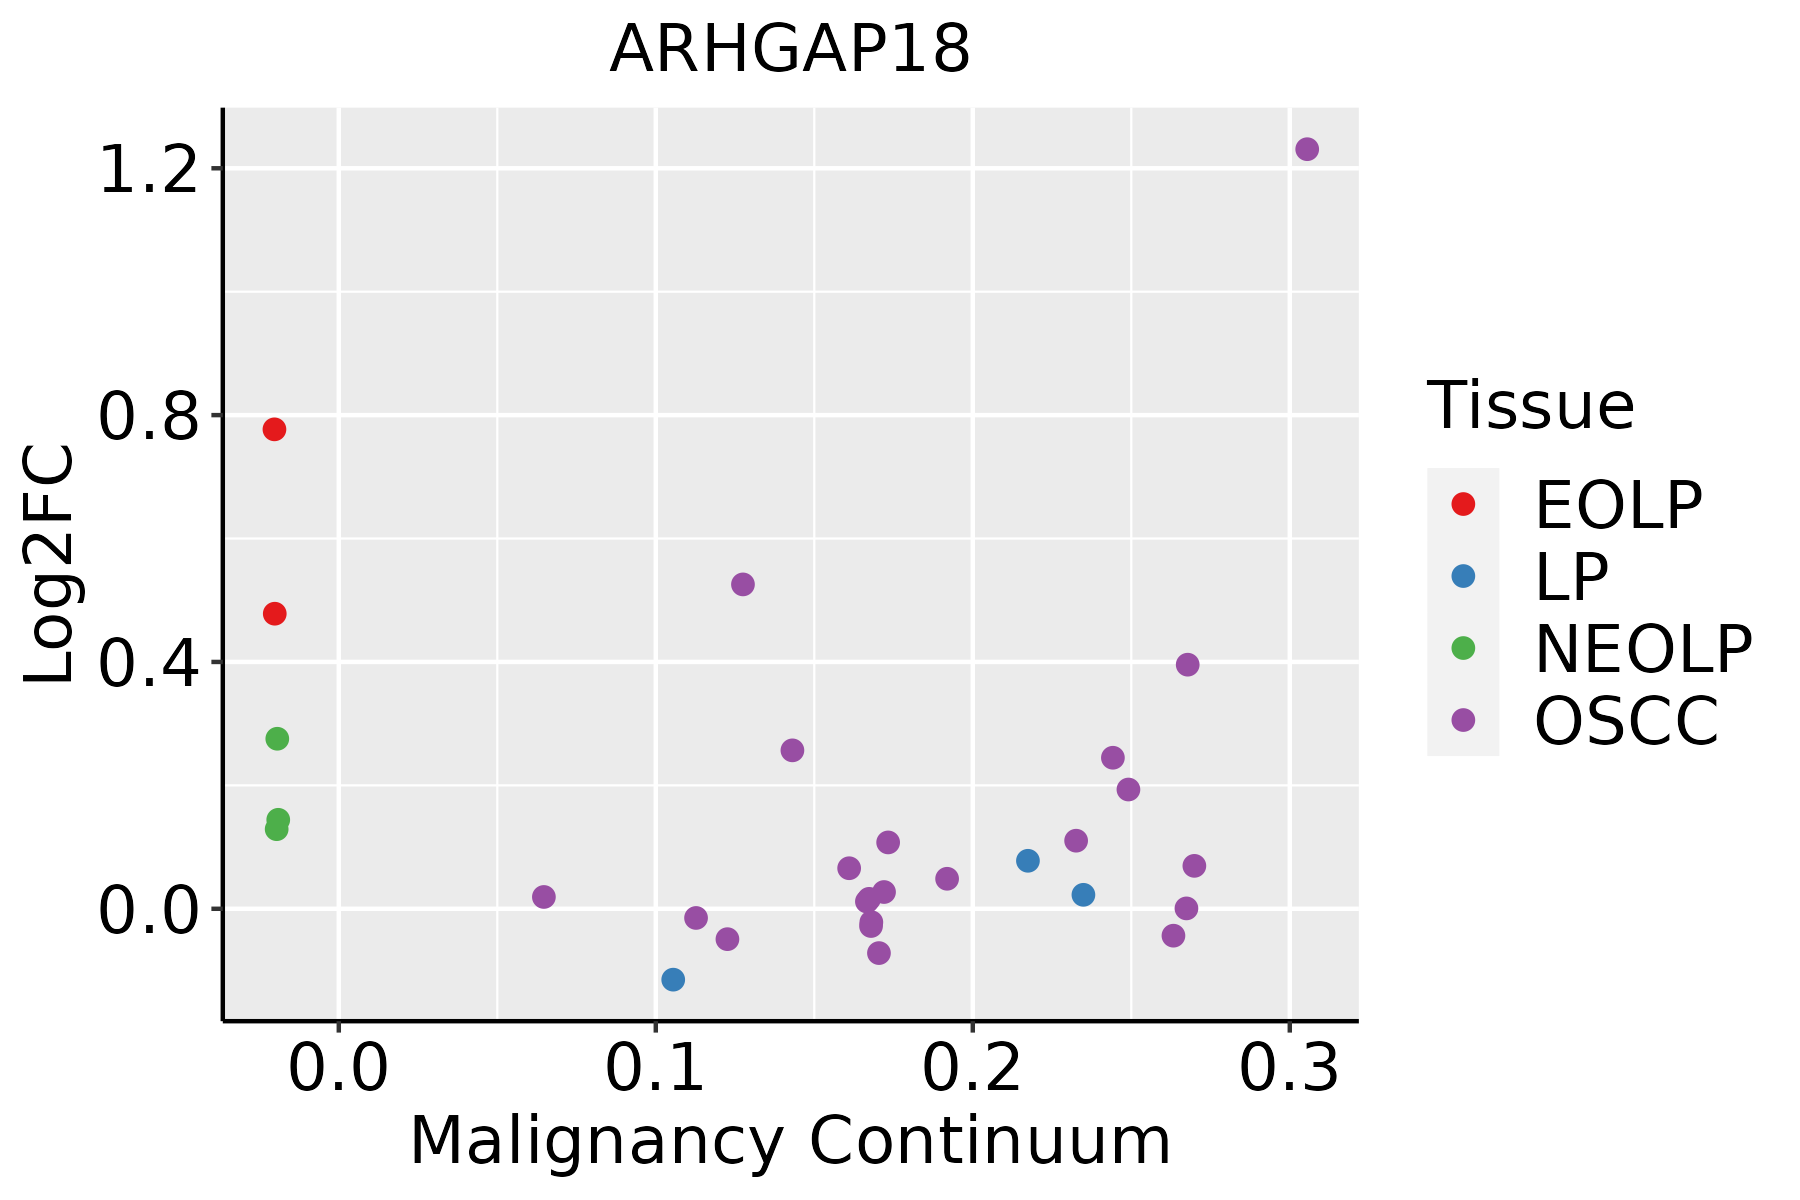 | EOLP: Erosive Oral lichen planus |
| LP: leukoplakia | ||
| NEOLP: Non-erosive oral lichen planus | ||
| OSCC: Oral squamous cell carcinoma | ||
| Thyroid | 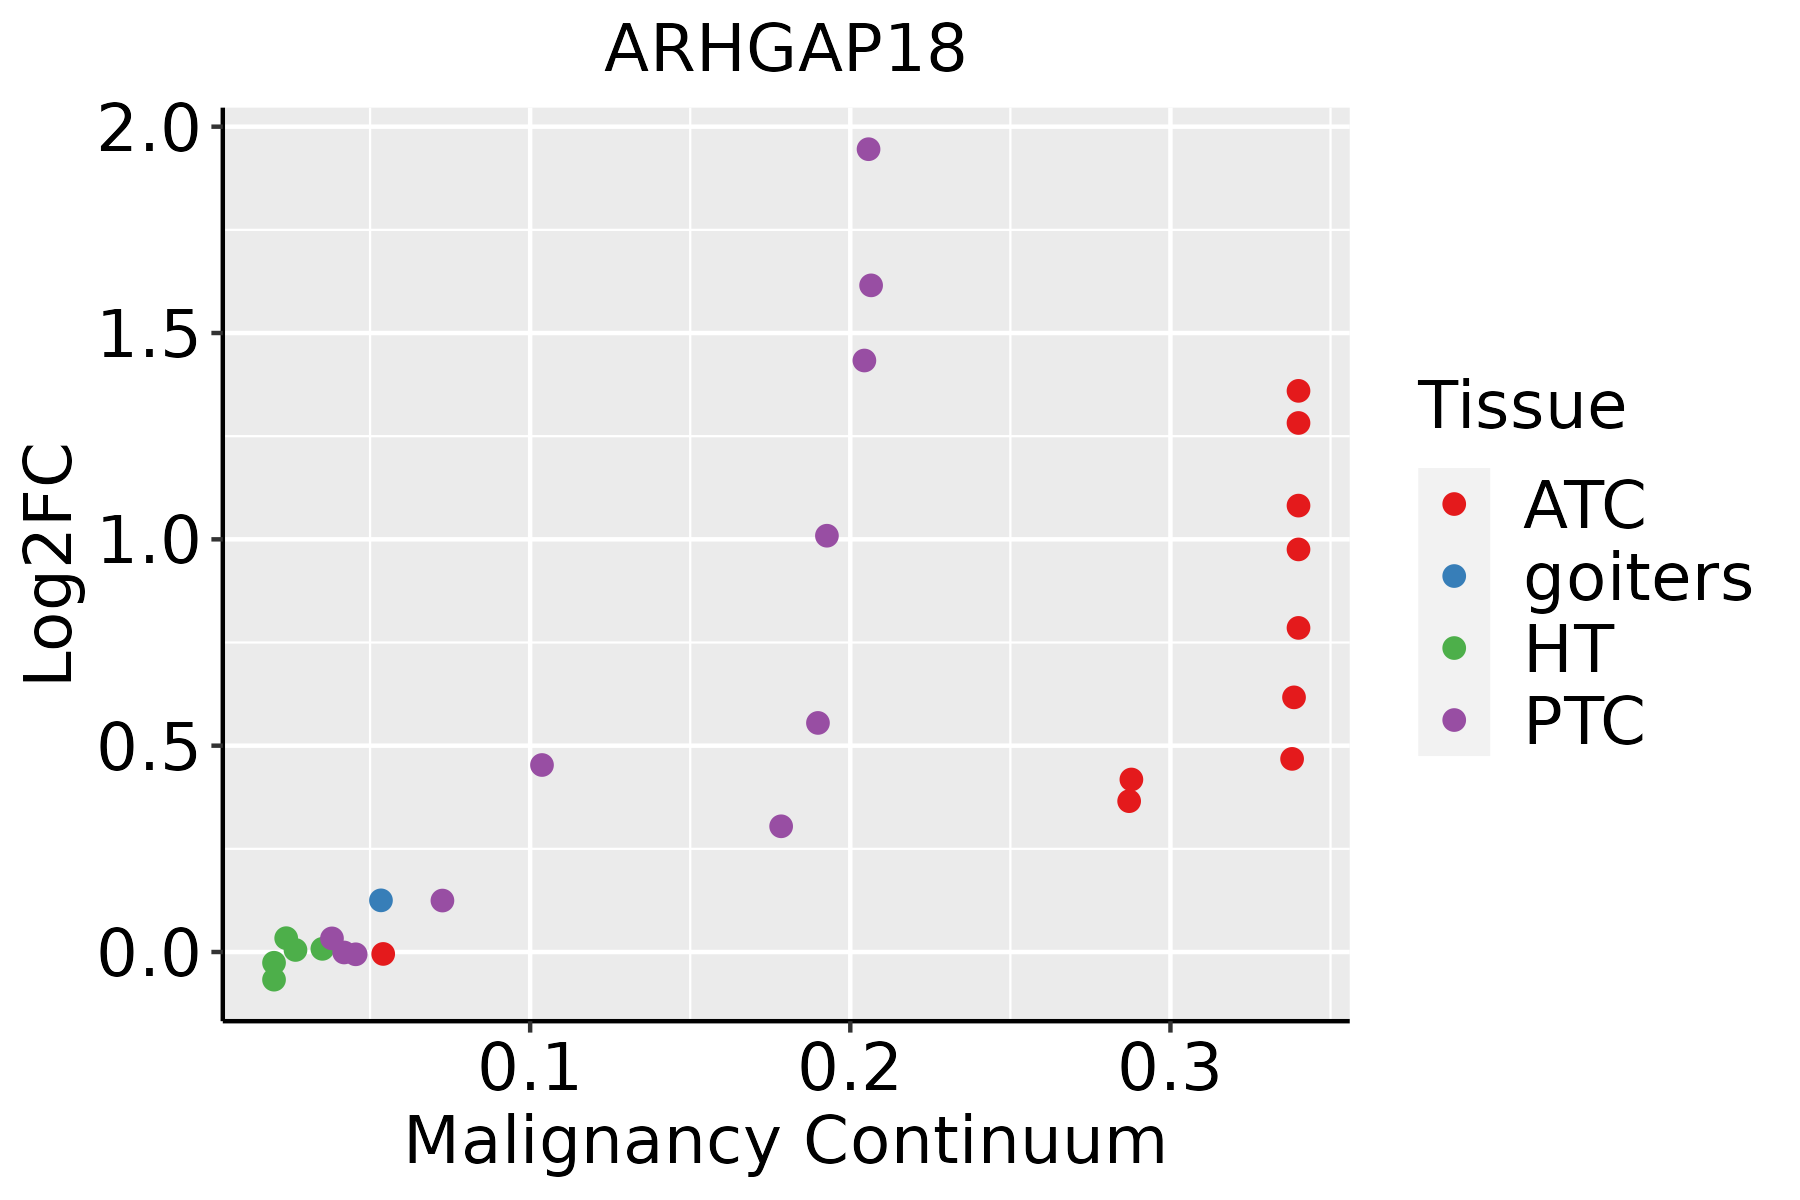 | ATC: Anaplastic thyroid cancer |
| HT: Hashimoto's thyroiditis | ||
| PTC: Papillary thyroid cancer |
| ∗log2FC in expression of this searched gene in stem-like cells from each diseased tissue sample relative to stem-like cells in normal samples in each tissue plotted against the malignancy continuum. Samples are colored based on if they are from different disease stage. |
Top |
Malignant transformation related pathway analysis |
| Find out the enriched GO biological processes and KEGG pathways involved in transition from healthy to precancer to cancer |
| Tissue | Disease Stage | Enriched GO biological Processes |
| Colorectum | AD |  |
| Colorectum | SER |  |
| Colorectum | MSS |  |
| Colorectum | MSI-H |  |
| Colorectum | FAP |  |
| ∗Top 15 enriched GO BP terms are showed in the bar plot of each disease state in each tissue. Each row represents a significant GO biological process which is colored according to the -log10(p.adjust). |
| Page: 1 2 3 4 5 6 7 8 9 |
| GO ID | Tissue | Disease Stage | Description | Gene Ratio | Bg Ratio | pvalue | p.adjust | Count |
| GO:000836024 | Oral cavity | EOLP | regulation of cell shape | 37/2218 | 154/18723 | 1.80e-05 | 2.90e-04 | 37 |
| GO:00510569 | Oral cavity | EOLP | regulation of small GTPase mediated signal transduction | 51/2218 | 302/18723 | 5.67e-03 | 2.92e-02 | 51 |
| GO:190290334 | Oral cavity | NEOLP | regulation of supramolecular fiber organization | 88/2005 | 383/18723 | 2.44e-12 | 4.83e-10 | 88 |
| GO:004325432 | Oral cavity | NEOLP | regulation of protein-containing complex assembly | 95/2005 | 428/18723 | 2.76e-12 | 5.29e-10 | 95 |
| GO:000701534 | Oral cavity | NEOLP | actin filament organization | 94/2005 | 442/18723 | 4.49e-11 | 5.80e-09 | 94 |
| GO:003297033 | Oral cavity | NEOLP | regulation of actin filament-based process | 85/2005 | 397/18723 | 2.70e-10 | 2.51e-08 | 85 |
| GO:003295633 | Oral cavity | NEOLP | regulation of actin cytoskeleton organization | 77/2005 | 358/18723 | 1.51e-09 | 1.02e-07 | 77 |
| GO:003227133 | Oral cavity | NEOLP | regulation of protein polymerization | 57/2005 | 233/18723 | 1.54e-09 | 1.03e-07 | 57 |
| GO:002260433 | Oral cavity | NEOLP | regulation of cell morphogenesis | 69/2005 | 309/18723 | 2.07e-09 | 1.29e-07 | 69 |
| GO:005125833 | Oral cavity | NEOLP | protein polymerization | 67/2005 | 297/18723 | 2.27e-09 | 1.40e-07 | 67 |
| GO:000836033 | Oral cavity | NEOLP | regulation of cell shape | 41/2005 | 154/18723 | 2.35e-08 | 1.03e-06 | 41 |
| GO:011005333 | Oral cavity | NEOLP | regulation of actin filament organization | 60/2005 | 278/18723 | 8.37e-08 | 3.17e-06 | 60 |
| GO:003253532 | Oral cavity | NEOLP | regulation of cellular component size | 73/2005 | 383/18723 | 6.70e-07 | 1.93e-05 | 73 |
| GO:000815431 | Oral cavity | NEOLP | actin polymerization or depolymerization | 47/2005 | 218/18723 | 2.11e-06 | 4.91e-05 | 47 |
| GO:000806432 | Oral cavity | NEOLP | regulation of actin polymerization or depolymerization | 41/2005 | 188/18723 | 6.83e-06 | 1.36e-04 | 41 |
| GO:003083232 | Oral cavity | NEOLP | regulation of actin filament length | 41/2005 | 189/18723 | 7.83e-06 | 1.54e-04 | 41 |
| GO:003004132 | Oral cavity | NEOLP | actin filament polymerization | 41/2005 | 191/18723 | 1.03e-05 | 1.94e-04 | 41 |
| GO:003083332 | Oral cavity | NEOLP | regulation of actin filament polymerization | 38/2005 | 172/18723 | 1.07e-05 | 1.98e-04 | 38 |
| GO:005105614 | Oral cavity | NEOLP | regulation of small GTPase mediated signal transduction | 49/2005 | 302/18723 | 2.04e-03 | 1.36e-02 | 49 |
| GO:1902903113 | Thyroid | PTC | regulation of supramolecular fiber organization | 202/5968 | 383/18723 | 1.16e-17 | 1.15e-15 | 202 |
| Page: 1 2 3 4 5 6 7 |
| Pathway ID | Tissue | Disease Stage | Description | Gene Ratio | Bg Ratio | pvalue | p.adjust | qvalue | Count |
| Page: 1 |
Top |
Cell-cell communication analysis |
| Identification of potential cell-cell interactions between two cell types and their ligand-receptor pairs for different disease states |
| Ligand | Receptor | LRpair | Pathway | Tissue | Disease Stage |
| Page: 1 |
Top |
Single-cell gene regulatory network inference analysis |
| Find out the significant the regulons (TFs) and the target genes of each regulon across cell types for different disease states |
| TF | Cell Type | Tissue | Disease Stage | Target Gene | RSS | Regulon Activity |
| ∗The dot plots of a searched regulon are shown for all cell subpopulations in each disease state of each tissue based on the regulon specific score inferred using pySCENIC and by calculating the average expression. |
| Page: 1 |
Top |
Somatic mutation of malignant transformation related genes |
| Annotation of somatic variants for genes involved in malignant transformation |
| Hugo Symbol | Variant Class | Variant Classification | dbSNP RS | HGVSc | HGVSp | HGVSp Short | SWISSPROT | BIOTYPE | SIFT | PolyPhen | Tumor Sample Barcode | Tissue | Histology | Sex | Age | Stage | Therapy Types | Drugs | Outcome |
| ARHGAP18 | SNV | Missense_Mutation | novel | c.1889G>C | p.Gly630Ala | p.G630A | Q8N392 | protein_coding | deleterious(0.01) | probably_damaging(0.936) | TCGA-3C-AALI-01 | Breast | breast invasive carcinoma | Female | <65 | I/II | Unspecific | Poly E | Complete Response |
| ARHGAP18 | SNV | Missense_Mutation | rs775517266 | c.1027N>T | p.Pro343Ser | p.P343S | Q8N392 | protein_coding | deleterious(0.03) | probably_damaging(0.989) | TCGA-A2-A0EW-01 | Breast | breast invasive carcinoma | Female | <65 | III/IV | Chemotherapy | adriamycin | PD |
| ARHGAP18 | SNV | Missense_Mutation | c.1342N>C | p.Asp448His | p.D448H | Q8N392 | protein_coding | deleterious(0) | benign(0.158) | TCGA-A2-A25E-01 | Breast | breast invasive carcinoma | Female | <65 | III/IV | Chemotherapy | cytoxan | PD | |
| ARHGAP18 | SNV | Missense_Mutation | c.556C>G | p.Pro186Ala | p.P186A | Q8N392 | protein_coding | tolerated(0.16) | benign(0.007) | TCGA-AC-A23H-01 | Breast | breast invasive carcinoma | Female | >=65 | I/II | Unknown | Unknown | PD | |
| ARHGAP18 | SNV | Missense_Mutation | rs370593148 | c.769G>A | p.Asp257Asn | p.D257N | Q8N392 | protein_coding | tolerated(0.17) | benign(0.001) | TCGA-AN-A046-01 | Breast | breast invasive carcinoma | Female | >=65 | I/II | Unknown | Unknown | SD |
| ARHGAP18 | SNV | Missense_Mutation | c.29N>C | p.Val10Ala | p.V10A | Q8N392 | protein_coding | deleterious(0) | benign(0.138) | TCGA-EW-A1IZ-01 | Breast | breast invasive carcinoma | Female | <65 | III/IV | Chemotherapy | taxotere | SD | |
| ARHGAP18 | SNV | Missense_Mutation | novel | c.997N>C | p.Asp333His | p.D333H | Q8N392 | protein_coding | deleterious(0) | probably_damaging(1) | TCGA-C5-A8XK-01 | Cervix | cervical & endocervical cancer | Female | <65 | I/II | Chemotherapy | cisplatin | SD |
| ARHGAP18 | SNV | Missense_Mutation | c.375G>T | p.Glu125Asp | p.E125D | Q8N392 | protein_coding | tolerated(0.63) | benign(0.003) | TCGA-WL-A834-01 | Cervix | cervical & endocervical cancer | Female | <65 | I/II | Chemotherapy | paclitaxel | SD | |
| ARHGAP18 | SNV | Missense_Mutation | c.1562N>G | p.Leu521Arg | p.L521R | Q8N392 | protein_coding | deleterious(0) | benign(0.196) | TCGA-A6-2672-01 | Colorectum | colon adenocarcinoma | Female | >=65 | III/IV | Unknown | Unknown | SD | |
| ARHGAP18 | SNV | Missense_Mutation | c.1208N>C | p.Leu403Pro | p.L403P | Q8N392 | protein_coding | deleterious(0) | probably_damaging(1) | TCGA-AD-6895-01 | Colorectum | colon adenocarcinoma | Male | >=65 | III/IV | Unknown | Unknown | SD |
| Page: 1 2 3 4 5 6 7 |
Top |
Related drugs of malignant transformation related genes |
| Identification of chemicals and drugs interact with genes involved in malignant transfromation |
| (DGIdb 4.0) |
| Entrez ID | Symbol | Category | Interaction Types | Drug Claim Name | Drug Name | PMIDs |
| Page: 1 |

Copyright 2023-Present -The University of Texas Health Science Center at Houston |