| Tissue | Expression Dynamics | Abbreviation |
| Cervix | 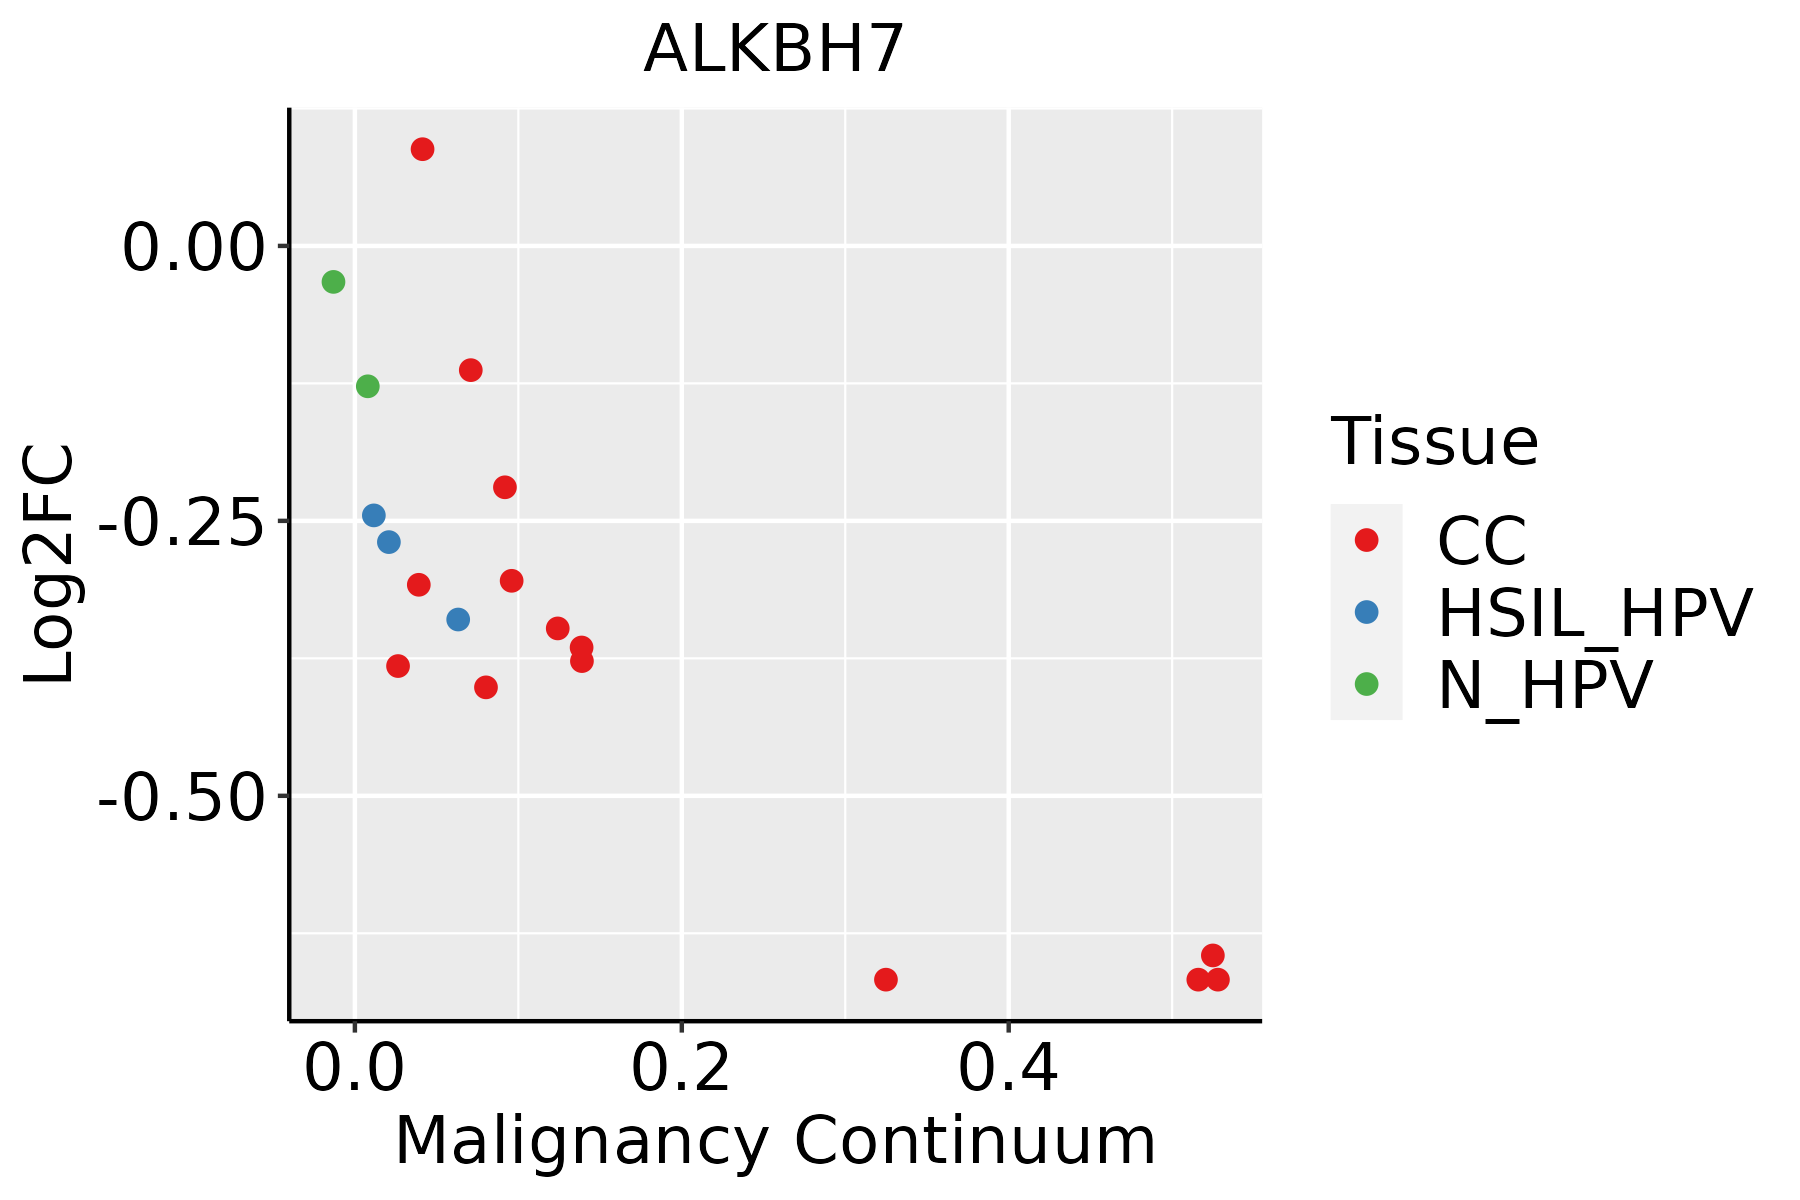 | CC: Cervix cancer |
| HSIL_HPV: HPV-infected high-grade squamous intraepithelial lesions |
| N_HPV: HPV-infected normal cervix |
| Colorectum (GSE201348) |  | FAP: Familial adenomatous polyposis |
| CRC: Colorectal cancer |
| Colorectum (HTA11) |  | AD: Adenomas |
| SER: Sessile serrated lesions |
| MSI-H: Microsatellite-high colorectal cancer |
| MSS: Microsatellite stable colorectal cancer |
| Endometrium |  | AEH: Atypical endometrial hyperplasia |
| EEC: Endometrioid Cancer |
| Esophagus | 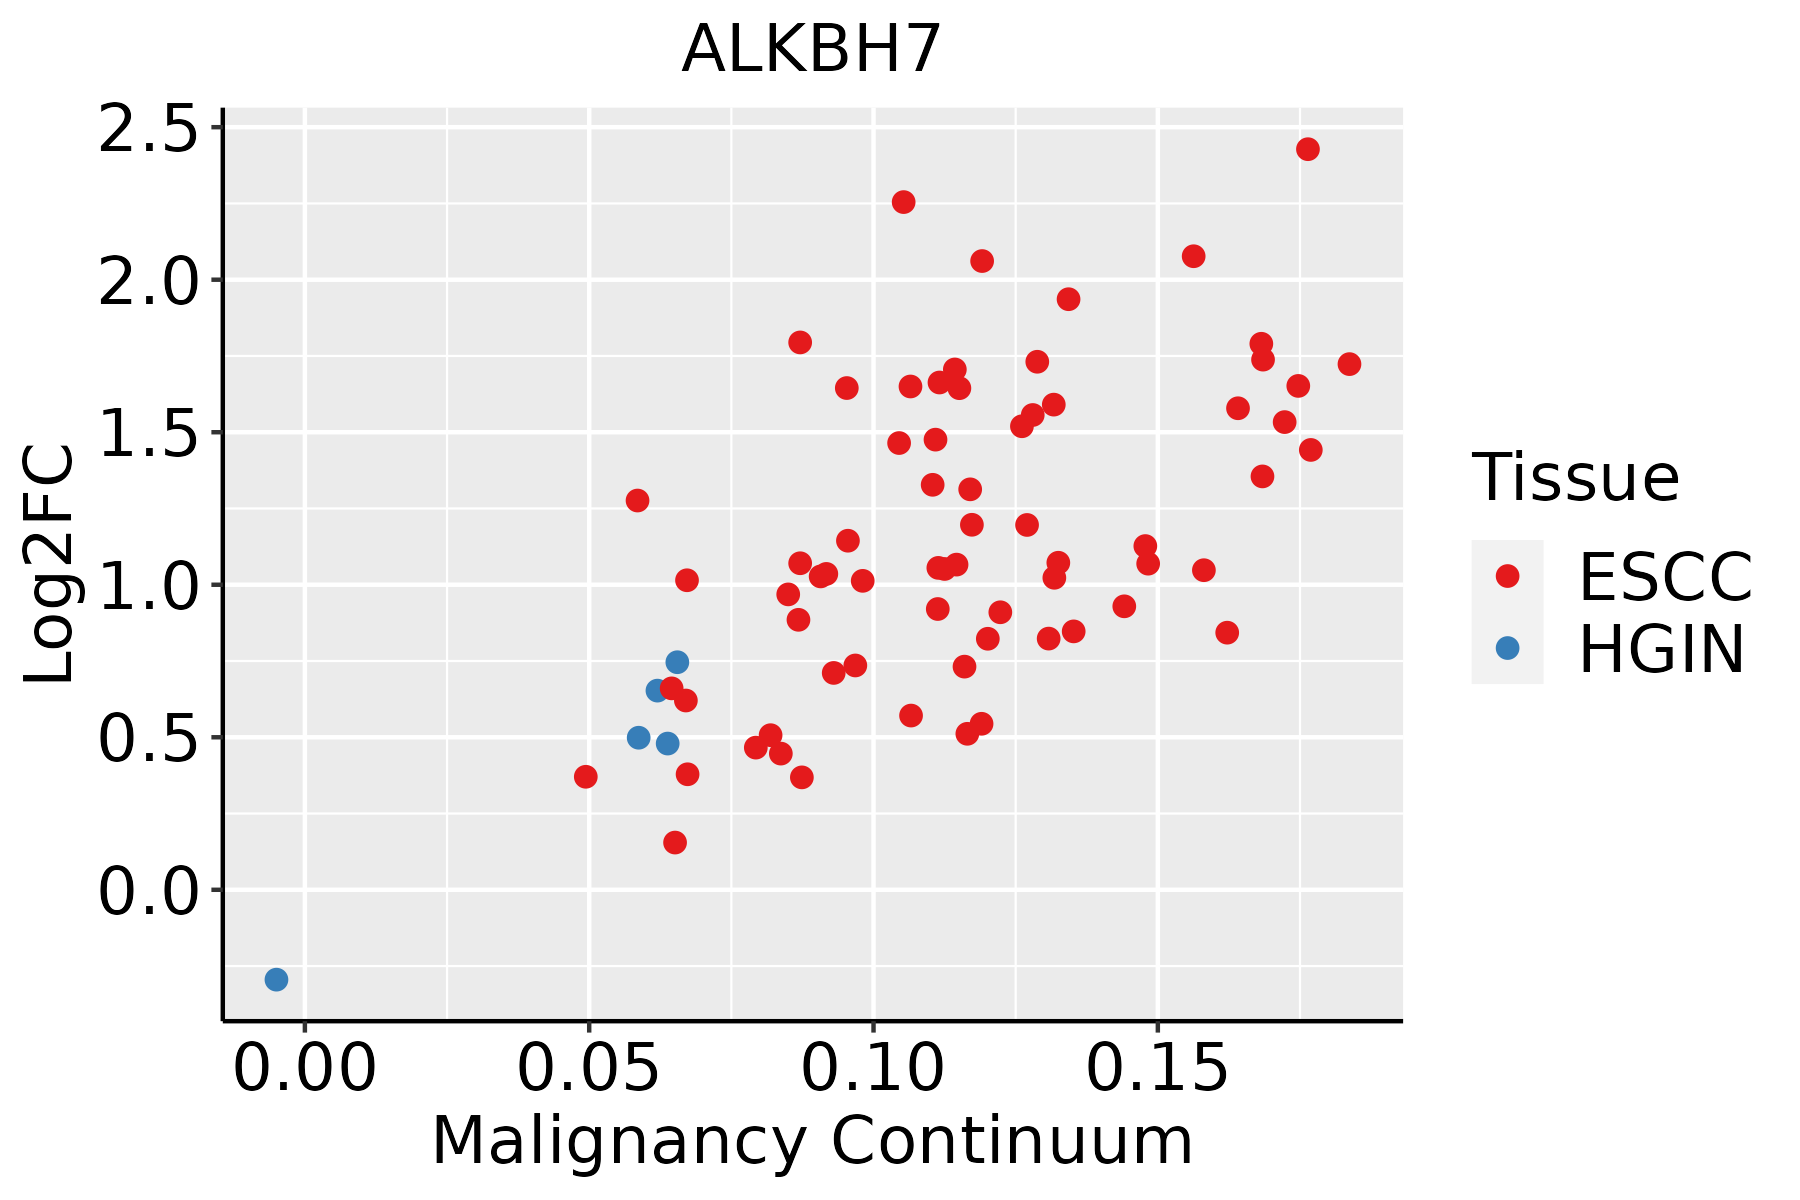 | ESCC: Esophageal squamous cell carcinoma |
| HGIN: High-grade intraepithelial neoplasias |
| LGIN: Low-grade intraepithelial neoplasias |
| GC | 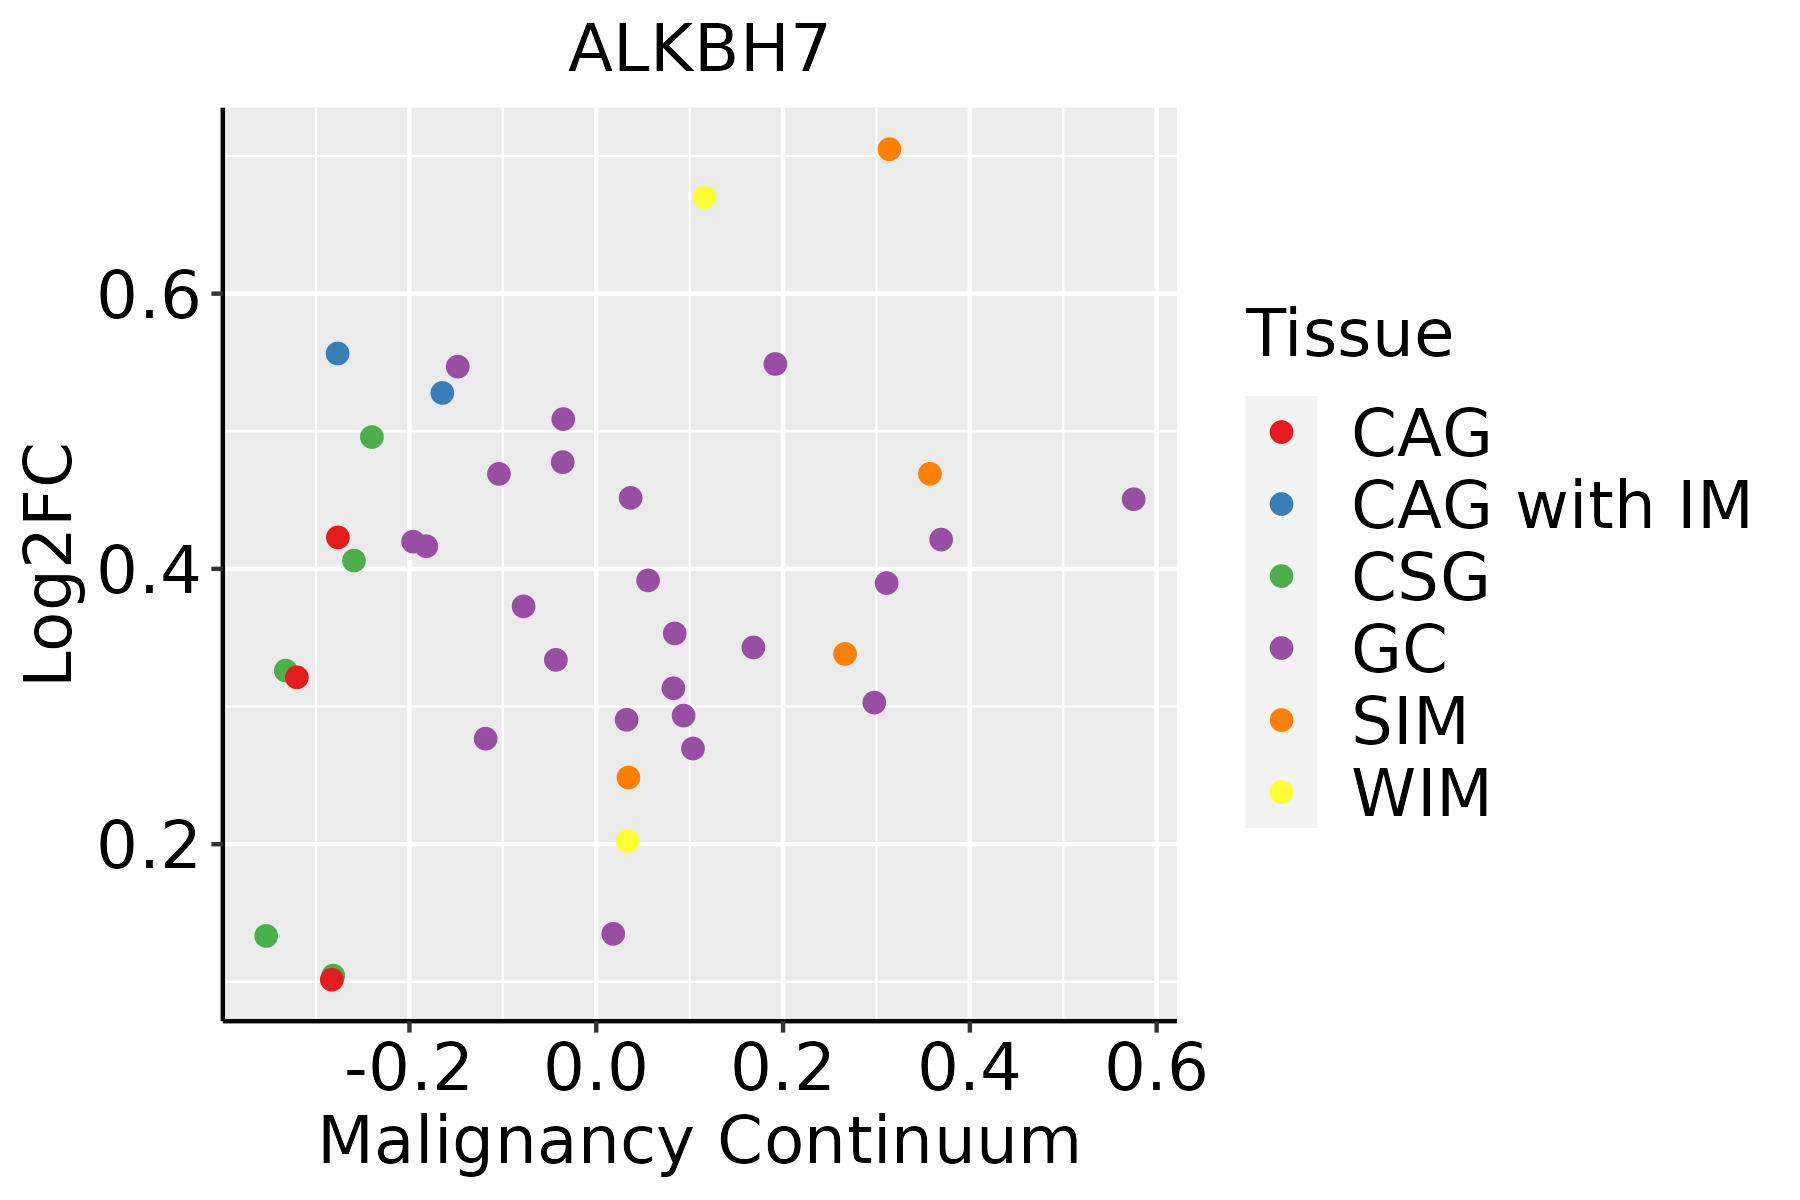 | CAG: Chronic atrophic gastritis |
| CAG with IM: Chronic atrophic gastritis with intestinal metaplasia |
| CSG: Chronic superficial gastritis |
| GC: Gastric cancer |
| SIM: Severe intestinal metaplasia |
| WIM: Wild intestinal metaplasia |
| Liver |  | HCC: Hepatocellular carcinoma |
| NAFLD: Non-alcoholic fatty liver disease |
| Oral Cavity | 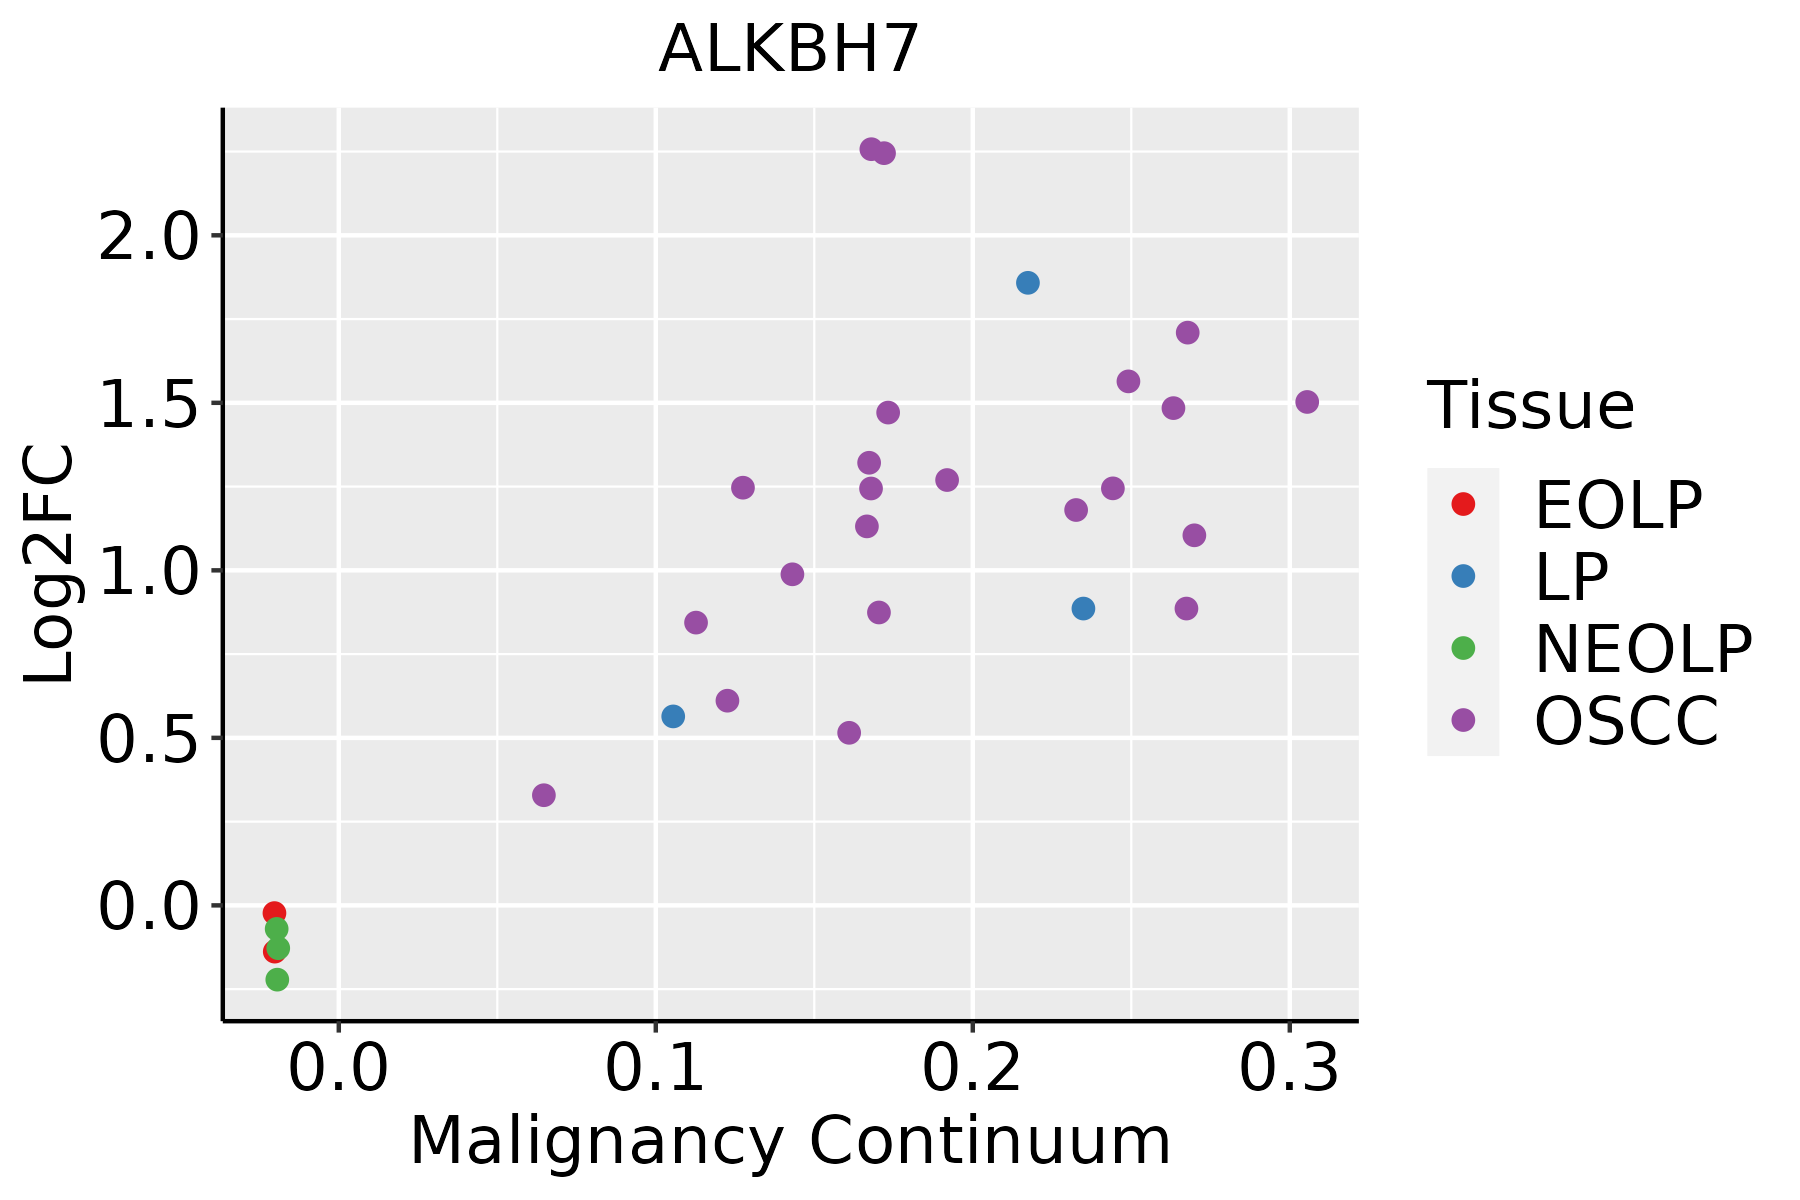 | EOLP: Erosive Oral lichen planus |
| LP: leukoplakia |
| NEOLP: Non-erosive oral lichen planus |
| OSCC: Oral squamous cell carcinoma |
| Prostate | 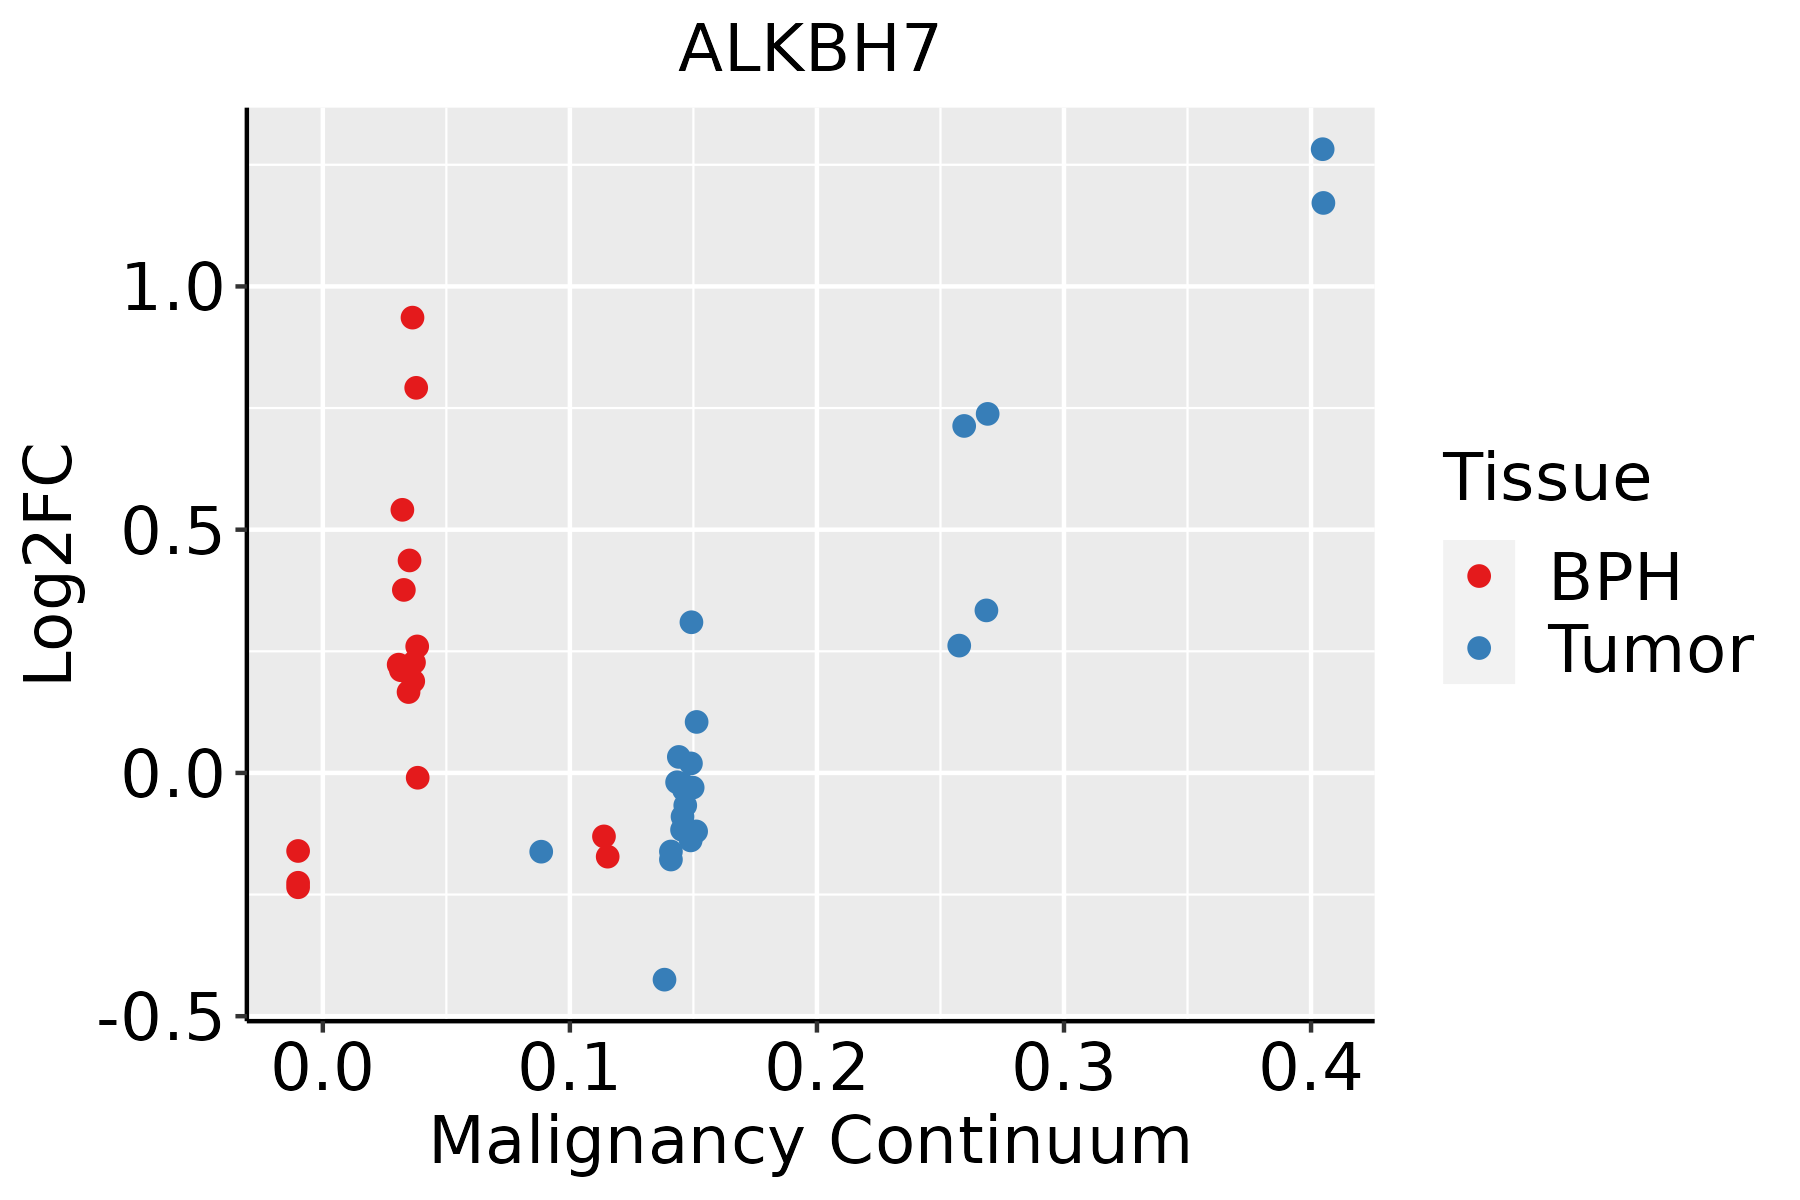 | BPH: Benign Prostatic Hyperplasia |
| Skin | 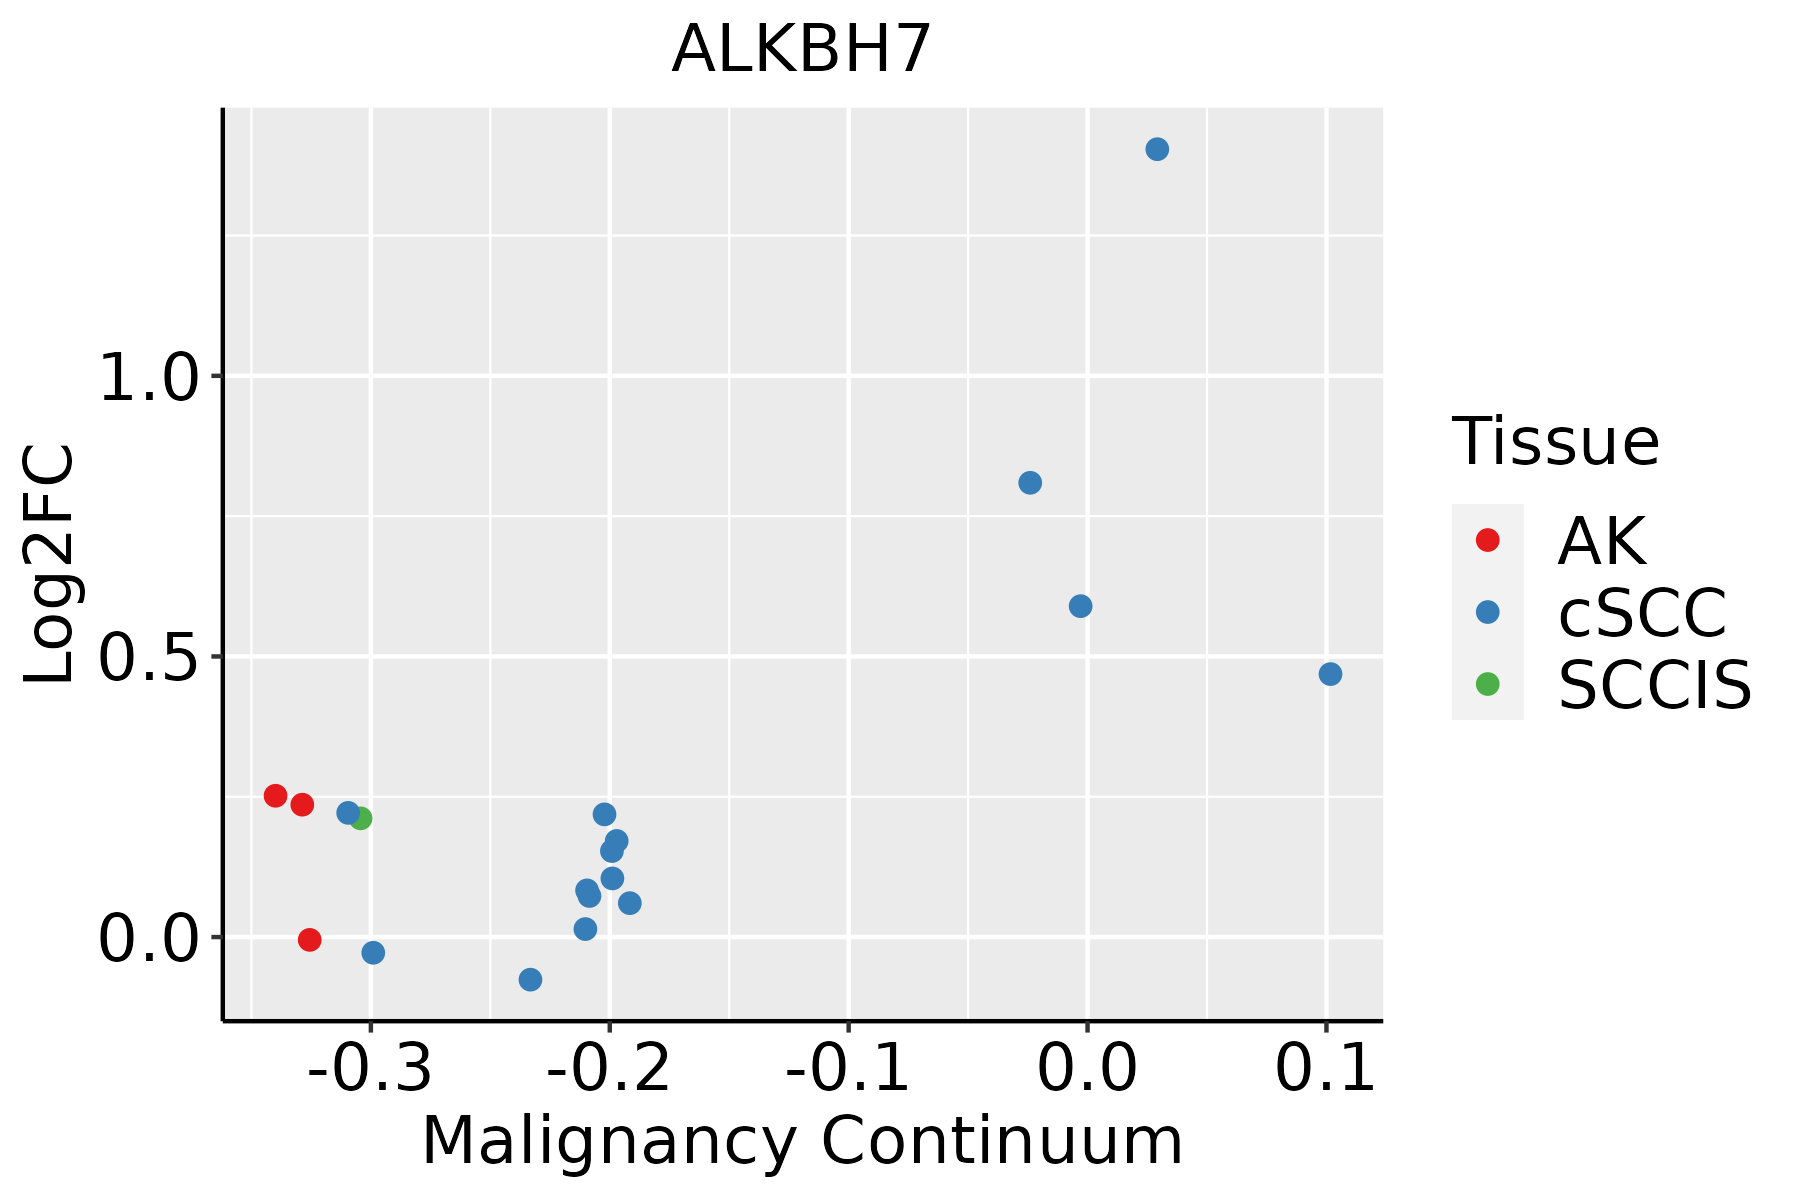 | AK: Actinic keratosis |
| cSCC: Cutaneous squamous cell carcinoma |
| SCCIS:squamous cell carcinoma in situ |
| Thyroid |  | ATC: Anaplastic thyroid cancer |
| HT: Hashimoto's thyroiditis |
| PTC: Papillary thyroid cancer |
| GO ID | Tissue | Disease Stage | Description | Gene Ratio | Bg Ratio | pvalue | p.adjust | Count |
| GO:000683919 | Oral cavity | LP | mitochondrial transport | 119/4623 | 254/18723 | 1.06e-14 | 1.33e-12 | 119 |
| GO:000700617 | Oral cavity | LP | mitochondrial membrane organization | 61/4623 | 116/18723 | 9.44e-11 | 5.63e-09 | 61 |
| GO:004690216 | Oral cavity | LP | regulation of mitochondrial membrane permeability | 31/4623 | 63/18723 | 2.20e-05 | 3.58e-04 | 31 |
| GO:009055916 | Oral cavity | LP | regulation of membrane permeability | 35/4623 | 78/18723 | 7.85e-05 | 1.02e-03 | 35 |
| GO:005123519 | Oral cavity | LP | maintenance of location | 111/4623 | 327/18723 | 9.62e-05 | 1.20e-03 | 111 |
| GO:000683916 | Prostate | BPH | mitochondrial transport | 79/3107 | 254/18723 | 6.77e-09 | 2.38e-07 | 79 |
| GO:005123516 | Prostate | BPH | maintenance of location | 80/3107 | 327/18723 | 1.55e-04 | 1.36e-03 | 80 |
| GO:00070069 | Prostate | BPH | mitochondrial membrane organization | 35/3107 | 116/18723 | 1.98e-04 | 1.63e-03 | 35 |
| GO:00905597 | Prostate | BPH | regulation of membrane permeability | 25/3107 | 78/18723 | 5.74e-04 | 3.99e-03 | 25 |
| GO:00469027 | Prostate | BPH | regulation of mitochondrial membrane permeability | 19/3107 | 63/18723 | 5.36e-03 | 2.49e-02 | 19 |
| GO:000683917 | Prostate | Tumor | mitochondrial transport | 84/3246 | 254/18723 | 7.17e-10 | 3.57e-08 | 84 |
| GO:000700616 | Prostate | Tumor | mitochondrial membrane organization | 35/3246 | 116/18723 | 4.65e-04 | 3.48e-03 | 35 |
| GO:009055915 | Prostate | Tumor | regulation of membrane permeability | 25/3246 | 78/18723 | 1.11e-03 | 7.12e-03 | 25 |
| GO:005123517 | Prostate | Tumor | maintenance of location | 78/3246 | 327/18723 | 1.56e-03 | 9.55e-03 | 78 |
| GO:004690215 | Prostate | Tumor | regulation of mitochondrial membrane permeability | 19/3246 | 63/18723 | 8.63e-03 | 3.75e-02 | 19 |
| GO:000683927 | Skin | cSCC | mitochondrial transport | 124/4864 | 254/18723 | 3.54e-15 | 2.81e-13 | 124 |
| GO:0007006110 | Skin | cSCC | mitochondrial membrane organization | 64/4864 | 116/18723 | 2.16e-11 | 1.08e-09 | 64 |
| GO:004690218 | Skin | cSCC | regulation of mitochondrial membrane permeability | 30/4864 | 63/18723 | 1.76e-04 | 1.50e-03 | 30 |
| GO:009055917 | Skin | cSCC | regulation of membrane permeability | 35/4864 | 78/18723 | 2.32e-04 | 1.91e-03 | 35 |
| GO:005123527 | Skin | cSCC | maintenance of location | 106/4864 | 327/18723 | 5.17e-03 | 2.61e-02 | 106 |
| Hugo Symbol | Variant Class | Variant Classification | dbSNP RS | HGVSc | HGVSp | HGVSp Short | SWISSPROT | BIOTYPE | SIFT | PolyPhen | Tumor Sample Barcode | Tissue | Histology | Sex | Age | Stage | Therapy Types | Drugs | Outcome |
| ALKBH7 | SNV | Missense_Mutation | novel | c.218N>C | p.Phe73Ser | p.F73S | Q9BT30 | protein_coding | deleterious(0) | probably_damaging(0.912) | TCGA-A8-A09T-01 | Breast | breast invasive carcinoma | Female | >=65 | I/II | Hormone Therapy | anastrozole | SD |
| ALKBH7 | SNV | Missense_Mutation | | c.429G>A | p.Met143Ile | p.M143I | Q9BT30 | protein_coding | deleterious(0) | probably_damaging(0.97) | TCGA-AR-A0U3-01 | Breast | breast invasive carcinoma | Female | <65 | I/II | Chemotherapy | doxorubicin | SD |
| ALKBH7 | SNV | Missense_Mutation | novel | c.367N>T | p.Asp123Tyr | p.D123Y | Q9BT30 | protein_coding | deleterious(0) | probably_damaging(1) | TCGA-DS-A1OB-01 | Cervix | cervical & endocervical cancer | Female | <65 | I/II | Chemotherapy | carboplatin | PD |
| ALKBH7 | SNV | Missense_Mutation | rs756913702 | c.607N>T | p.Arg203Cys | p.R203C | Q9BT30 | protein_coding | deleterious(0) | probably_damaging(0.999) | TCGA-MA-AA42-01 | Cervix | cervical & endocervical cancer | Female | >=65 | I/II | Unknown | Unknown | SD |
| ALKBH7 | insertion | Nonsense_Mutation | novel | c.365_366insTCTTCTGCACTGTAACTGCTAGCAGC | p.Asp123LeufsTer7 | p.D123Lfs*7 | Q9BT30 | protein_coding | | | TCGA-DS-A1OB-01 | Cervix | cervical & endocervical cancer | Female | <65 | I/II | Chemotherapy | carboplatin | PD |
| ALKBH7 | SNV | Missense_Mutation | rs755922067 | c.590N>A | p.Arg197His | p.R197H | Q9BT30 | protein_coding | deleterious(0) | probably_damaging(0.999) | TCGA-AX-A0J1-01 | Endometrium | uterine corpus endometrioid carcinoma | Female | >=65 | I/II | Unknown | Unknown | SD |
| ALKBH7 | SNV | Missense_Mutation | rs147538989 | c.586N>T | p.Arg196Trp | p.R196W | Q9BT30 | protein_coding | deleterious(0) | probably_damaging(1) | TCGA-B5-A5OC-01 | Endometrium | uterine corpus endometrioid carcinoma | Female | >=65 | III/IV | Chemotherapy | cisplatin | SD |
| ALKBH7 | SNV | Missense_Mutation | novel | c.364N>A | p.Val122Met | p.V122M | Q9BT30 | protein_coding | deleterious(0) | probably_damaging(0.979) | TCGA-E6-A2P8-01 | Endometrium | uterine corpus endometrioid carcinoma | Female | <65 | III/IV | Unknown | Unknown | PD |
| ALKBH7 | SNV | Missense_Mutation | rs199888358 | c.271N>T | p.Arg91Cys | p.R91C | Q9BT30 | protein_coding | deleterious(0) | probably_damaging(0.999) | TCGA-EY-A1H0-01 | Endometrium | uterine corpus endometrioid carcinoma | Female | <65 | III/IV | Chemotherapy | taxol | SD |
| ALKBH7 | SNV | Missense_Mutation | | c.496N>C | p.Ile166Leu | p.I166L | Q9BT30 | protein_coding | deleterious(0.01) | probably_damaging(0.947) | TCGA-BC-A69H-01 | Liver | liver hepatocellular carcinoma | Male | <65 | I/II | Unknown | Unknown | SD |


