
|
|||||
|
 | |
| |
| |
| |
| |
| |
|
Gene: AJUBA |
Gene summary for AJUBA |
| Gene information | Species | Human | Gene symbol | AJUBA | Gene ID | 84962 |
| Gene name | ajuba LIM protein | |
| Gene Alias | JUB | |
| Cytomap | 14q11.2 | |
| Gene Type | protein-coding | GO ID | GO:0000122 | UniProtAcc | Q96IF1 |
Top |
Malignant transformation analysis |
| Identification of the aberrant gene expression in precancerous and cancerous lesions by comparing the gene expression of stem-like cells in diseased tissues with normal stem cells |
| Entrez ID | Symbol | Replicates | Species | Organ | Tissue | Adj P-value | Log2FC | Malignancy |
| 84962 | AJUBA | LZE2T | Human | Esophagus | ESCC | 1.14e-02 | 3.13e-01 | 0.082 |
| 84962 | AJUBA | LZE22T | Human | Esophagus | ESCC | 2.77e-03 | 2.02e-01 | 0.068 |
| 84962 | AJUBA | LZE24T | Human | Esophagus | ESCC | 6.19e-03 | 3.23e-01 | 0.0596 |
| 84962 | AJUBA | P1T-E | Human | Esophagus | ESCC | 3.63e-04 | 1.54e-01 | 0.0875 |
| 84962 | AJUBA | P2T-E | Human | Esophagus | ESCC | 1.93e-22 | 3.93e-01 | 0.1177 |
| 84962 | AJUBA | P4T-E | Human | Esophagus | ESCC | 1.07e-06 | 2.90e-01 | 0.1323 |
| 84962 | AJUBA | P5T-E | Human | Esophagus | ESCC | 5.23e-08 | 2.38e-01 | 0.1327 |
| 84962 | AJUBA | P8T-E | Human | Esophagus | ESCC | 8.45e-24 | 8.02e-01 | 0.0889 |
| 84962 | AJUBA | P9T-E | Human | Esophagus | ESCC | 7.36e-06 | 1.91e-01 | 0.1131 |
| 84962 | AJUBA | P10T-E | Human | Esophagus | ESCC | 6.27e-36 | 8.09e-01 | 0.116 |
| 84962 | AJUBA | P11T-E | Human | Esophagus | ESCC | 8.45e-12 | 7.38e-01 | 0.1426 |
| 84962 | AJUBA | P12T-E | Human | Esophagus | ESCC | 1.12e-34 | 8.53e-01 | 0.1122 |
| 84962 | AJUBA | P15T-E | Human | Esophagus | ESCC | 1.21e-31 | 8.71e-01 | 0.1149 |
| 84962 | AJUBA | P16T-E | Human | Esophagus | ESCC | 5.22e-11 | 2.47e-01 | 0.1153 |
| 84962 | AJUBA | P17T-E | Human | Esophagus | ESCC | 1.67e-05 | 4.33e-01 | 0.1278 |
| 84962 | AJUBA | P20T-E | Human | Esophagus | ESCC | 1.50e-06 | 2.12e-01 | 0.1124 |
| 84962 | AJUBA | P21T-E | Human | Esophagus | ESCC | 8.18e-20 | 4.69e-01 | 0.1617 |
| 84962 | AJUBA | P22T-E | Human | Esophagus | ESCC | 3.23e-09 | 6.97e-02 | 0.1236 |
| 84962 | AJUBA | P23T-E | Human | Esophagus | ESCC | 7.61e-03 | 1.93e-01 | 0.108 |
| 84962 | AJUBA | P24T-E | Human | Esophagus | ESCC | 6.45e-09 | 6.30e-02 | 0.1287 |
| Page: 1 2 3 4 |
| Tissue | Expression Dynamics | Abbreviation |
| Esophagus | 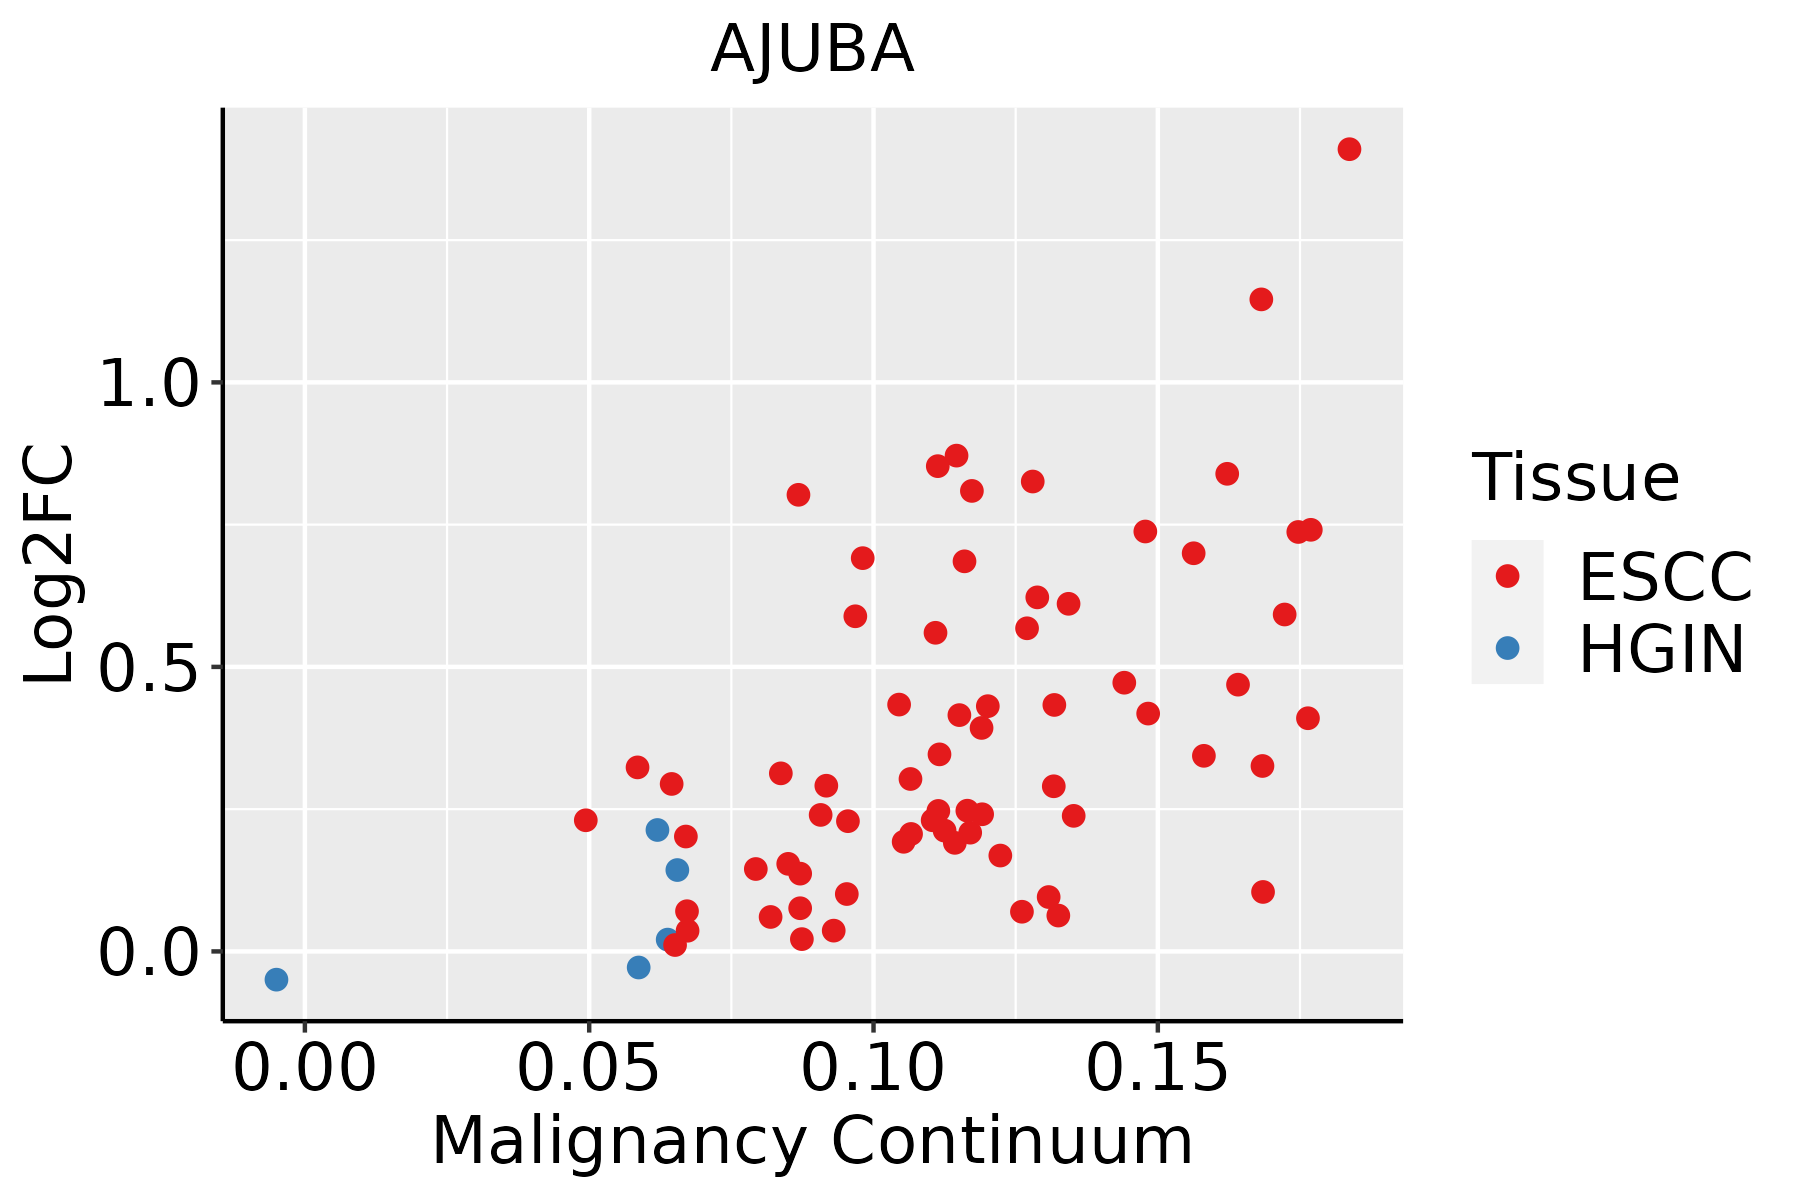 | ESCC: Esophageal squamous cell carcinoma |
| HGIN: High-grade intraepithelial neoplasias | ||
| LGIN: Low-grade intraepithelial neoplasias | ||
| Oral Cavity | 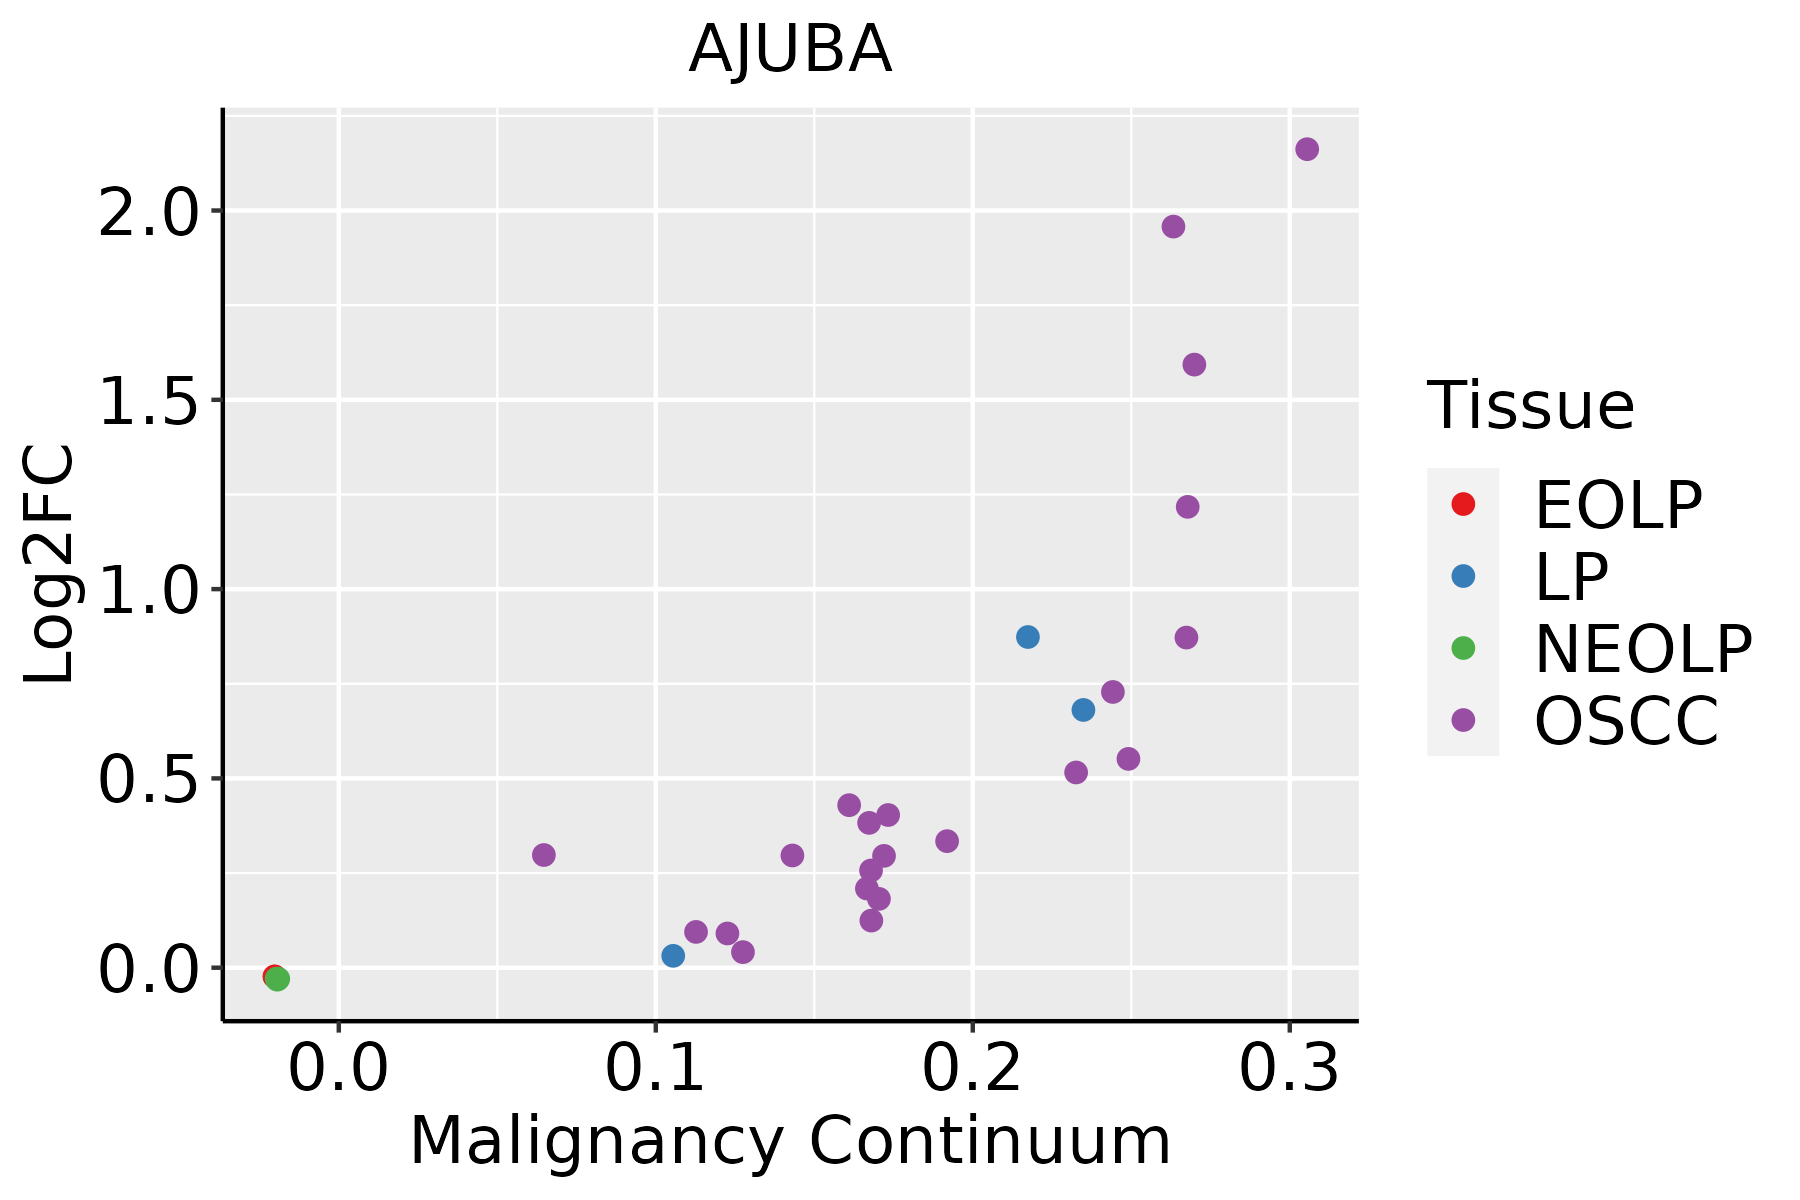 | EOLP: Erosive Oral lichen planus |
| LP: leukoplakia | ||
| NEOLP: Non-erosive oral lichen planus | ||
| OSCC: Oral squamous cell carcinoma | ||
| Skin | 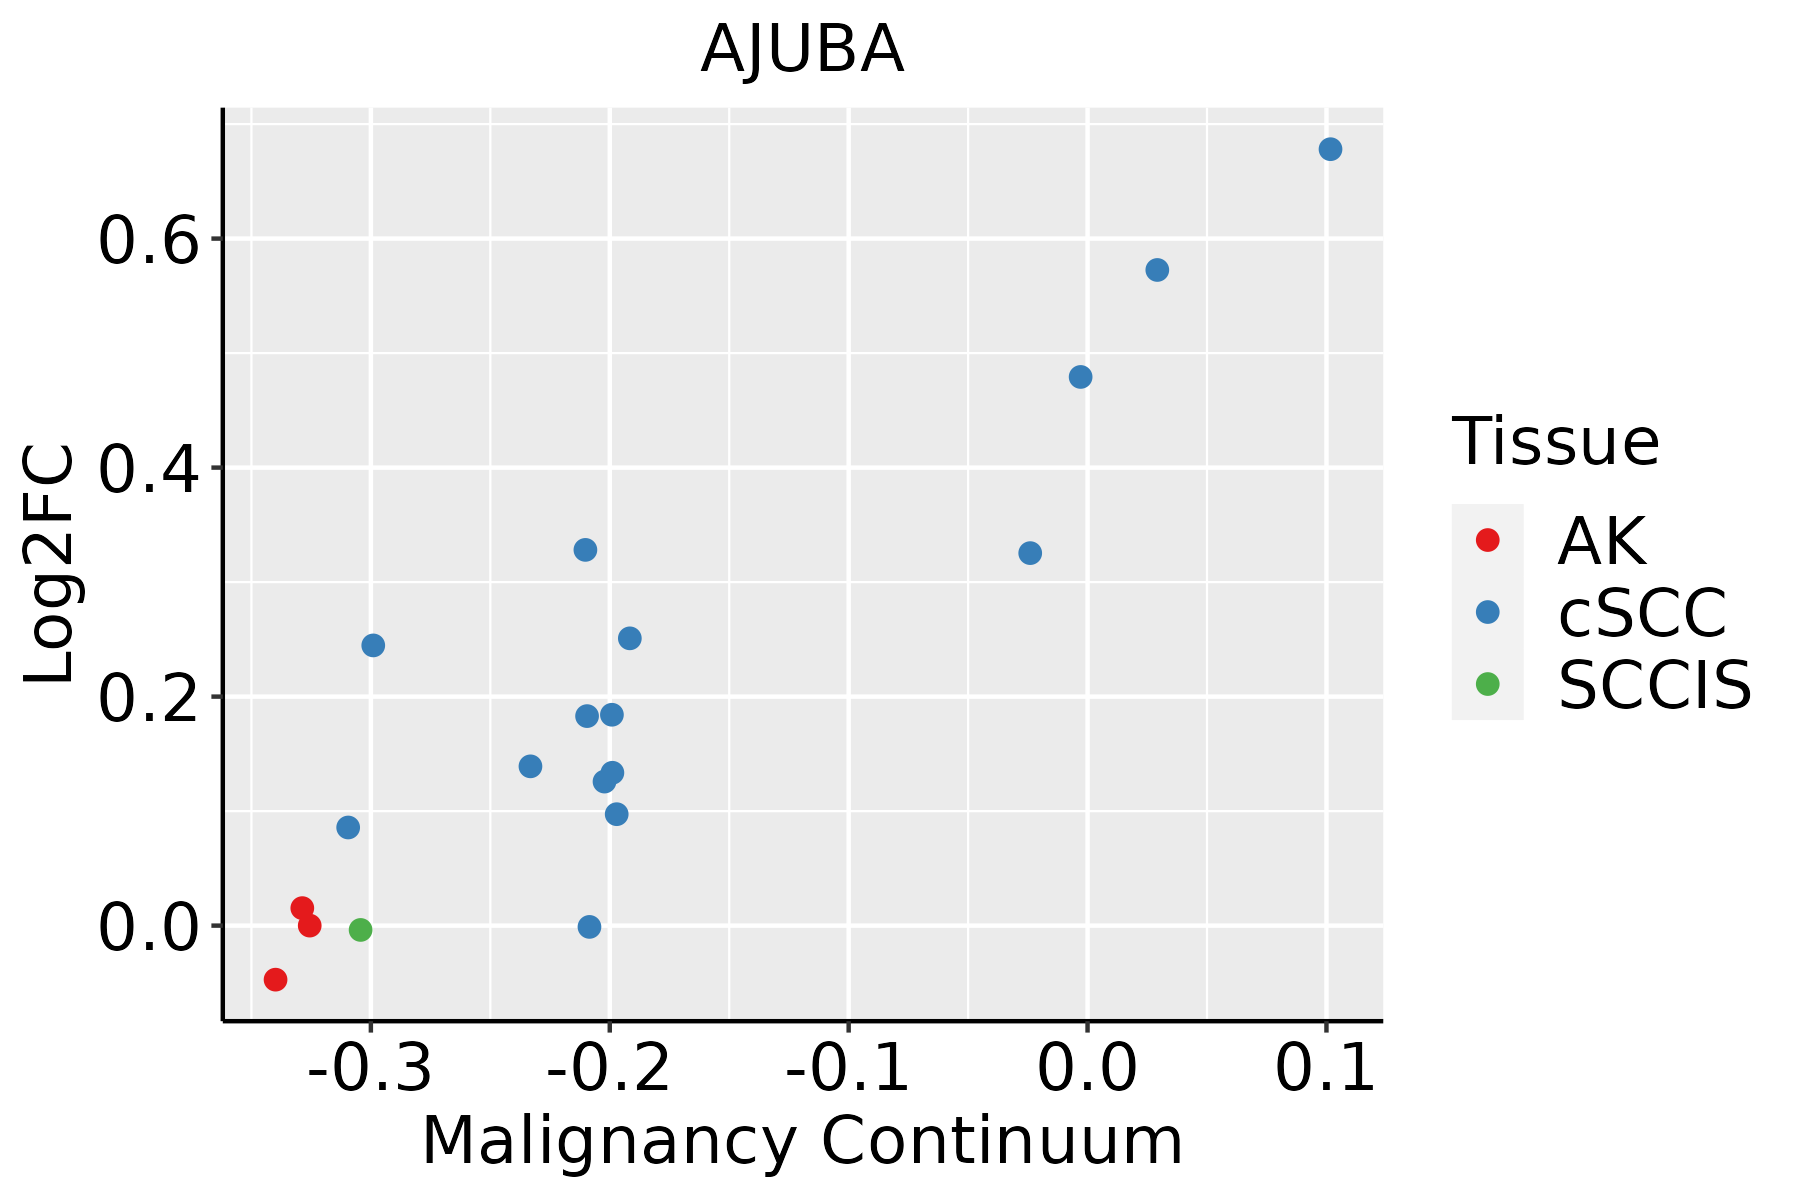 | AK: Actinic keratosis |
| cSCC: Cutaneous squamous cell carcinoma | ||
| SCCIS:squamous cell carcinoma in situ |
| ∗log2FC in expression of this searched gene in stem-like cells from each diseased tissue sample relative to stem-like cells in normal samples in each tissue plotted against the malignancy continuum. Samples are colored based on if they are from different disease stage. |
Top |
Malignant transformation related pathway analysis |
| Find out the enriched GO biological processes and KEGG pathways involved in transition from healthy to precancer to cancer |
| Tissue | Disease Stage | Enriched GO biological Processes |
| Colorectum | AD |  |
| Colorectum | SER |  |
| Colorectum | MSS |  |
| Colorectum | MSI-H |  |
| Colorectum | FAP |  |
| ∗Top 15 enriched GO BP terms are showed in the bar plot of each disease state in each tissue. Each row represents a significant GO biological process which is colored according to the -log10(p.adjust). |
| Page: 1 2 3 4 5 6 7 8 9 |
| GO ID | Tissue | Disease Stage | Description | Gene Ratio | Bg Ratio | pvalue | p.adjust | Count |
| GO:00905046 | Oral cavity | OSCC | epiboly | 25/7305 | 35/18723 | 1.02e-04 | 7.63e-04 | 25 |
| GO:20006376 | Oral cavity | OSCC | positive regulation of gene silencing by miRNA | 21/7305 | 30/18723 | 5.75e-04 | 3.30e-03 | 21 |
| GO:004308710 | Oral cavity | OSCC | regulation of GTPase activity | 165/7305 | 348/18723 | 7.94e-04 | 4.27e-03 | 165 |
| GO:00601486 | Oral cavity | OSCC | positive regulation of posttranscriptional gene silencing | 21/7305 | 31/18723 | 1.13e-03 | 5.75e-03 | 21 |
| GO:00609666 | Oral cavity | OSCC | regulation of gene silencing by RNA | 32/7305 | 53/18723 | 1.32e-03 | 6.56e-03 | 32 |
| GO:00609649 | Oral cavity | OSCC | regulation of gene silencing by miRNA | 30/7305 | 49/18723 | 1.35e-03 | 6.62e-03 | 30 |
| GO:00300328 | Oral cavity | OSCC | lamellipodium assembly | 41/7305 | 72/18723 | 1.53e-03 | 7.31e-03 | 41 |
| GO:00601478 | Oral cavity | OSCC | regulation of posttranscriptional gene silencing | 31/7305 | 52/18723 | 2.08e-03 | 9.59e-03 | 31 |
| GO:00464743 | Oral cavity | OSCC | glycerophospholipid biosynthetic process | 102/7305 | 211/18723 | 3.50e-03 | 1.48e-02 | 102 |
| GO:00434062 | Oral cavity | OSCC | positive regulation of MAP kinase activity | 58/7305 | 112/18723 | 4.01e-03 | 1.64e-02 | 58 |
| GO:00066445 | Oral cavity | OSCC | phospholipid metabolic process | 175/7305 | 383/18723 | 4.21e-03 | 1.71e-02 | 175 |
| GO:003432916 | Oral cavity | OSCC | cell junction assembly | 190/7305 | 420/18723 | 4.99e-03 | 1.96e-02 | 190 |
| GO:00434107 | Oral cavity | OSCC | positive regulation of MAPK cascade | 213/7305 | 480/18723 | 8.71e-03 | 3.16e-02 | 213 |
| GO:004312316 | Oral cavity | LP | positive regulation of I-kappaB kinase/NF-kappaB signaling | 88/4623 | 186/18723 | 1.58e-11 | 1.13e-09 | 88 |
| GO:0043254110 | Oral cavity | LP | regulation of protein-containing complex assembly | 163/4623 | 428/18723 | 3.72e-10 | 1.92e-08 | 163 |
| GO:004312219 | Oral cavity | LP | regulation of I-kappaB kinase/NF-kappaB signaling | 103/4623 | 249/18723 | 4.48e-09 | 1.90e-07 | 103 |
| GO:0031334110 | Oral cavity | LP | positive regulation of protein-containing complex assembly | 99/4623 | 237/18723 | 4.83e-09 | 2.00e-07 | 99 |
| GO:0051348110 | Oral cavity | LP | negative regulation of transferase activity | 106/4623 | 268/18723 | 4.60e-08 | 1.61e-06 | 106 |
| GO:000724917 | Oral cavity | LP | I-kappaB kinase/NF-kappaB signaling | 110/4623 | 281/18723 | 4.94e-08 | 1.70e-06 | 110 |
| GO:0010563110 | Oral cavity | LP | negative regulation of phosphorus metabolic process | 153/4623 | 442/18723 | 1.47e-06 | 3.53e-05 | 153 |
| Page: 1 2 3 4 5 6 7 8 |
| Pathway ID | Tissue | Disease Stage | Description | Gene Ratio | Bg Ratio | pvalue | p.adjust | qvalue | Count |
| hsa0439018 | Esophagus | ESCC | Hippo signaling pathway | 92/4205 | 157/8465 | 1.46e-02 | 3.31e-02 | 1.69e-02 | 92 |
| hsa0439019 | Esophagus | ESCC | Hippo signaling pathway | 92/4205 | 157/8465 | 1.46e-02 | 3.31e-02 | 1.69e-02 | 92 |
| hsa0439016 | Oral cavity | OSCC | Hippo signaling pathway | 86/3704 | 157/8465 | 3.30e-03 | 8.24e-03 | 4.20e-03 | 86 |
| hsa0439017 | Oral cavity | OSCC | Hippo signaling pathway | 86/3704 | 157/8465 | 3.30e-03 | 8.24e-03 | 4.20e-03 | 86 |
| Page: 1 |
Top |
Cell-cell communication analysis |
| Identification of potential cell-cell interactions between two cell types and their ligand-receptor pairs for different disease states |
| Ligand | Receptor | LRpair | Pathway | Tissue | Disease Stage |
| Page: 1 |
Top |
Single-cell gene regulatory network inference analysis |
| Find out the significant the regulons (TFs) and the target genes of each regulon across cell types for different disease states |
| TF | Cell Type | Tissue | Disease Stage | Target Gene | RSS | Regulon Activity |
| ∗The dot plots of a searched regulon are shown for all cell subpopulations in each disease state of each tissue based on the regulon specific score inferred using pySCENIC and by calculating the average expression. |
| Page: 1 |
Top |
Somatic mutation of malignant transformation related genes |
| Annotation of somatic variants for genes involved in malignant transformation |
| Hugo Symbol | Variant Class | Variant Classification | dbSNP RS | HGVSc | HGVSp | HGVSp Short | SWISSPROT | BIOTYPE | SIFT | PolyPhen | Tumor Sample Barcode | Tissue | Histology | Sex | Age | Stage | Therapy Types | Drugs | Outcome |
| AJUBA | SNV | Missense_Mutation | c.211N>T | p.Asp71Tyr | p.D71Y | Q96IF1 | protein_coding | deleterious_low_confidence(0) | benign(0.047) | TCGA-A7-A0DA-01 | Breast | breast invasive carcinoma | Female | <65 | I/II | Chemotherapy | adriamycin | SD | |
| AJUBA | SNV | Missense_Mutation | novel | c.731N>T | p.Ala244Val | p.A244V | Q96IF1 | protein_coding | tolerated(0.38) | benign(0.003) | TCGA-C5-A1MI-01 | Cervix | cervical & endocervical cancer | Female | <65 | I/II | Chemotherapy | cisplatin | PD |
| AJUBA | SNV | Missense_Mutation | novel | c.1112N>A | p.Arg371Gln | p.R371Q | Q96IF1 | protein_coding | deleterious(0) | benign(0.073) | TCGA-C5-A8YR-01 | Cervix | cervical & endocervical cancer | Female | <65 | I/II | Unknown | Unknown | PD |
| AJUBA | SNV | Missense_Mutation | c.1168G>C | p.Asp390His | p.D390H | Q96IF1 | protein_coding | deleterious(0) | possibly_damaging(0.573) | TCGA-IR-A3LK-01 | Cervix | cervical & endocervical cancer | Female | >=65 | I/II | Chemotherapy | cisplatin | PD | |
| AJUBA | deletion | Frame_Shift_Del | novel | c.1063delC | p.Leu355TrpfsTer55 | p.L355Wfs*55 | Q96IF1 | protein_coding | TCGA-C5-A8YQ-01 | Cervix | cervical & endocervical cancer | Female | >=65 | I/II | Chemotherapy | cisplatin | PD | ||
| AJUBA | deletion | Frame_Shift_Del | novel | c.769delN | p.Ala257ArgfsTer8 | p.A257Rfs*8 | Q96IF1 | protein_coding | TCGA-MY-A5BF-01 | Cervix | cervical & endocervical cancer | Female | >=65 | I/II | Chemotherapy | cisplatin | CR | ||
| AJUBA | SNV | Missense_Mutation | c.977N>T | p.Arg326Leu | p.R326L | Q96IF1 | protein_coding | tolerated(0.26) | benign(0.045) | TCGA-AD-6890-01 | Colorectum | colon adenocarcinoma | Male | >=65 | I/II | Unknown | Unknown | SD | |
| AJUBA | SNV | Missense_Mutation | c.886G>A | p.Gly296Arg | p.G296R | Q96IF1 | protein_coding | tolerated(0.25) | benign(0.015) | TCGA-CM-6171-01 | Colorectum | colon adenocarcinoma | Female | >=65 | I/II | Unknown | Unknown | SD | |
| AJUBA | SNV | Missense_Mutation | c.1438N>A | p.Val480Met | p.V480M | Q96IF1 | protein_coding | deleterious(0) | possibly_damaging(0.648) | TCGA-F4-6570-01 | Colorectum | colon adenocarcinoma | Female | >=65 | I/II | Unknown | Unknown | SD | |
| AJUBA | deletion | Frame_Shift_Del | novel | c.769delN | p.Ala257ArgfsTer8 | p.A257Rfs*8 | Q96IF1 | protein_coding | TCGA-WS-AB45-01 | Colorectum | colon adenocarcinoma | Female | <65 | I/II | Unknown | Unknown | SD |
| Page: 1 2 3 4 5 |
Top |
Related drugs of malignant transformation related genes |
| Identification of chemicals and drugs interact with genes involved in malignant transfromation |
| (DGIdb 4.0) |
| Entrez ID | Symbol | Category | Interaction Types | Drug Claim Name | Drug Name | PMIDs |
| Page: 1 |

Copyright 2023-Present -The University of Texas Health Science Center at Houston |