
|
|||||
|
 | |
| |
| |
| |
| |
| |
|
Gene: ACAT1 |
Gene summary for ACAT1 |
| Gene information | Species | Human | Gene symbol | ACAT1 | Gene ID | 38 |
| Gene name | acetyl-CoA acetyltransferase 1 | |
| Gene Alias | ACAT | |
| Cytomap | 11q22.3 | |
| Gene Type | protein-coding | GO ID | GO:0001655 | UniProtAcc | A0A140VJX1 |
Top |
Malignant transformation analysis |
| Identification of the aberrant gene expression in precancerous and cancerous lesions by comparing the gene expression of stem-like cells in diseased tissues with normal stem cells |
| Entrez ID | Symbol | Replicates | Species | Organ | Tissue | Adj P-value | Log2FC | Malignancy |
| 38 | ACAT1 | HTA11_347_2000001011 | Human | Colorectum | AD | 1.14e-22 | 6.95e-01 | -0.1954 |
| 38 | ACAT1 | HTA11_83_2000001011 | Human | Colorectum | SER | 2.44e-03 | 4.90e-01 | -0.1526 |
| 38 | ACAT1 | HTA11_5212_2000001011 | Human | Colorectum | AD | 6.17e-07 | 7.38e-01 | -0.2061 |
| 38 | ACAT1 | HTA11_6801_2000001011 | Human | Colorectum | SER | 4.25e-04 | 7.47e-01 | 0.0171 |
| 38 | ACAT1 | HTA11_7469_2000001011 | Human | Colorectum | AD | 1.26e-02 | 7.21e-01 | -0.0124 |
| 38 | ACAT1 | HTA11_99999970781_79442 | Human | Colorectum | MSS | 3.93e-04 | 4.42e-01 | 0.294 |
| 38 | ACAT1 | A015-C-203 | Human | Colorectum | FAP | 4.30e-03 | -9.87e-02 | -0.1294 |
| 38 | ACAT1 | A002-C-205 | Human | Colorectum | FAP | 6.13e-04 | -1.85e-01 | -0.1236 |
| 38 | ACAT1 | A015-C-104 | Human | Colorectum | FAP | 6.48e-03 | -8.87e-02 | -0.1899 |
| 38 | ACAT1 | A002-C-116 | Human | Colorectum | FAP | 4.24e-04 | -1.26e-01 | -0.0452 |
| 38 | ACAT1 | F034 | Human | Colorectum | FAP | 1.44e-02 | -1.10e-01 | -0.0665 |
| 38 | ACAT1 | F072B | Human | Colorectum | FAP | 2.21e-02 | -1.55e-01 | 0.257 |
| 38 | ACAT1 | CRC-1-8810 | Human | Colorectum | CRC | 2.07e-02 | -1.36e-01 | 0.6257 |
| 38 | ACAT1 | LZE3D | Human | Esophagus | HGIN | 1.55e-02 | 5.31e-01 | 0.0668 |
| 38 | ACAT1 | LZE4T | Human | Esophagus | ESCC | 2.13e-03 | 1.61e-01 | 0.0811 |
| 38 | ACAT1 | LZE8T | Human | Esophagus | ESCC | 4.12e-06 | 4.26e-02 | 0.067 |
| 38 | ACAT1 | LZE20T | Human | Esophagus | ESCC | 5.14e-03 | 1.75e-02 | 0.0662 |
| 38 | ACAT1 | LZE24T | Human | Esophagus | ESCC | 4.55e-10 | 2.97e-01 | 0.0596 |
| 38 | ACAT1 | P2T-E | Human | Esophagus | ESCC | 2.89e-13 | 1.57e-01 | 0.1177 |
| 38 | ACAT1 | P4T-E | Human | Esophagus | ESCC | 1.70e-18 | 6.99e-01 | 0.1323 |
| Page: 1 2 3 4 5 6 |
| Tissue | Expression Dynamics | Abbreviation |
| Colorectum (GSE201348) |  | FAP: Familial adenomatous polyposis |
| CRC: Colorectal cancer | ||
| Colorectum (HTA11) |  | AD: Adenomas |
| SER: Sessile serrated lesions | ||
| MSI-H: Microsatellite-high colorectal cancer | ||
| MSS: Microsatellite stable colorectal cancer | ||
| Esophagus | 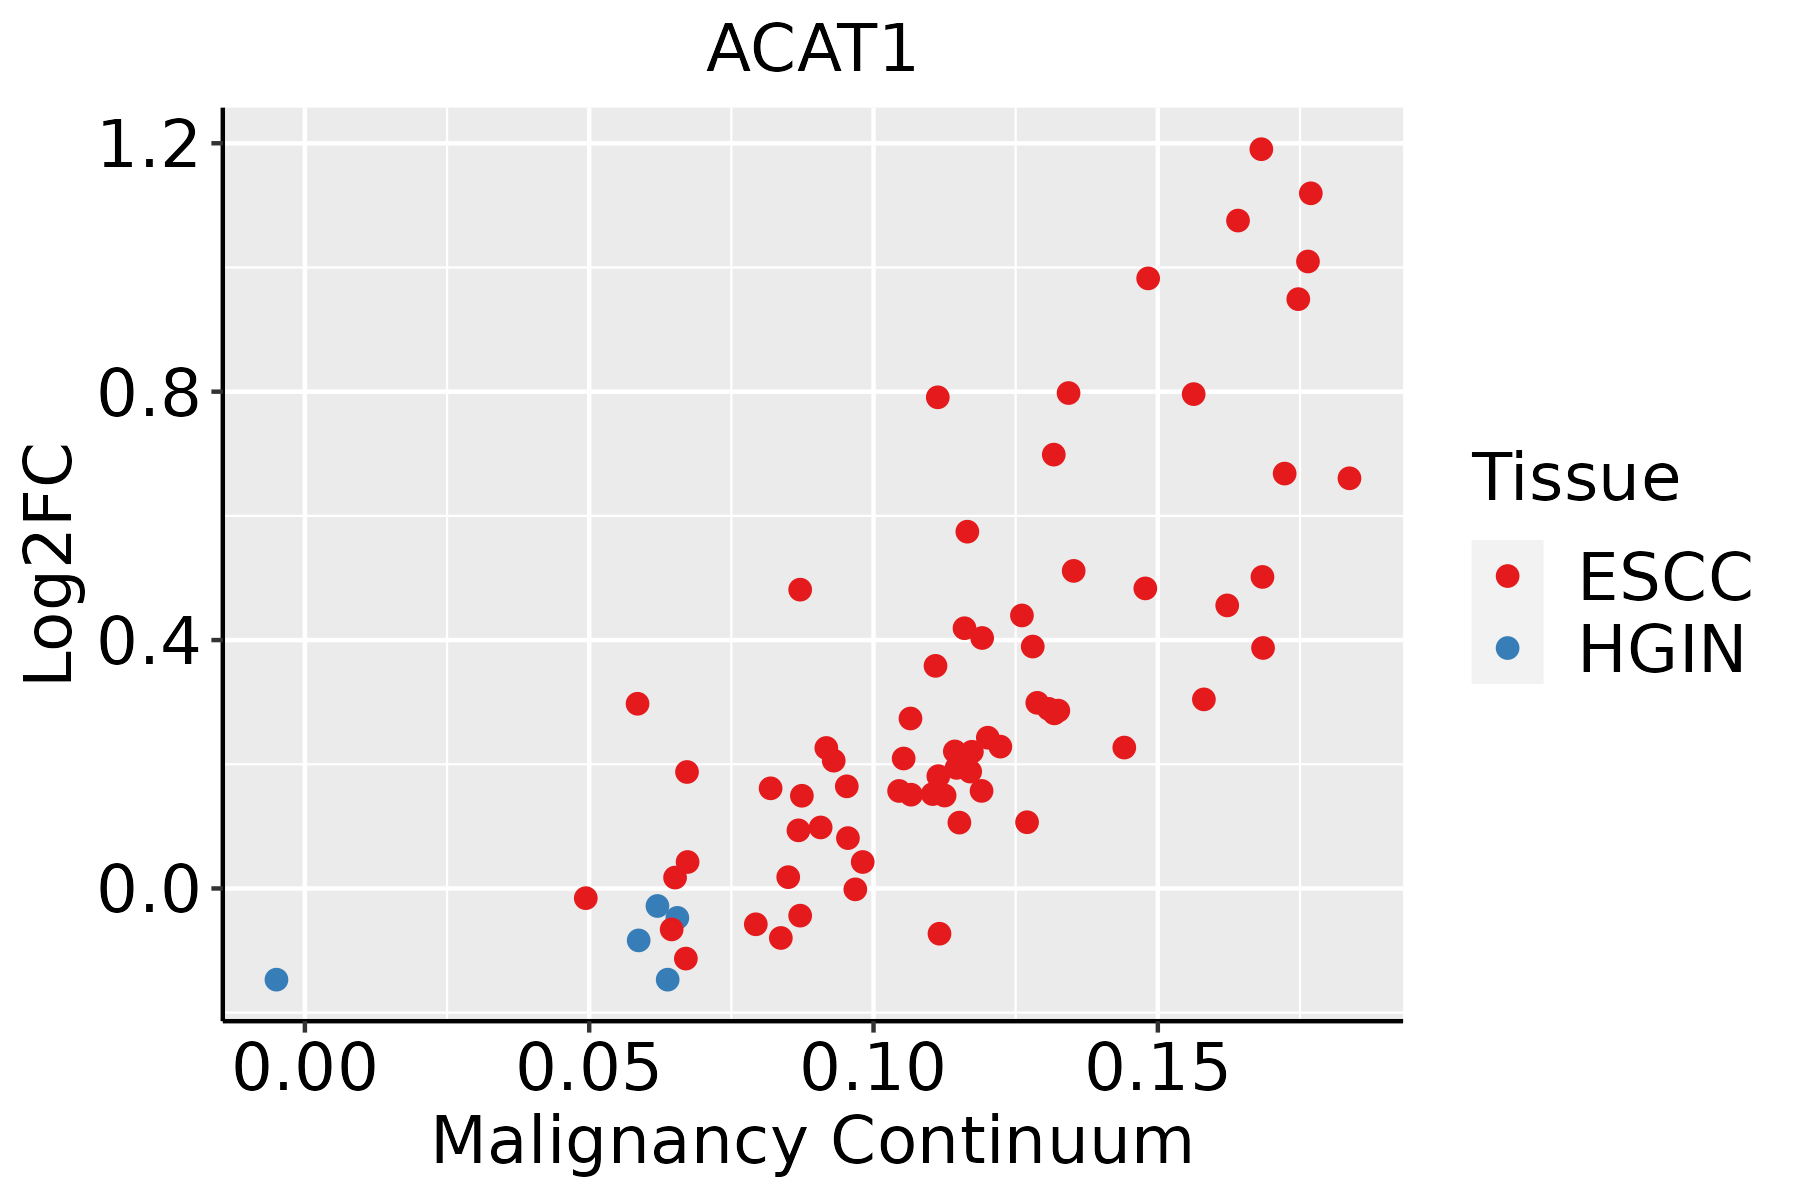 | ESCC: Esophageal squamous cell carcinoma |
| HGIN: High-grade intraepithelial neoplasias | ||
| LGIN: Low-grade intraepithelial neoplasias | ||
| Liver | 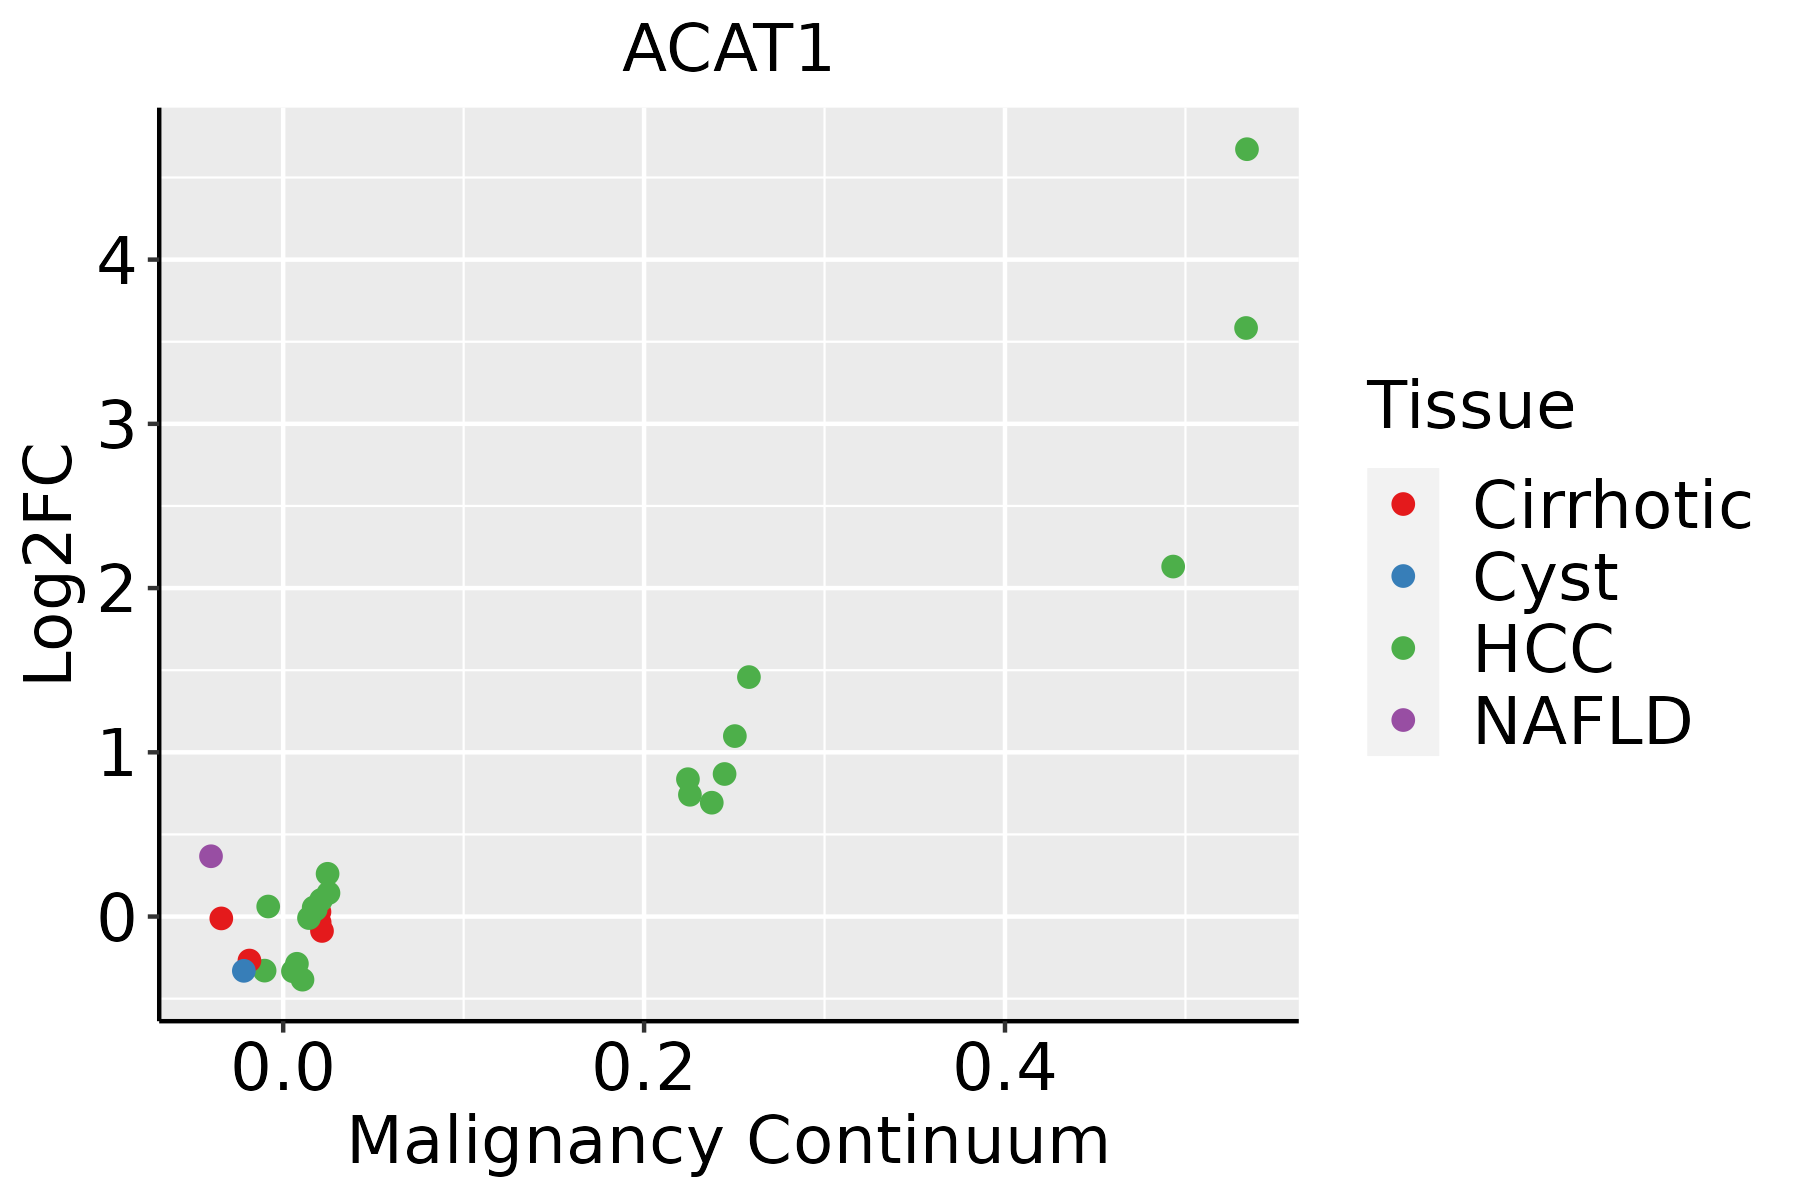 | HCC: Hepatocellular carcinoma |
| NAFLD: Non-alcoholic fatty liver disease | ||
| Oral Cavity | 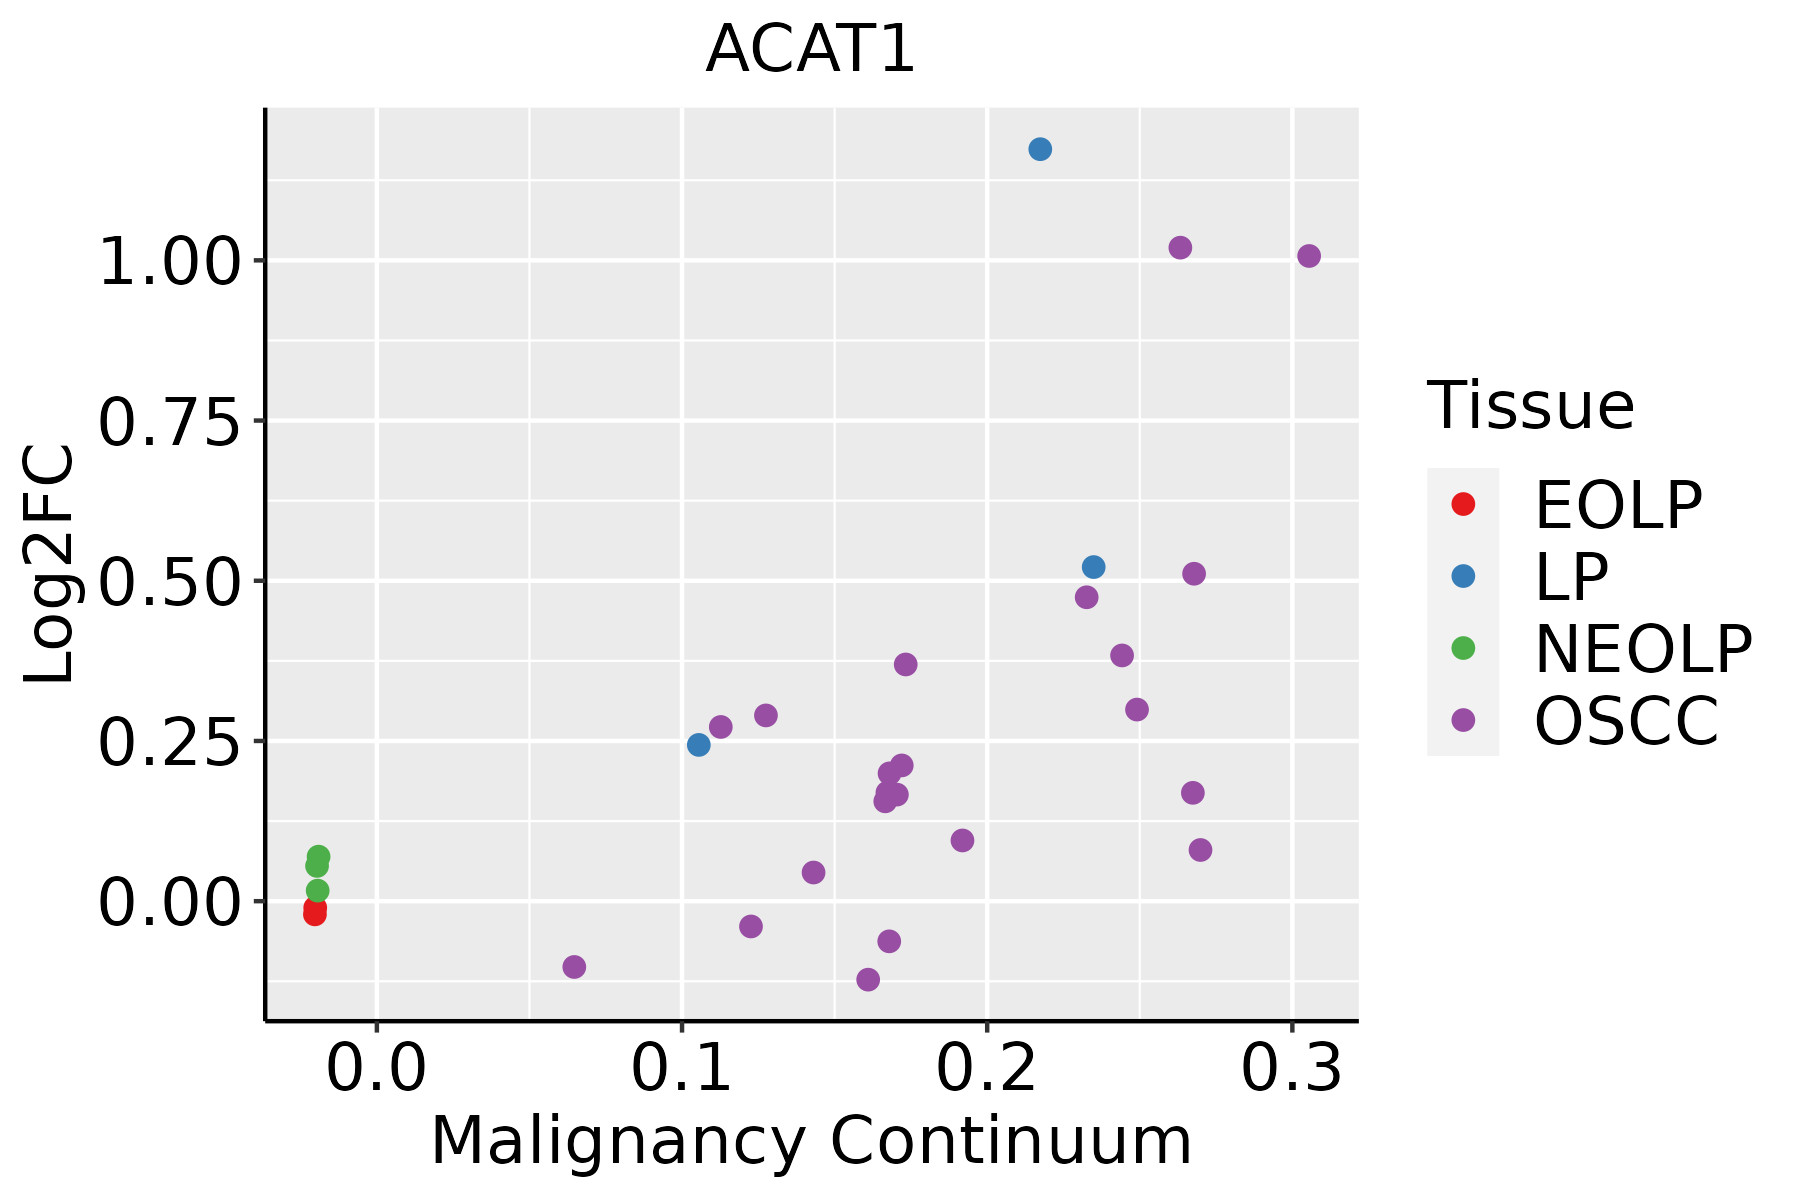 | EOLP: Erosive Oral lichen planus |
| LP: leukoplakia | ||
| NEOLP: Non-erosive oral lichen planus | ||
| OSCC: Oral squamous cell carcinoma | ||
| Skin |  | AK: Actinic keratosis |
| cSCC: Cutaneous squamous cell carcinoma | ||
| SCCIS:squamous cell carcinoma in situ |
| ∗log2FC in expression of this searched gene in stem-like cells from each diseased tissue sample relative to stem-like cells in normal samples in each tissue plotted against the malignancy continuum. Samples are colored based on if they are from different disease stage. |
Top |
Malignant transformation related pathway analysis |
| Find out the enriched GO biological processes and KEGG pathways involved in transition from healthy to precancer to cancer |
| Tissue | Disease Stage | Enriched GO biological Processes |
| Colorectum | AD |  |
| Colorectum | SER |  |
| Colorectum | MSS |  |
| Colorectum | MSI-H |  |
| Colorectum | FAP |  |
| ∗Top 15 enriched GO BP terms are showed in the bar plot of each disease state in each tissue. Each row represents a significant GO biological process which is colored according to the -log10(p.adjust). |
| Page: 1 2 3 4 5 6 7 8 9 |
| GO ID | Tissue | Disease Stage | Description | Gene Ratio | Bg Ratio | pvalue | p.adjust | Count |
| GO:19012931 | Colorectum | SER | nucleoside phosphate biosynthetic process | 58/2897 | 256/18723 | 1.47e-03 | 1.59e-02 | 58 |
| GO:00725231 | Colorectum | SER | purine-containing compound catabolic process | 17/2897 | 52/18723 | 1.53e-03 | 1.64e-02 | 17 |
| GO:00344401 | Colorectum | SER | lipid oxidation | 29/2897 | 108/18723 | 1.63e-03 | 1.72e-02 | 29 |
| GO:00067901 | Colorectum | SER | sulfur compound metabolic process | 73/2897 | 339/18723 | 1.75e-03 | 1.81e-02 | 73 |
| GO:00160541 | Colorectum | SER | organic acid catabolic process | 53/2897 | 240/18723 | 4.04e-03 | 3.30e-02 | 53 |
| GO:00065201 | Colorectum | SER | cellular amino acid metabolic process | 61/2897 | 284/18723 | 4.20e-03 | 3.41e-02 | 61 |
| GO:00302581 | Colorectum | SER | lipid modification | 47/2897 | 212/18723 | 6.01e-03 | 4.38e-02 | 47 |
| GO:0009166 | Colorectum | SER | nucleotide catabolic process | 20/2897 | 73/18723 | 6.34e-03 | 4.56e-02 | 20 |
| GO:00066311 | Colorectum | SER | fatty acid metabolic process | 79/2897 | 390/18723 | 6.34e-03 | 4.56e-02 | 79 |
| GO:00060912 | Colorectum | MSS | generation of precursor metabolites and energy | 186/3467 | 490/18723 | 1.14e-24 | 2.15e-21 | 186 |
| GO:00487322 | Colorectum | MSS | gland development | 143/3467 | 436/18723 | 3.85e-13 | 8.01e-11 | 143 |
| GO:00061632 | Colorectum | MSS | purine nucleotide metabolic process | 128/3467 | 396/18723 | 2.04e-11 | 3.02e-09 | 128 |
| GO:00091502 | Colorectum | MSS | purine ribonucleotide metabolic process | 121/3467 | 368/18723 | 2.08e-11 | 3.02e-09 | 121 |
| GO:00442702 | Colorectum | MSS | cellular nitrogen compound catabolic process | 141/3467 | 451/18723 | 2.95e-11 | 3.83e-09 | 141 |
| GO:00725212 | Colorectum | MSS | purine-containing compound metabolic process | 132/3467 | 416/18723 | 4.13e-11 | 4.86e-09 | 132 |
| GO:00467002 | Colorectum | MSS | heterocycle catabolic process | 139/3467 | 445/18723 | 4.37e-11 | 5.05e-09 | 139 |
| GO:00346552 | Colorectum | MSS | nucleobase-containing compound catabolic process | 129/3467 | 407/18723 | 7.48e-11 | 8.18e-09 | 129 |
| GO:00092592 | Colorectum | MSS | ribonucleotide metabolic process | 123/3467 | 385/18723 | 1.17e-10 | 1.20e-08 | 123 |
| GO:19013612 | Colorectum | MSS | organic cyclic compound catabolic process | 148/3467 | 495/18723 | 3.47e-10 | 3.18e-08 | 148 |
| GO:00196932 | Colorectum | MSS | ribose phosphate metabolic process | 124/3467 | 396/18723 | 4.11e-10 | 3.49e-08 | 124 |
| Page: 1 2 3 4 5 6 7 8 9 10 11 12 13 14 15 16 17 18 19 20 21 22 23 24 25 26 27 28 |
| Pathway ID | Tissue | Disease Stage | Description | Gene Ratio | Bg Ratio | pvalue | p.adjust | qvalue | Count |
| hsa01200 | Colorectum | AD | Carbon metabolism | 55/2092 | 115/8465 | 5.53e-08 | 8.42e-07 | 5.37e-07 | 55 |
| hsa00620 | Colorectum | AD | Pyruvate metabolism | 28/2092 | 47/8465 | 3.71e-07 | 5.41e-06 | 3.45e-06 | 28 |
| hsa00280 | Colorectum | AD | Valine, leucine and isoleucine degradation | 25/2092 | 48/8465 | 3.97e-05 | 3.41e-04 | 2.18e-04 | 25 |
| hsa00310 | Colorectum | AD | Lysine degradation | 27/2092 | 63/8465 | 1.17e-03 | 7.75e-03 | 4.94e-03 | 27 |
| hsa00071 | Colorectum | AD | Fatty acid degradation | 20/2092 | 43/8465 | 1.50e-03 | 8.69e-03 | 5.54e-03 | 20 |
| hsa00630 | Colorectum | AD | Glyoxylate and dicarboxylate metabolism | 14/2092 | 30/8465 | 7.25e-03 | 2.97e-02 | 1.89e-02 | 14 |
| hsa012001 | Colorectum | AD | Carbon metabolism | 55/2092 | 115/8465 | 5.53e-08 | 8.42e-07 | 5.37e-07 | 55 |
| hsa006201 | Colorectum | AD | Pyruvate metabolism | 28/2092 | 47/8465 | 3.71e-07 | 5.41e-06 | 3.45e-06 | 28 |
| hsa002801 | Colorectum | AD | Valine, leucine and isoleucine degradation | 25/2092 | 48/8465 | 3.97e-05 | 3.41e-04 | 2.18e-04 | 25 |
| hsa003101 | Colorectum | AD | Lysine degradation | 27/2092 | 63/8465 | 1.17e-03 | 7.75e-03 | 4.94e-03 | 27 |
| hsa000711 | Colorectum | AD | Fatty acid degradation | 20/2092 | 43/8465 | 1.50e-03 | 8.69e-03 | 5.54e-03 | 20 |
| hsa006301 | Colorectum | AD | Glyoxylate and dicarboxylate metabolism | 14/2092 | 30/8465 | 7.25e-03 | 2.97e-02 | 1.89e-02 | 14 |
| hsa006202 | Colorectum | SER | Pyruvate metabolism | 22/1580 | 47/8465 | 9.62e-06 | 1.33e-04 | 9.67e-05 | 22 |
| hsa012002 | Colorectum | SER | Carbon metabolism | 40/1580 | 115/8465 | 2.77e-05 | 3.41e-04 | 2.47e-04 | 40 |
| hsa000712 | Colorectum | SER | Fatty acid degradation | 15/1580 | 43/8465 | 8.60e-03 | 4.26e-02 | 3.09e-02 | 15 |
| hsa006203 | Colorectum | SER | Pyruvate metabolism | 22/1580 | 47/8465 | 9.62e-06 | 1.33e-04 | 9.67e-05 | 22 |
| hsa012003 | Colorectum | SER | Carbon metabolism | 40/1580 | 115/8465 | 2.77e-05 | 3.41e-04 | 2.47e-04 | 40 |
| hsa000713 | Colorectum | SER | Fatty acid degradation | 15/1580 | 43/8465 | 8.60e-03 | 4.26e-02 | 3.09e-02 | 15 |
| hsa006204 | Colorectum | MSS | Pyruvate metabolism | 24/1875 | 47/8465 | 1.25e-05 | 1.35e-04 | 8.27e-05 | 24 |
| hsa002802 | Colorectum | MSS | Valine, leucine and isoleucine degradation | 21/1875 | 48/8465 | 6.73e-04 | 4.51e-03 | 2.76e-03 | 21 |
| Page: 1 2 3 4 5 6 |
Top |
Cell-cell communication analysis |
| Identification of potential cell-cell interactions between two cell types and their ligand-receptor pairs for different disease states |
| Ligand | Receptor | LRpair | Pathway | Tissue | Disease Stage |
| Page: 1 |
Top |
Single-cell gene regulatory network inference analysis |
| Find out the significant the regulons (TFs) and the target genes of each regulon across cell types for different disease states |
| TF | Cell Type | Tissue | Disease Stage | Target Gene | RSS | Regulon Activity |
| ∗The dot plots of a searched regulon are shown for all cell subpopulations in each disease state of each tissue based on the regulon specific score inferred using pySCENIC and by calculating the average expression. |
| Page: 1 |
Top |
Somatic mutation of malignant transformation related genes |
| Annotation of somatic variants for genes involved in malignant transformation |
| Hugo Symbol | Variant Class | Variant Classification | dbSNP RS | HGVSc | HGVSp | HGVSp Short | SWISSPROT | BIOTYPE | SIFT | PolyPhen | Tumor Sample Barcode | Tissue | Histology | Sex | Age | Stage | Therapy Types | Drugs | Outcome |
| ACAT1 | SNV | Missense_Mutation | novel | c.906G>T | p.Lys302Asn | p.K302N | P24752 | protein_coding | tolerated(0.12) | benign(0.005) | TCGA-3C-AALI-01 | Breast | breast invasive carcinoma | Female | <65 | I/II | Unspecific | Poly E | Complete Response |
| ACAT1 | SNV | Missense_Mutation | c.1130N>C | p.Asn377Thr | p.N377T | P24752 | protein_coding | tolerated(0.07) | possibly_damaging(0.732) | TCGA-AR-A256-01 | Breast | breast invasive carcinoma | Female | <65 | I/II | Chemotherapy | doxorubicin | PD | |
| ACAT1 | SNV | Missense_Mutation | c.104C>T | p.Ser35Leu | p.S35L | P24752 | protein_coding | tolerated(0.11) | benign(0.007) | TCGA-BH-A18P-01 | Breast | breast invasive carcinoma | Female | <65 | I/II | Unknown | Unknown | PD | |
| ACAT1 | insertion | Frame_Shift_Ins | novel | c.636_637insTGCAGCCTCCGCCTCCTGG | p.Ala213CysfsTer11 | p.A213Cfs*11 | P24752 | protein_coding | TCGA-A8-A09Z-01 | Breast | breast invasive carcinoma | Female | >=65 | I/II | Unknown | Unknown | SD | ||
| ACAT1 | SNV | Missense_Mutation | c.1069N>T | p.Ser357Cys | p.S357C | P24752 | protein_coding | deleterious(0) | probably_damaging(0.998) | TCGA-FU-A3HZ-01 | Cervix | cervical & endocervical cancer | Female | <65 | I/II | Chemotherapy | cisplatin | CR | |
| ACAT1 | SNV | Missense_Mutation | novel | c.526N>C | p.Glu176Gln | p.E176Q | P24752 | protein_coding | tolerated(0.52) | benign(0.029) | TCGA-HM-A4S6-01 | Cervix | cervical & endocervical cancer | Female | <65 | III/IV | Chemotherapy | cisplatin | CR |
| ACAT1 | SNV | Missense_Mutation | novel | c.1250N>A | p.Gly417Glu | p.G417E | P24752 | protein_coding | deleterious(0) | probably_damaging(1) | TCGA-HM-A4S6-01 | Cervix | cervical & endocervical cancer | Female | <65 | III/IV | Chemotherapy | cisplatin | CR |
| ACAT1 | SNV | Missense_Mutation | rs777462355 | c.1247N>A | p.Gly416Glu | p.G416E | P24752 | protein_coding | deleterious(0) | probably_damaging(1) | TCGA-JW-A5VL-01 | Cervix | cervical & endocervical cancer | Female | <65 | I/II | Unknown | Unknown | SD |
| ACAT1 | SNV | Missense_Mutation | rs768448235 | c.1142N>C | p.Val381Ala | p.V381A | P24752 | protein_coding | deleterious(0) | probably_damaging(0.998) | TCGA-AA-3672-01 | Colorectum | colon adenocarcinoma | Female | >=65 | III/IV | Unknown | Unknown | SD |
| ACAT1 | SNV | Missense_Mutation | rs370720208 | c.623N>A | p.Arg208Gln | p.R208Q | P24752 | protein_coding | deleterious(0) | probably_damaging(0.991) | TCGA-CA-6717-01 | Colorectum | colon adenocarcinoma | Male | <65 | I/II | Chemotherapy | oxaliplatin | CR |
| Page: 1 2 3 4 5 |
Top |
Related drugs of malignant transformation related genes |
| Identification of chemicals and drugs interact with genes involved in malignant transfromation |
| (DGIdb 4.0) |
| Entrez ID | Symbol | Category | Interaction Types | Drug Claim Name | Drug Name | PMIDs |
| 38 | ACAT1 | ENZYME | SULFASALAZINE | SULFASALAZINE | ||
| 38 | ACAT1 | ENZYME | PMID25470667-Compound-K-604 | |||
| 38 | ACAT1 | ENZYME | ATR-01 | |||
| 38 | ACAT1 | ENZYME | inhibitor | 381118860 | ||
| 38 | ACAT1 | ENZYME | SULFASALAZINE | SULFASALAZINE |
| Page: 1 |

Copyright 2023-Present -The University of Texas Health Science Center at Houston |