| Tissue | Expression Dynamics | Abbreviation |
| Breast | 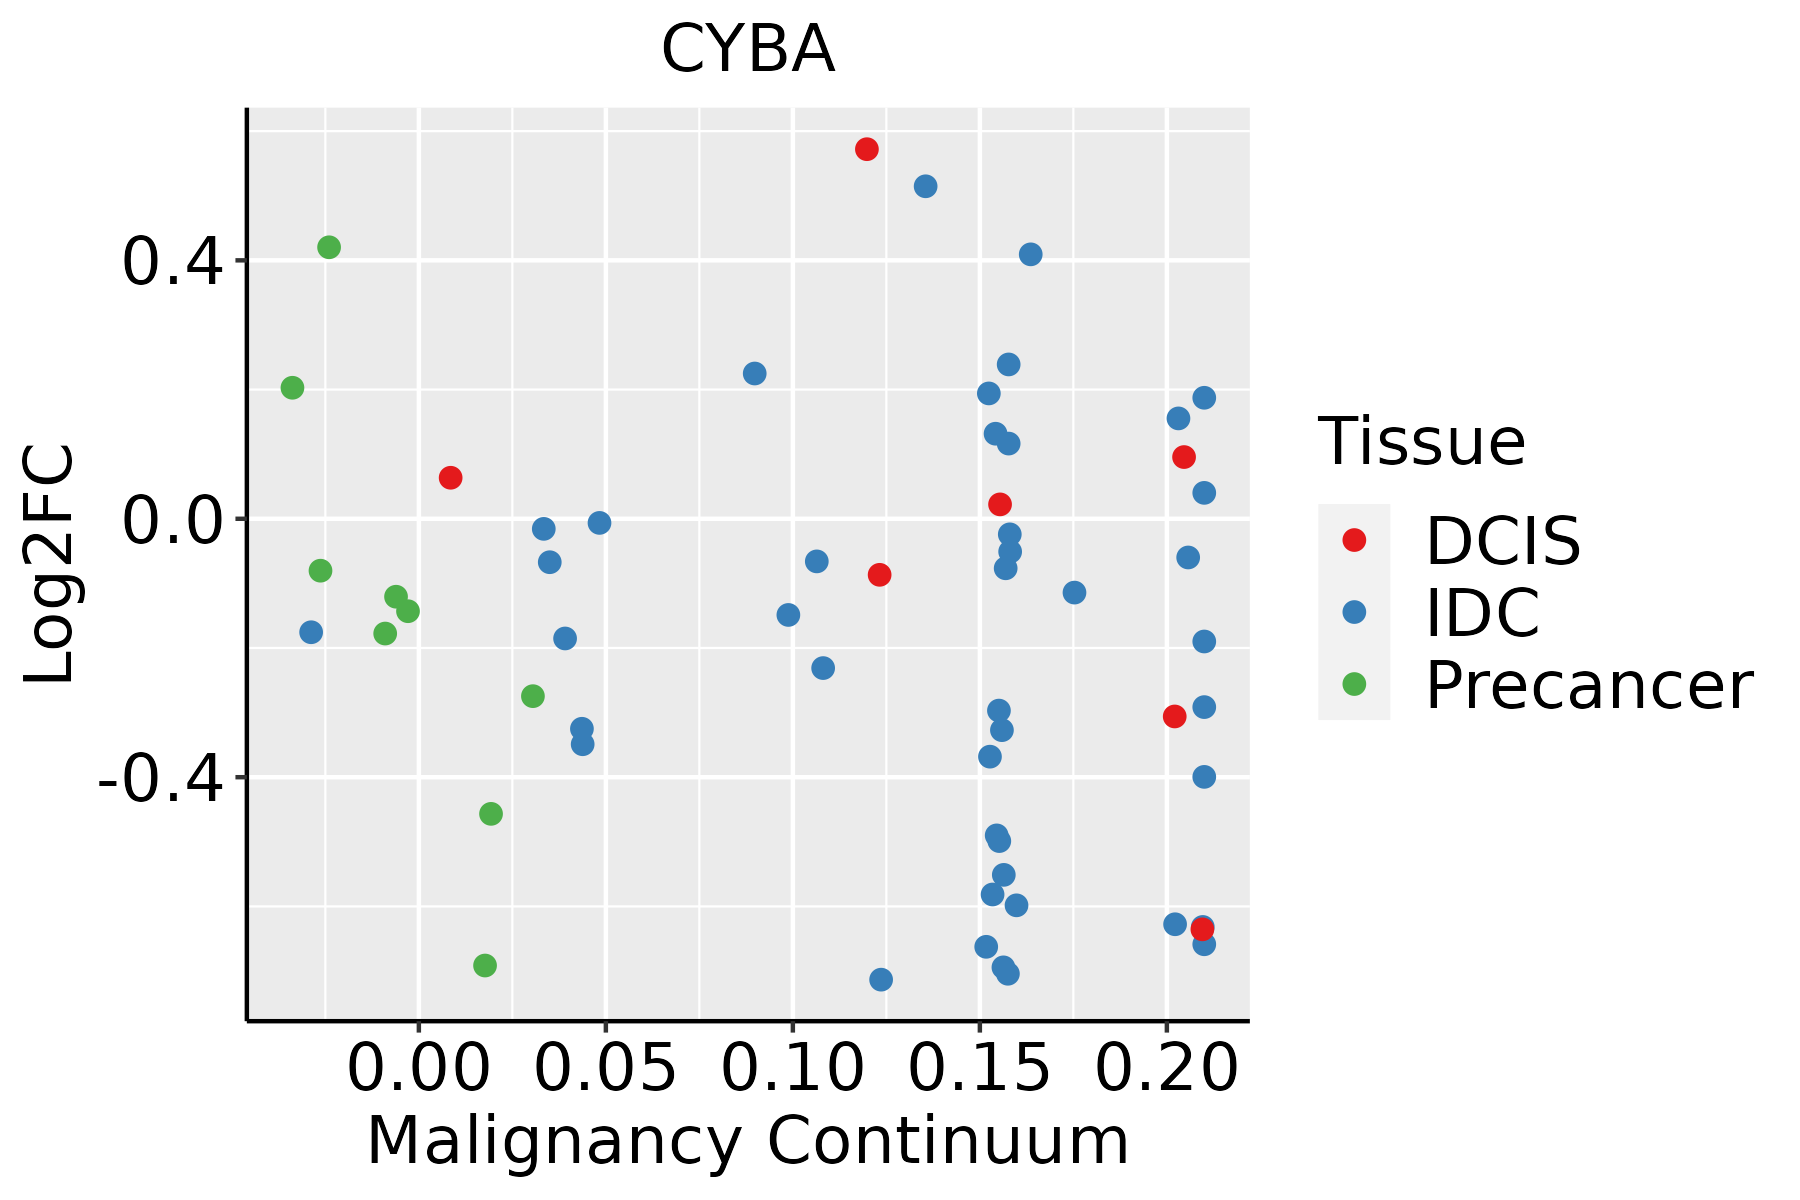 | IDC: Invasive ductal carcinoma |
| DCIS: Ductal carcinoma in situ |
| Precancer(BRCA1-mut): Precancerous lesion from BRCA1 mutation carriers |
| Cervix | 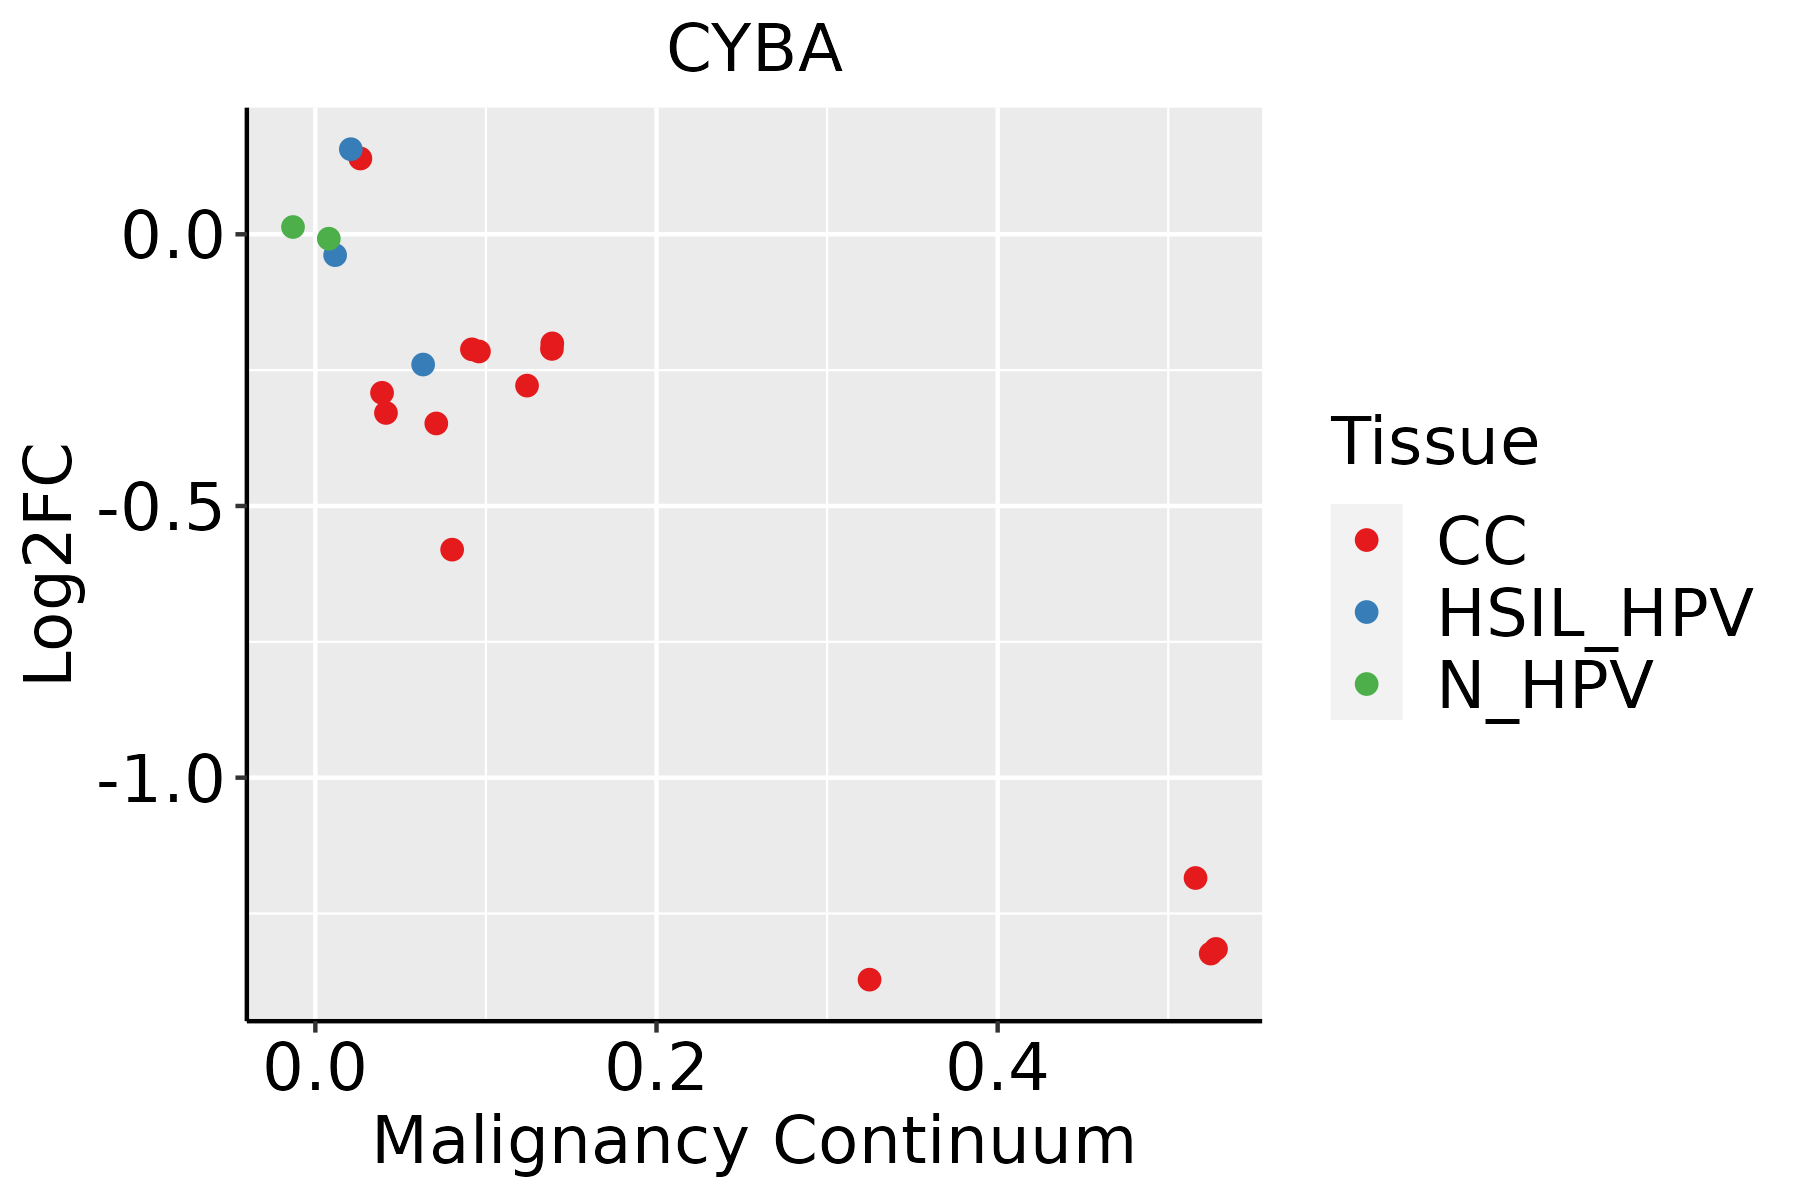 | CC: Cervix cancer |
| HSIL_HPV: HPV-infected high-grade squamous intraepithelial lesions |
| N_HPV: HPV-infected normal cervix |
| Colorectum (GSE201348) |  | FAP: Familial adenomatous polyposis |
| CRC: Colorectal cancer |
| Colorectum (HTA11) |  | AD: Adenomas |
| SER: Sessile serrated lesions |
| MSI-H: Microsatellite-high colorectal cancer |
| MSS: Microsatellite stable colorectal cancer |
| Endometrium | 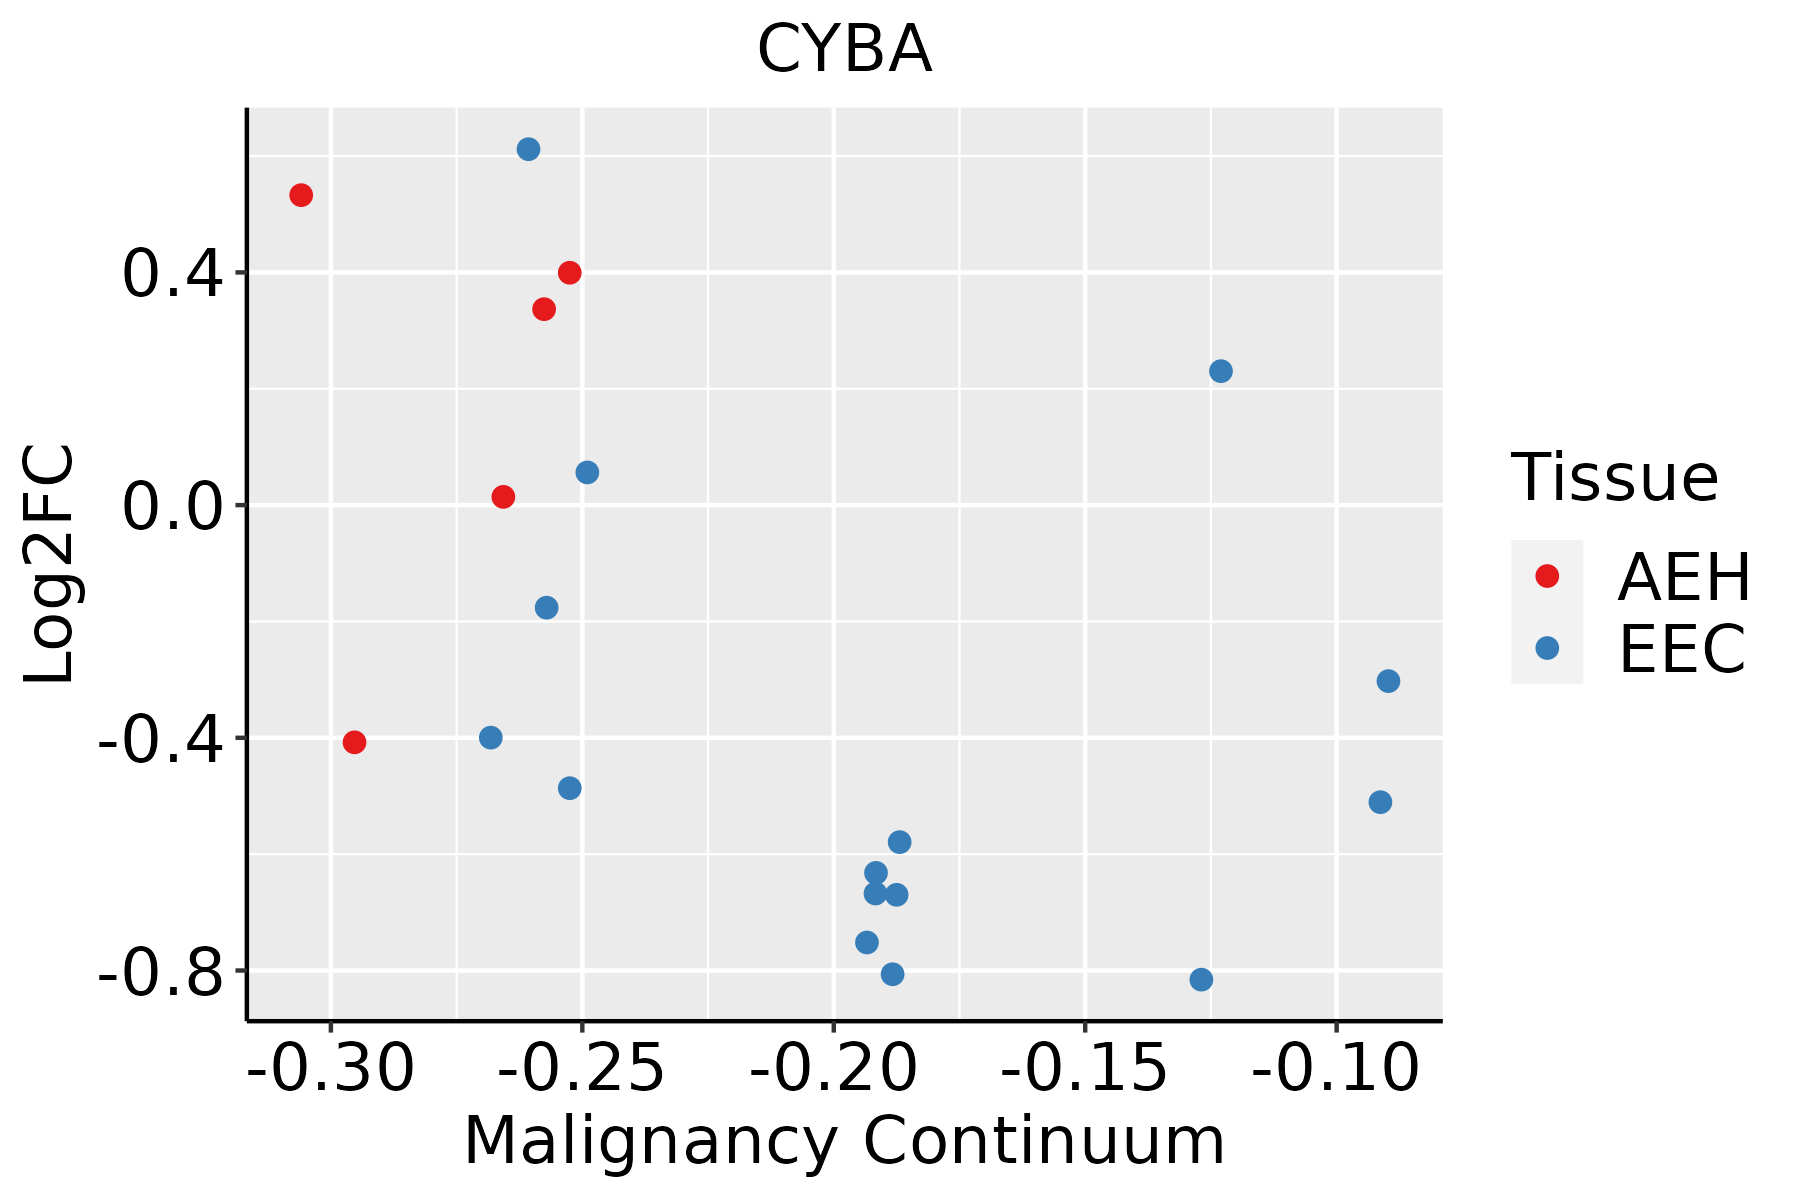 | AEH: Atypical endometrial hyperplasia |
| EEC: Endometrioid Cancer |
| Esophagus | 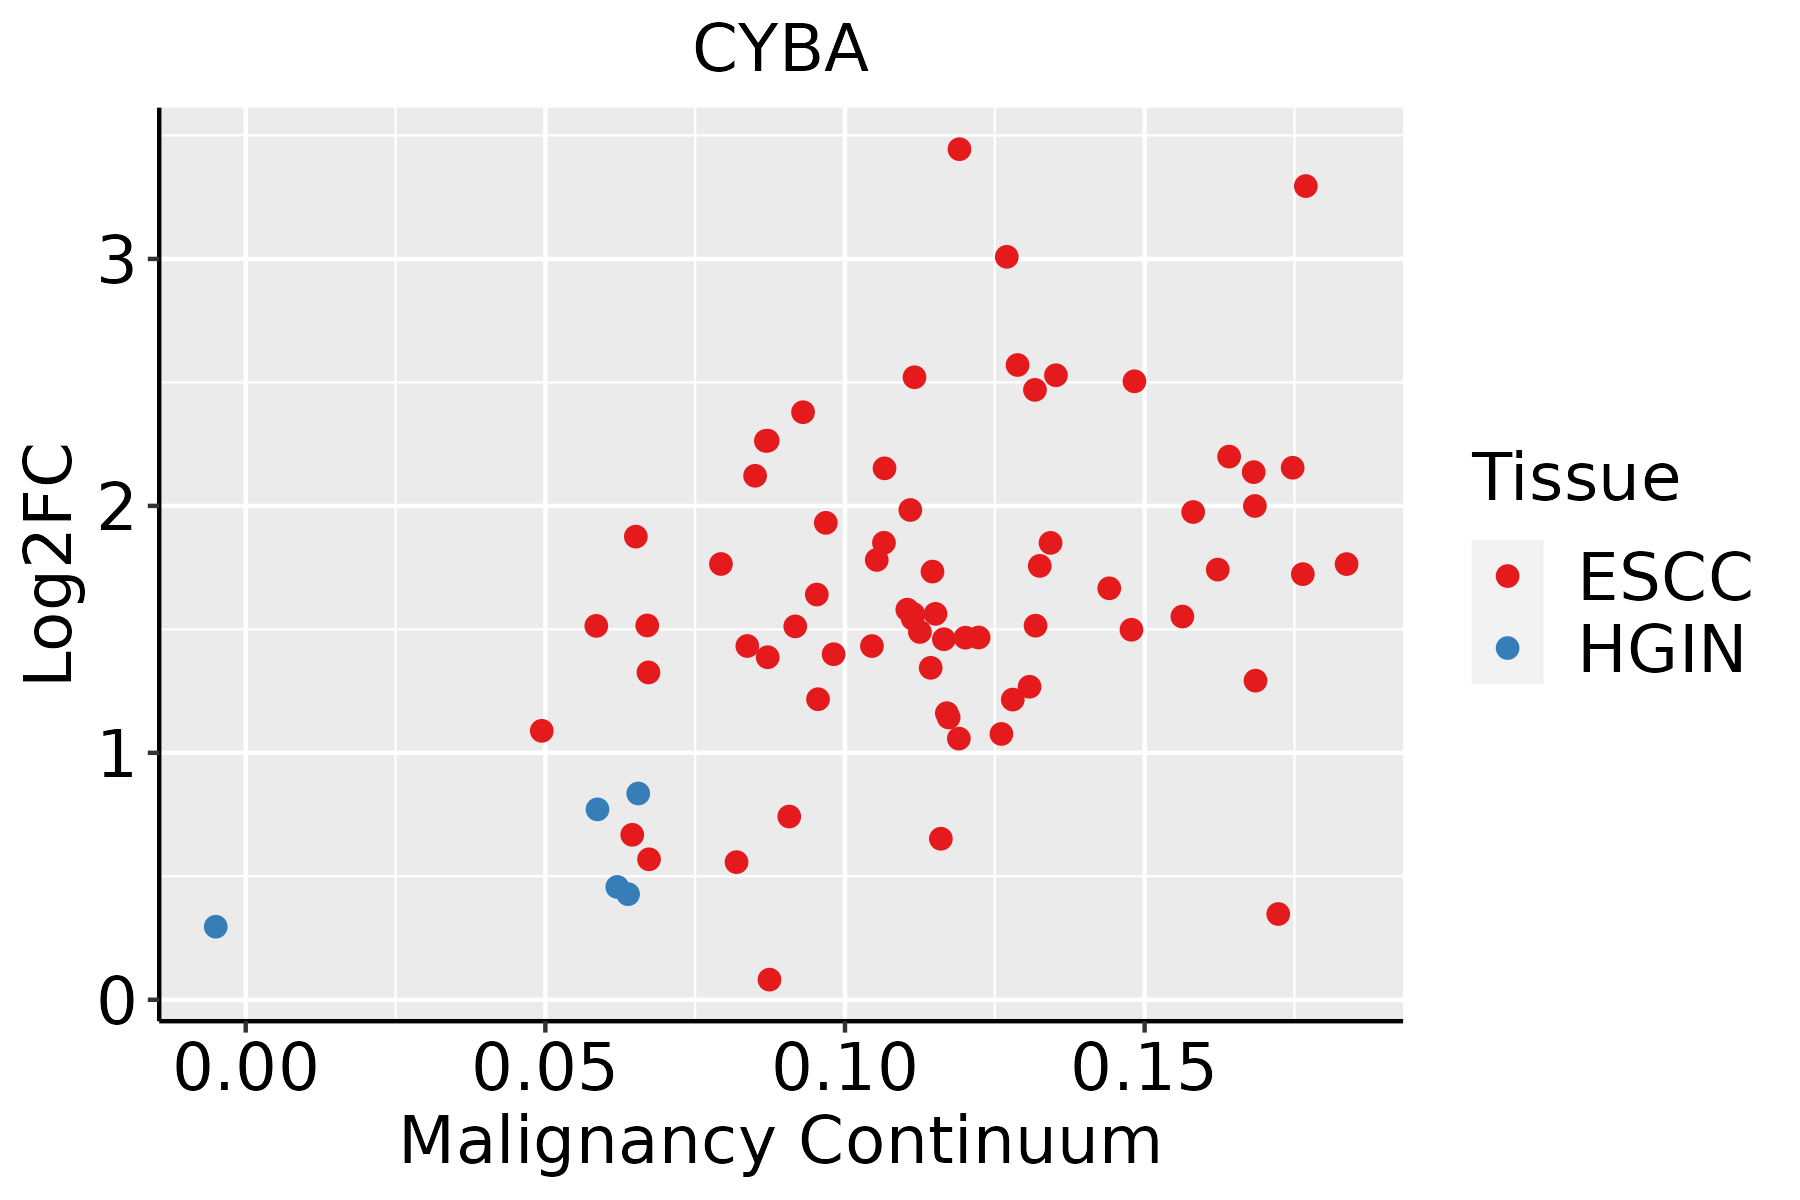 | ESCC: Esophageal squamous cell carcinoma |
| HGIN: High-grade intraepithelial neoplasias |
| LGIN: Low-grade intraepithelial neoplasias |
| GC | 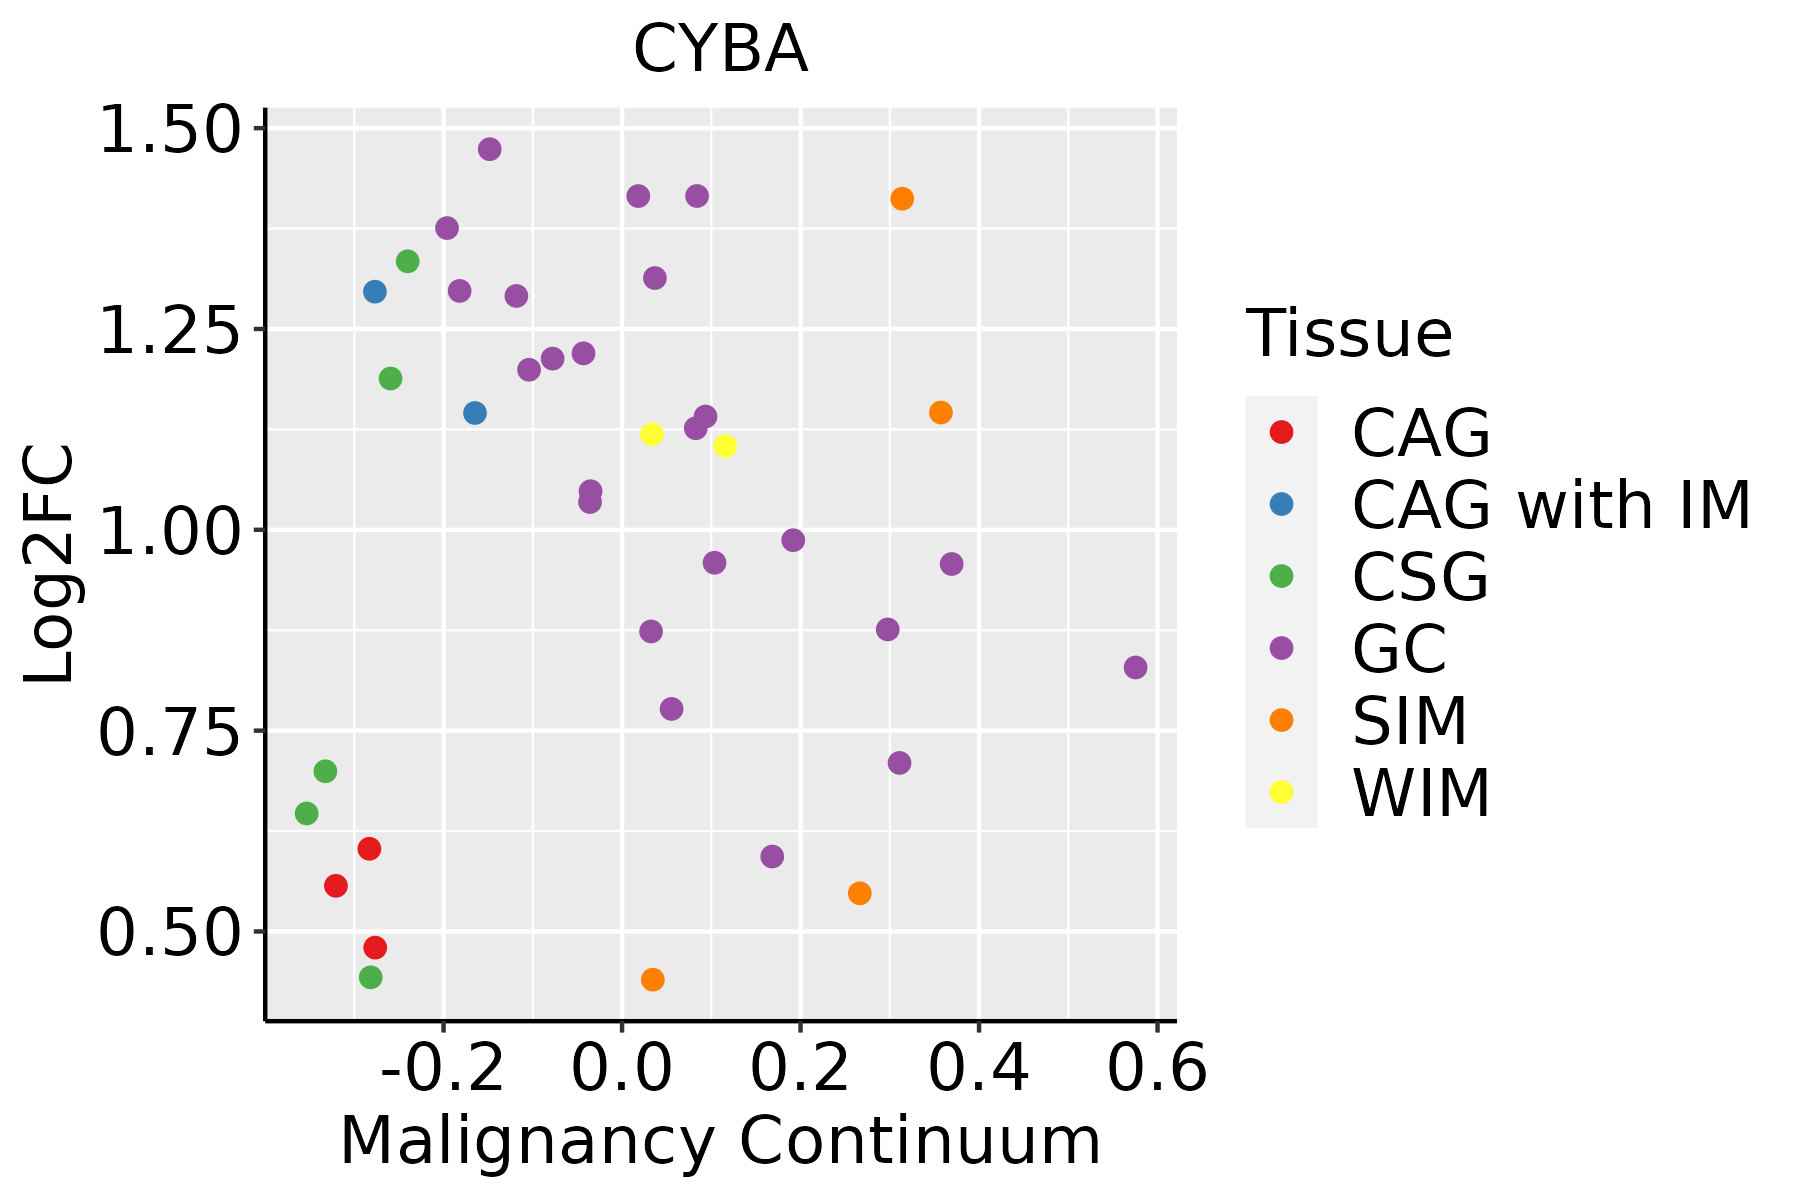 | CAG: Chronic atrophic gastritis |
| CAG with IM: Chronic atrophic gastritis with intestinal metaplasia |
| CSG: Chronic superficial gastritis |
| GC: Gastric cancer |
| SIM: Severe intestinal metaplasia |
| WIM: Wild intestinal metaplasia |
| Liver | 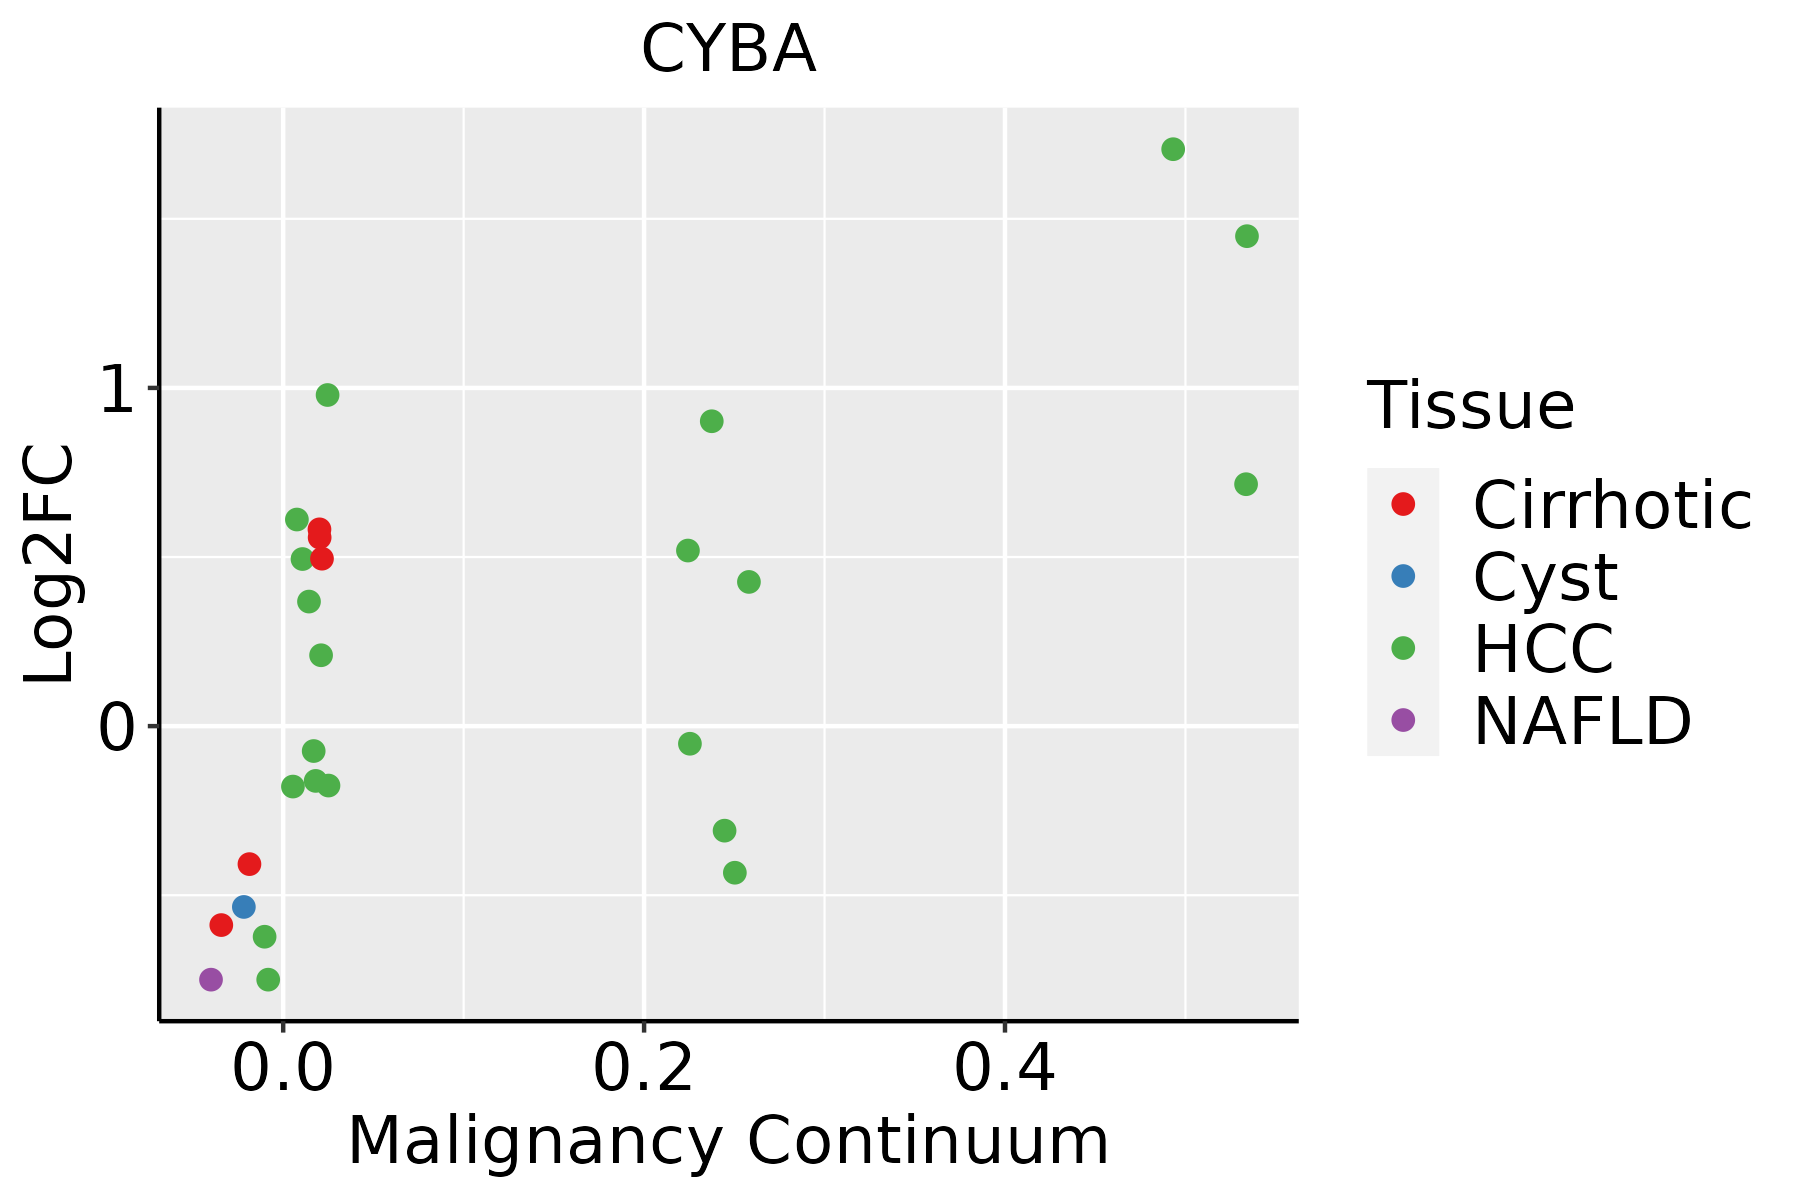 | HCC: Hepatocellular carcinoma |
| NAFLD: Non-alcoholic fatty liver disease |
| Lung | 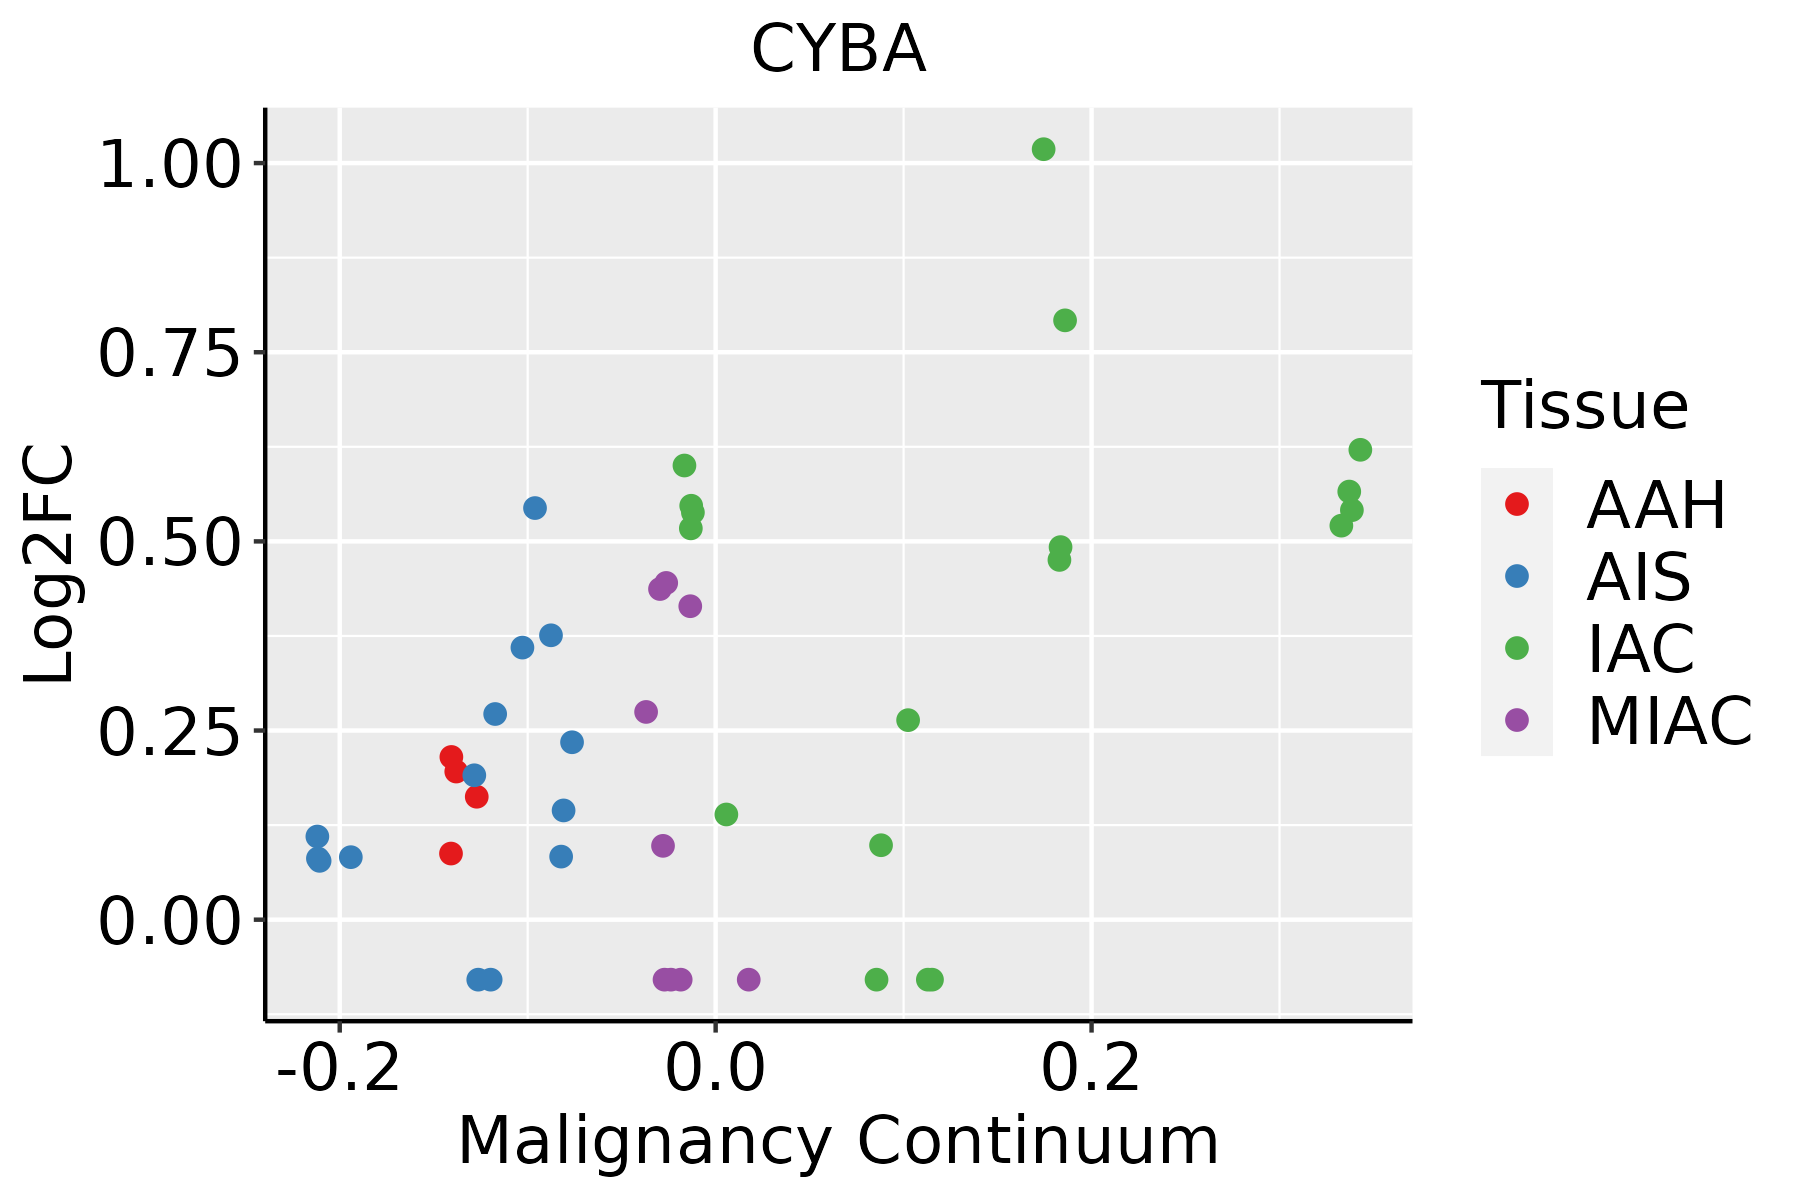 | AAH: Atypical adenomatous hyperplasia |
| AIS: Adenocarcinoma in situ |
| IAC: Invasive lung adenocarcinoma |
| MIA: Minimally invasive adenocarcinoma |
| Oral Cavity | 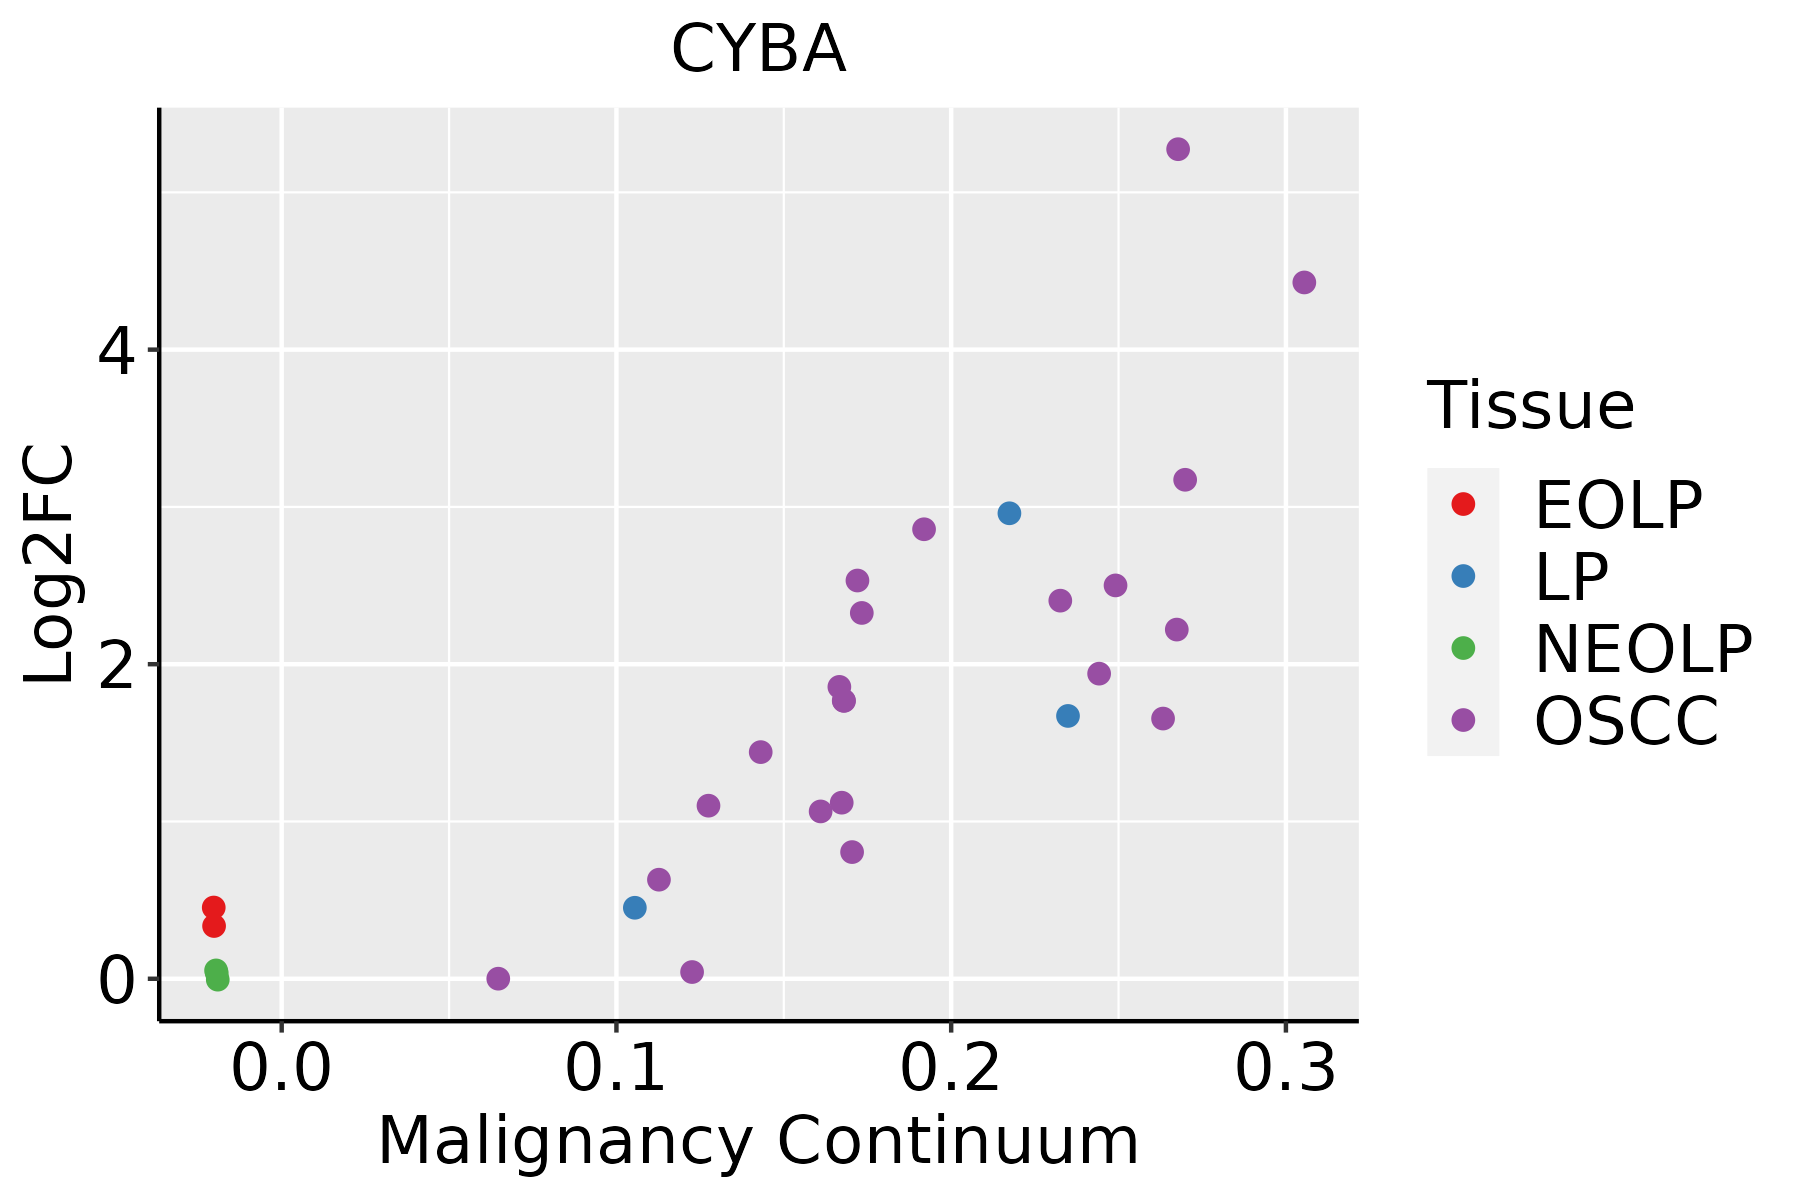 | EOLP: Erosive Oral lichen planus |
| LP: leukoplakia |
| NEOLP: Non-erosive oral lichen planus |
| OSCC: Oral squamous cell carcinoma |
| Prostate | 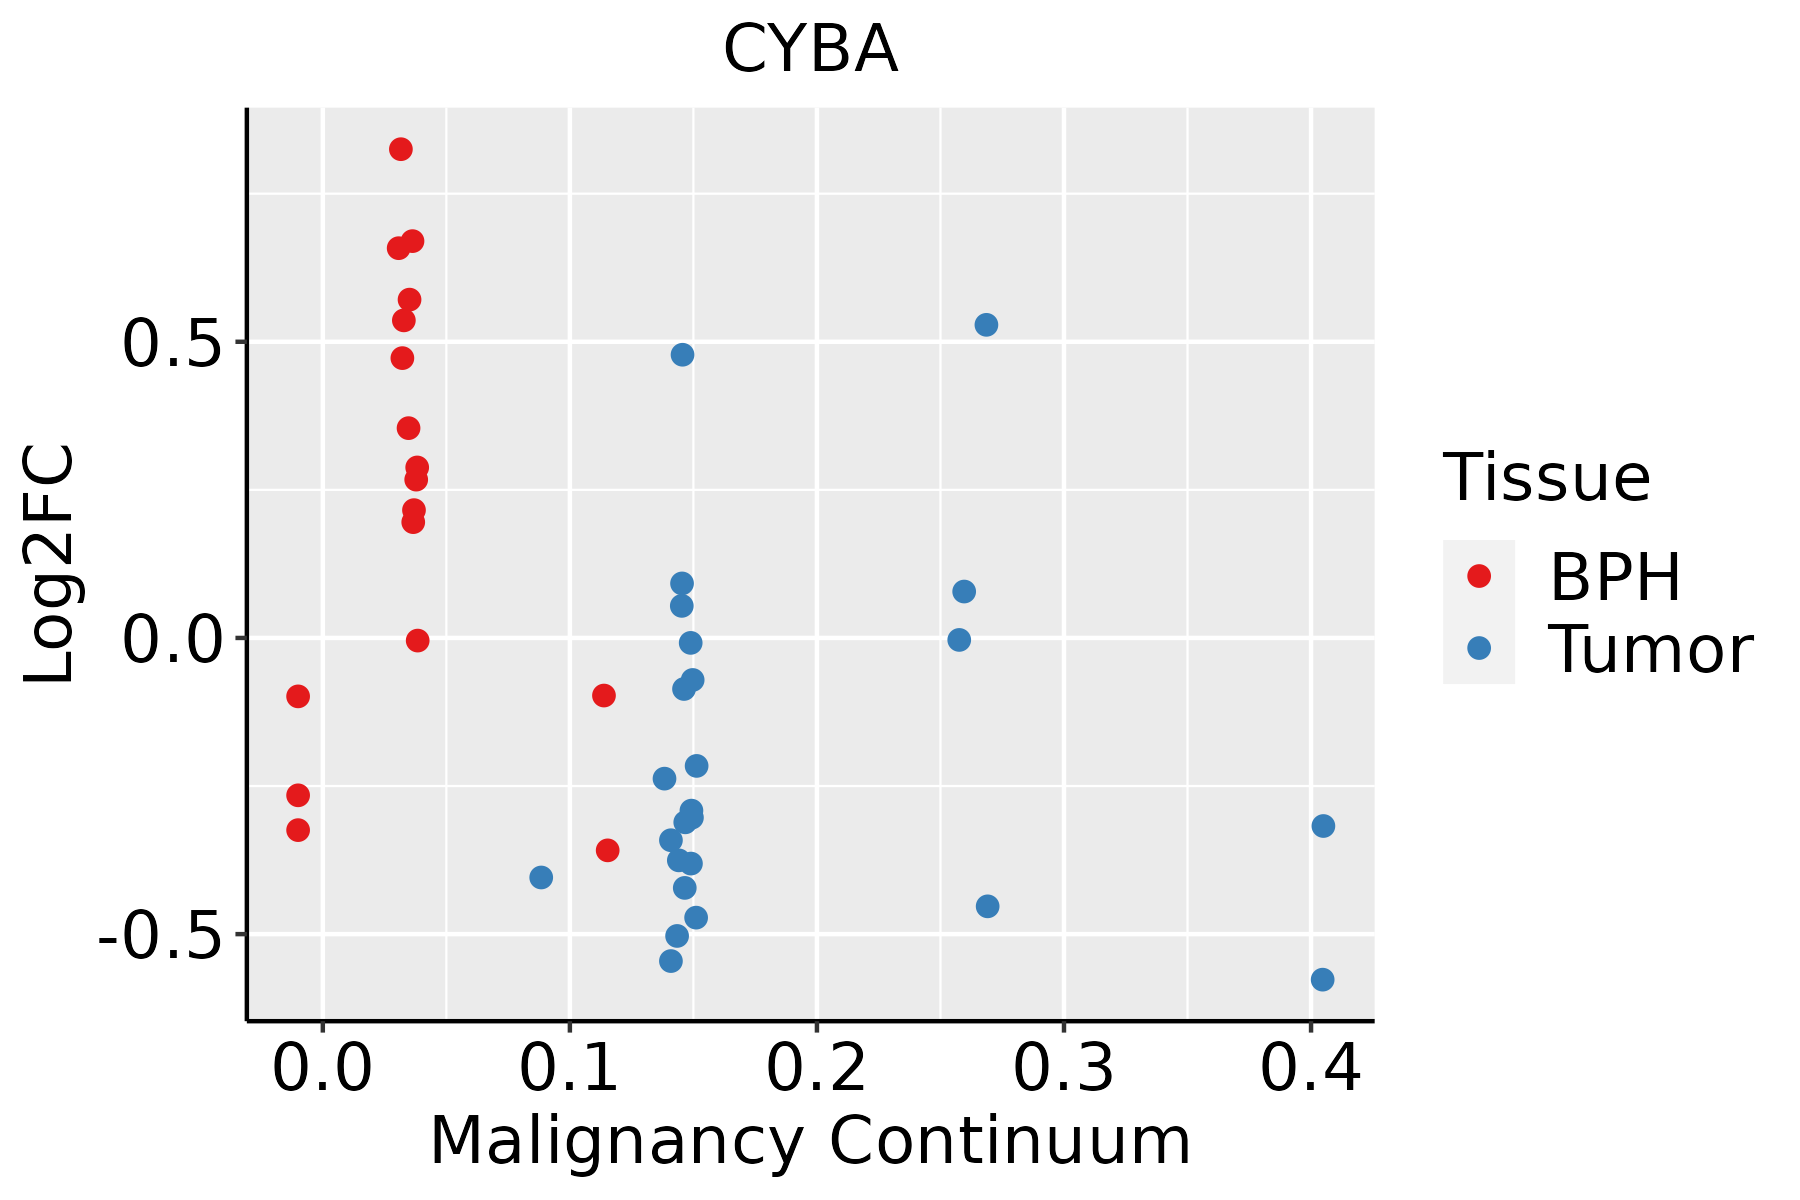 | BPH: Benign Prostatic Hyperplasia |
| Skin | 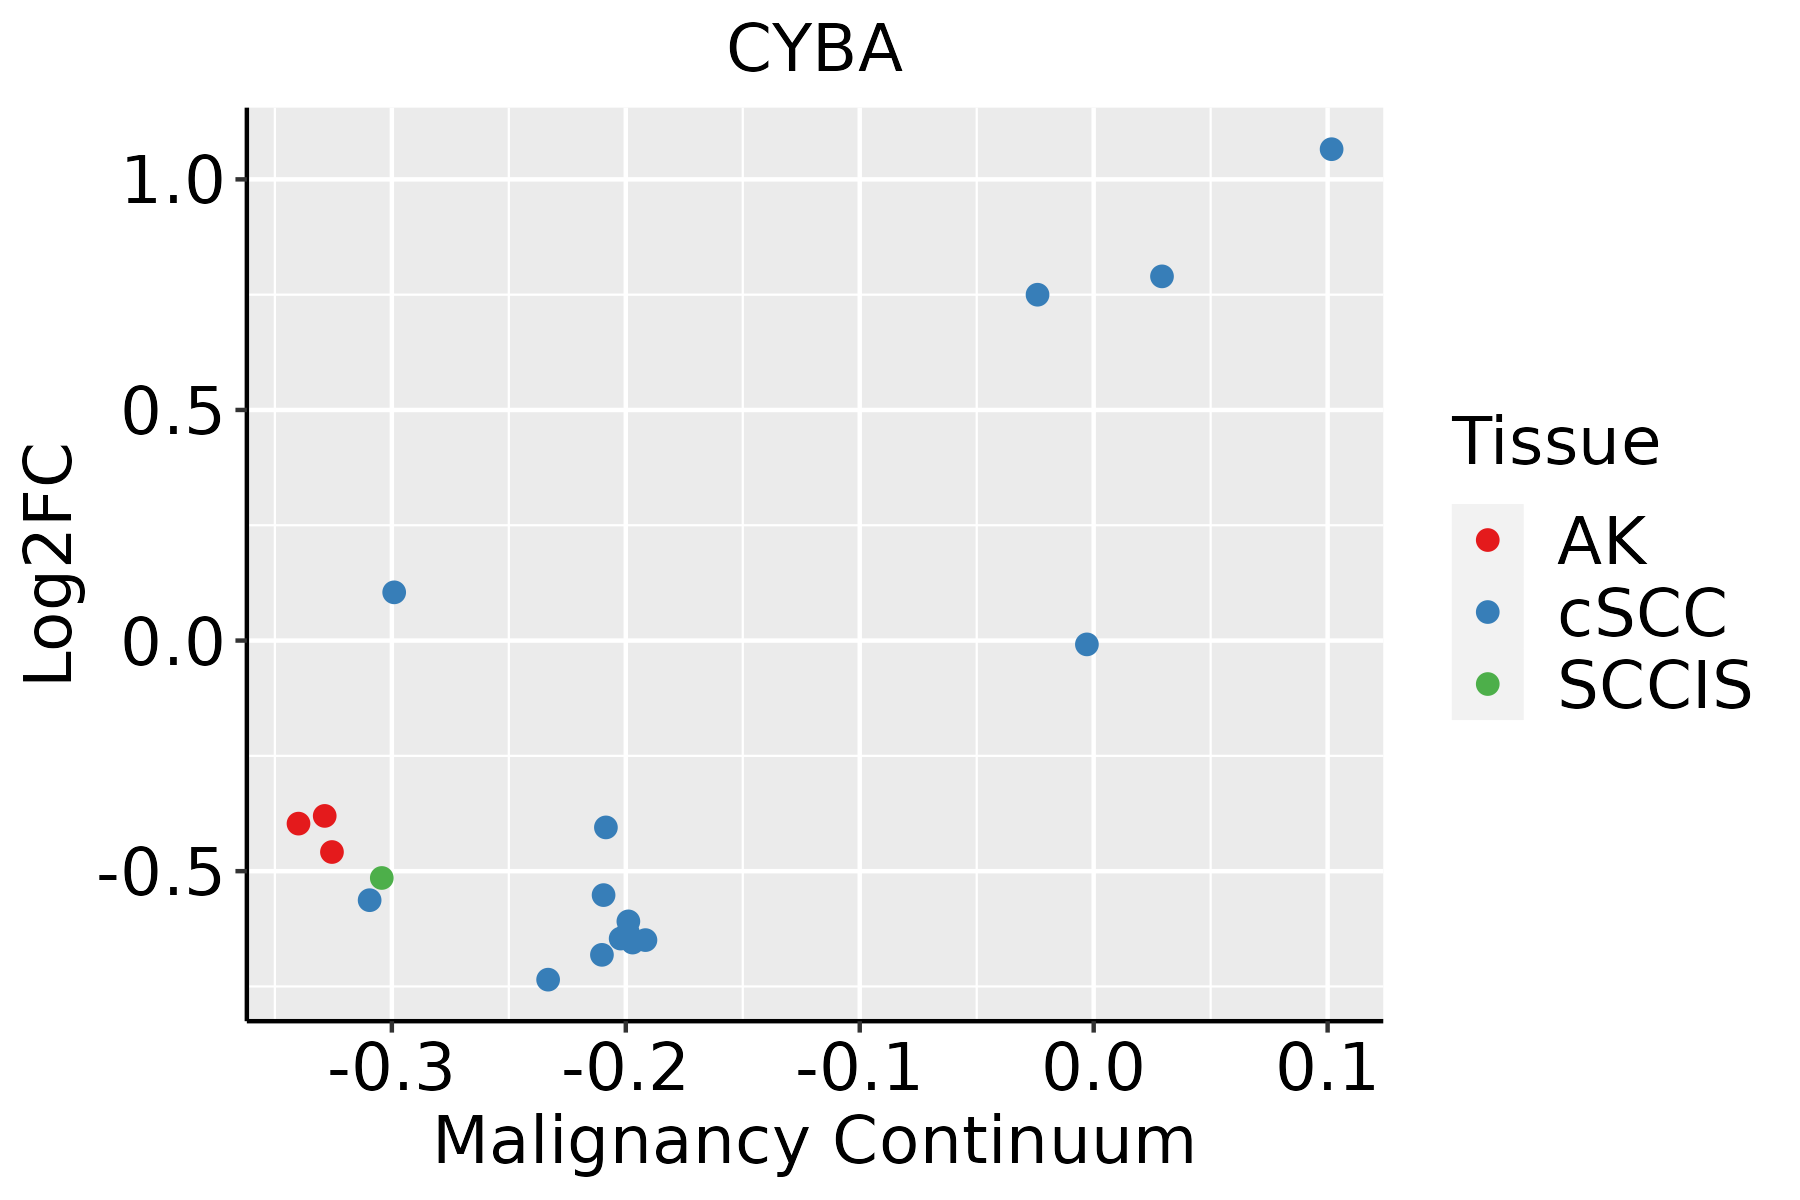 | AK: Actinic keratosis |
| cSCC: Cutaneous squamous cell carcinoma |
| SCCIS:squamous cell carcinoma in situ |
| Thyroid |  | ATC: Anaplastic thyroid cancer |
| HT: Hashimoto's thyroiditis |
| PTC: Papillary thyroid cancer |
| GO ID | Tissue | Disease Stage | Description | Gene Ratio | Bg Ratio | pvalue | p.adjust | Count |
| GO:007135618 | Oral cavity | OSCC | cellular response to tumor necrosis factor | 128/7305 | 229/18723 | 1.49e-07 | 2.49e-06 | 128 |
| GO:200037716 | Oral cavity | OSCC | regulation of reactive oxygen species metabolic process | 92/7305 | 157/18723 | 4.96e-07 | 7.27e-06 | 92 |
| GO:007147917 | Oral cavity | OSCC | cellular response to ionizing radiation | 49/7305 | 72/18723 | 5.59e-07 | 8.13e-06 | 49 |
| GO:007137510 | Oral cavity | OSCC | cellular response to peptide hormone stimulus | 153/7305 | 290/18723 | 1.23e-06 | 1.63e-05 | 153 |
| GO:004343419 | Oral cavity | OSCC | response to peptide hormone | 208/7305 | 414/18723 | 1.83e-06 | 2.35e-05 | 208 |
| GO:00712605 | Oral cavity | OSCC | cellular response to mechanical stimulus | 52/7305 | 81/18723 | 3.86e-06 | 4.55e-05 | 52 |
| GO:00022214 | Oral cavity | OSCC | pattern recognition receptor signaling pathway | 95/7305 | 172/18723 | 1.11e-05 | 1.15e-04 | 95 |
| GO:00303079 | Oral cavity | OSCC | positive regulation of cell growth | 92/7305 | 166/18723 | 1.27e-05 | 1.29e-04 | 92 |
| GO:000961210 | Oral cavity | OSCC | response to mechanical stimulus | 115/7305 | 216/18723 | 1.43e-05 | 1.44e-04 | 115 |
| GO:005067310 | Oral cavity | OSCC | epithelial cell proliferation | 212/7305 | 437/18723 | 2.82e-05 | 2.61e-04 | 212 |
| GO:000941018 | Oral cavity | OSCC | response to xenobiotic stimulus | 222/7305 | 462/18723 | 4.00e-05 | 3.48e-04 | 222 |
| GO:007259316 | Oral cavity | OSCC | reactive oxygen species metabolic process | 122/7305 | 239/18723 | 9.73e-05 | 7.34e-04 | 122 |
| GO:000974320 | Oral cavity | OSCC | response to carbohydrate | 128/7305 | 253/18723 | 1.11e-04 | 8.16e-04 | 128 |
| GO:00103326 | Oral cavity | OSCC | response to gamma radiation | 36/7305 | 56/18723 | 1.12e-04 | 8.24e-04 | 36 |
| GO:00011019 | Oral cavity | OSCC | response to acid chemical | 74/7305 | 135/18723 | 1.38e-04 | 9.76e-04 | 74 |
| GO:00321037 | Oral cavity | OSCC | positive regulation of response to external stimulus | 203/7305 | 427/18723 | 1.79e-04 | 1.22e-03 | 203 |
| GO:009730519 | Oral cavity | OSCC | response to alcohol | 127/7305 | 253/18723 | 1.81e-04 | 1.24e-03 | 127 |
| GO:003428420 | Oral cavity | OSCC | response to monosaccharide | 114/7305 | 225/18723 | 2.37e-04 | 1.54e-03 | 114 |
| GO:00432006 | Oral cavity | OSCC | response to amino acid | 64/7305 | 116/18723 | 2.96e-04 | 1.86e-03 | 64 |
| GO:00712304 | Oral cavity | OSCC | cellular response to amino acid stimulus | 42/7305 | 71/18723 | 4.59e-04 | 2.76e-03 | 42 |
| Pathway ID | Tissue | Disease Stage | Description | Gene Ratio | Bg Ratio | pvalue | p.adjust | qvalue | Count |
| hsa0502016 | Breast | Precancer | Prion disease | 95/684 | 273/8465 | 1.39e-37 | 1.46e-35 | 1.12e-35 | 95 |
| hsa0520818 | Breast | Precancer | Chemical carcinogenesis - reactive oxygen species | 68/684 | 223/8465 | 3.61e-23 | 1.14e-21 | 8.73e-22 | 68 |
| hsa0541518 | Breast | Precancer | Diabetic cardiomyopathy | 63/684 | 203/8465 | 5.63e-22 | 1.48e-20 | 1.14e-20 | 63 |
| hsa0541818 | Breast | Precancer | Fluid shear stress and atherosclerosis | 28/684 | 139/8465 | 4.74e-06 | 6.00e-05 | 4.59e-05 | 28 |
| hsa0541718 | Breast | Precancer | Lipid and atherosclerosis | 37/684 | 215/8465 | 7.64e-06 | 9.29e-05 | 7.12e-05 | 37 |
| hsa0414518 | Breast | Precancer | Phagosome | 27/684 | 152/8465 | 7.37e-05 | 6.85e-04 | 5.25e-04 | 27 |
| hsa0467018 | Breast | Precancer | Leukocyte transendothelial migration | 20/684 | 114/8465 | 7.26e-04 | 5.33e-03 | 4.09e-03 | 20 |
| hsa0502017 | Breast | Precancer | Prion disease | 95/684 | 273/8465 | 1.39e-37 | 1.46e-35 | 1.12e-35 | 95 |
| hsa0520819 | Breast | Precancer | Chemical carcinogenesis - reactive oxygen species | 68/684 | 223/8465 | 3.61e-23 | 1.14e-21 | 8.73e-22 | 68 |
| hsa0541519 | Breast | Precancer | Diabetic cardiomyopathy | 63/684 | 203/8465 | 5.63e-22 | 1.48e-20 | 1.14e-20 | 63 |
| hsa0541819 | Breast | Precancer | Fluid shear stress and atherosclerosis | 28/684 | 139/8465 | 4.74e-06 | 6.00e-05 | 4.59e-05 | 28 |
| hsa0541719 | Breast | Precancer | Lipid and atherosclerosis | 37/684 | 215/8465 | 7.64e-06 | 9.29e-05 | 7.12e-05 | 37 |
| hsa0414519 | Breast | Precancer | Phagosome | 27/684 | 152/8465 | 7.37e-05 | 6.85e-04 | 5.25e-04 | 27 |
| hsa0467019 | Breast | Precancer | Leukocyte transendothelial migration | 20/684 | 114/8465 | 7.26e-04 | 5.33e-03 | 4.09e-03 | 20 |
| hsa0502023 | Breast | IDC | Prion disease | 102/867 | 273/8465 | 3.70e-34 | 4.01e-32 | 3.00e-32 | 102 |
| hsa0520824 | Breast | IDC | Chemical carcinogenesis - reactive oxygen species | 71/867 | 223/8465 | 2.55e-19 | 7.53e-18 | 5.63e-18 | 71 |
| hsa0541523 | Breast | IDC | Diabetic cardiomyopathy | 67/867 | 203/8465 | 3.17e-19 | 8.59e-18 | 6.43e-18 | 67 |
| hsa0541824 | Breast | IDC | Fluid shear stress and atherosclerosis | 34/867 | 139/8465 | 9.41e-07 | 1.61e-05 | 1.20e-05 | 34 |
| hsa0414522 | Breast | IDC | Phagosome | 34/867 | 152/8465 | 8.00e-06 | 9.99e-05 | 7.48e-05 | 34 |
| hsa0541724 | Breast | IDC | Lipid and atherosclerosis | 35/867 | 215/8465 | 3.67e-03 | 2.29e-02 | 1.71e-02 | 35 |
| Hugo Symbol | Variant Class | Variant Classification | dbSNP RS | HGVSc | HGVSp | HGVSp Short | SWISSPROT | BIOTYPE | SIFT | PolyPhen | Tumor Sample Barcode | Tissue | Histology | Sex | Age | Stage | Therapy Types | Drugs | Outcome |
| CYBA | SNV | Missense_Mutation | novel | c.316G>C | p.Ala106Pro | p.A106P | P13498 | protein_coding | tolerated(0.57) | probably_damaging(0.974) | TCGA-WS-AB45-01 | Colorectum | colon adenocarcinoma | Female | <65 | I/II | Unknown | Unknown | SD |
| CYBA | SNV | Missense_Mutation | rs201755210 | c.293N>T | p.Ser98Leu | p.S98L | P13498 | protein_coding | deleterious(0.05) | benign(0.137) | TCGA-A5-A1OF-01 | Endometrium | uterine corpus endometrioid carcinoma | Female | <65 | I/II | Unknown | Unknown | SD |
| CYBA | SNV | Missense_Mutation | rs776963412 | c.134N>T | p.Ala45Val | p.A45V | P13498 | protein_coding | tolerated(0.22) | probably_damaging(0.996) | TCGA-AJ-A3OJ-01 | Endometrium | uterine corpus endometrioid carcinoma | Female | <65 | I/II | Chemotherapy | carboplatin | CR |
| CYBA | SNV | Missense_Mutation | rs776963412 | c.134N>T | p.Ala45Val | p.A45V | P13498 | protein_coding | tolerated(0.22) | probably_damaging(0.996) | TCGA-AP-A059-01 | Endometrium | uterine corpus endometrioid carcinoma | Female | >=65 | I/II | Unknown | Unknown | SD |
| CYBA | SNV | Missense_Mutation | rs776963412 | c.134N>T | p.Ala45Val | p.A45V | P13498 | protein_coding | tolerated(0.22) | probably_damaging(0.996) | TCGA-B5-A0JV-01 | Endometrium | uterine corpus endometrioid carcinoma | Female | <65 | I/II | Unknown | Unknown | PD |
| CYBA | SNV | Missense_Mutation | rs13306293 | c.223N>A | p.Ala75Thr | p.A75T | P13498 | protein_coding | tolerated(0.58) | benign(0.003) | TCGA-B5-A11E-01 | Endometrium | uterine corpus endometrioid carcinoma | Female | <65 | I/II | Unknown | Unknown | SD |
| CYBA | SNV | Missense_Mutation | rs179363892 | c.268C>T | p.Arg90Trp | p.R90W | P13498 | protein_coding | deleterious(0) | probably_damaging(0.998) | TCGA-D1-A103-01 | Endometrium | uterine corpus endometrioid carcinoma | Female | >=65 | I/II | Unknown | Unknown | SD |
| CYBA | SNV | Missense_Mutation | novel | c.355G>A | p.Gly119Ser | p.G119S | P13498 | protein_coding | tolerated(0.41) | benign(0.007) | TCGA-FI-A2D5-01 | Endometrium | uterine corpus endometrioid carcinoma | Female | <65 | III/IV | Chemotherapy | carboplatinum | PD |
| CYBA | SNV | Missense_Mutation | novel | c.200N>A | p.Arg67His | p.R67H | P13498 | protein_coding | deleterious(0) | probably_damaging(0.998) | TCGA-DD-AACF-01 | Liver | liver hepatocellular carcinoma | Male | >=65 | I/II | Unknown | Unknown | PD |
| CYBA | SNV | Missense_Mutation | rs755658845 | c.163C>T | p.Pro55Ser | p.P55S | P13498 | protein_coding | tolerated(0.1) | probably_damaging(0.999) | TCGA-56-8628-01 | Lung | lung squamous cell carcinoma | Male | >=65 | I/II | Unknown | Unknown | SD |


