| Tissue | Expression Dynamics | Abbreviation |
| Colorectum (GSE201348) |  | FAP: Familial adenomatous polyposis |
| CRC: Colorectal cancer |
| Colorectum (HTA11) |  | AD: Adenomas |
| SER: Sessile serrated lesions |
| MSI-H: Microsatellite-high colorectal cancer |
| MSS: Microsatellite stable colorectal cancer |
| Esophagus | 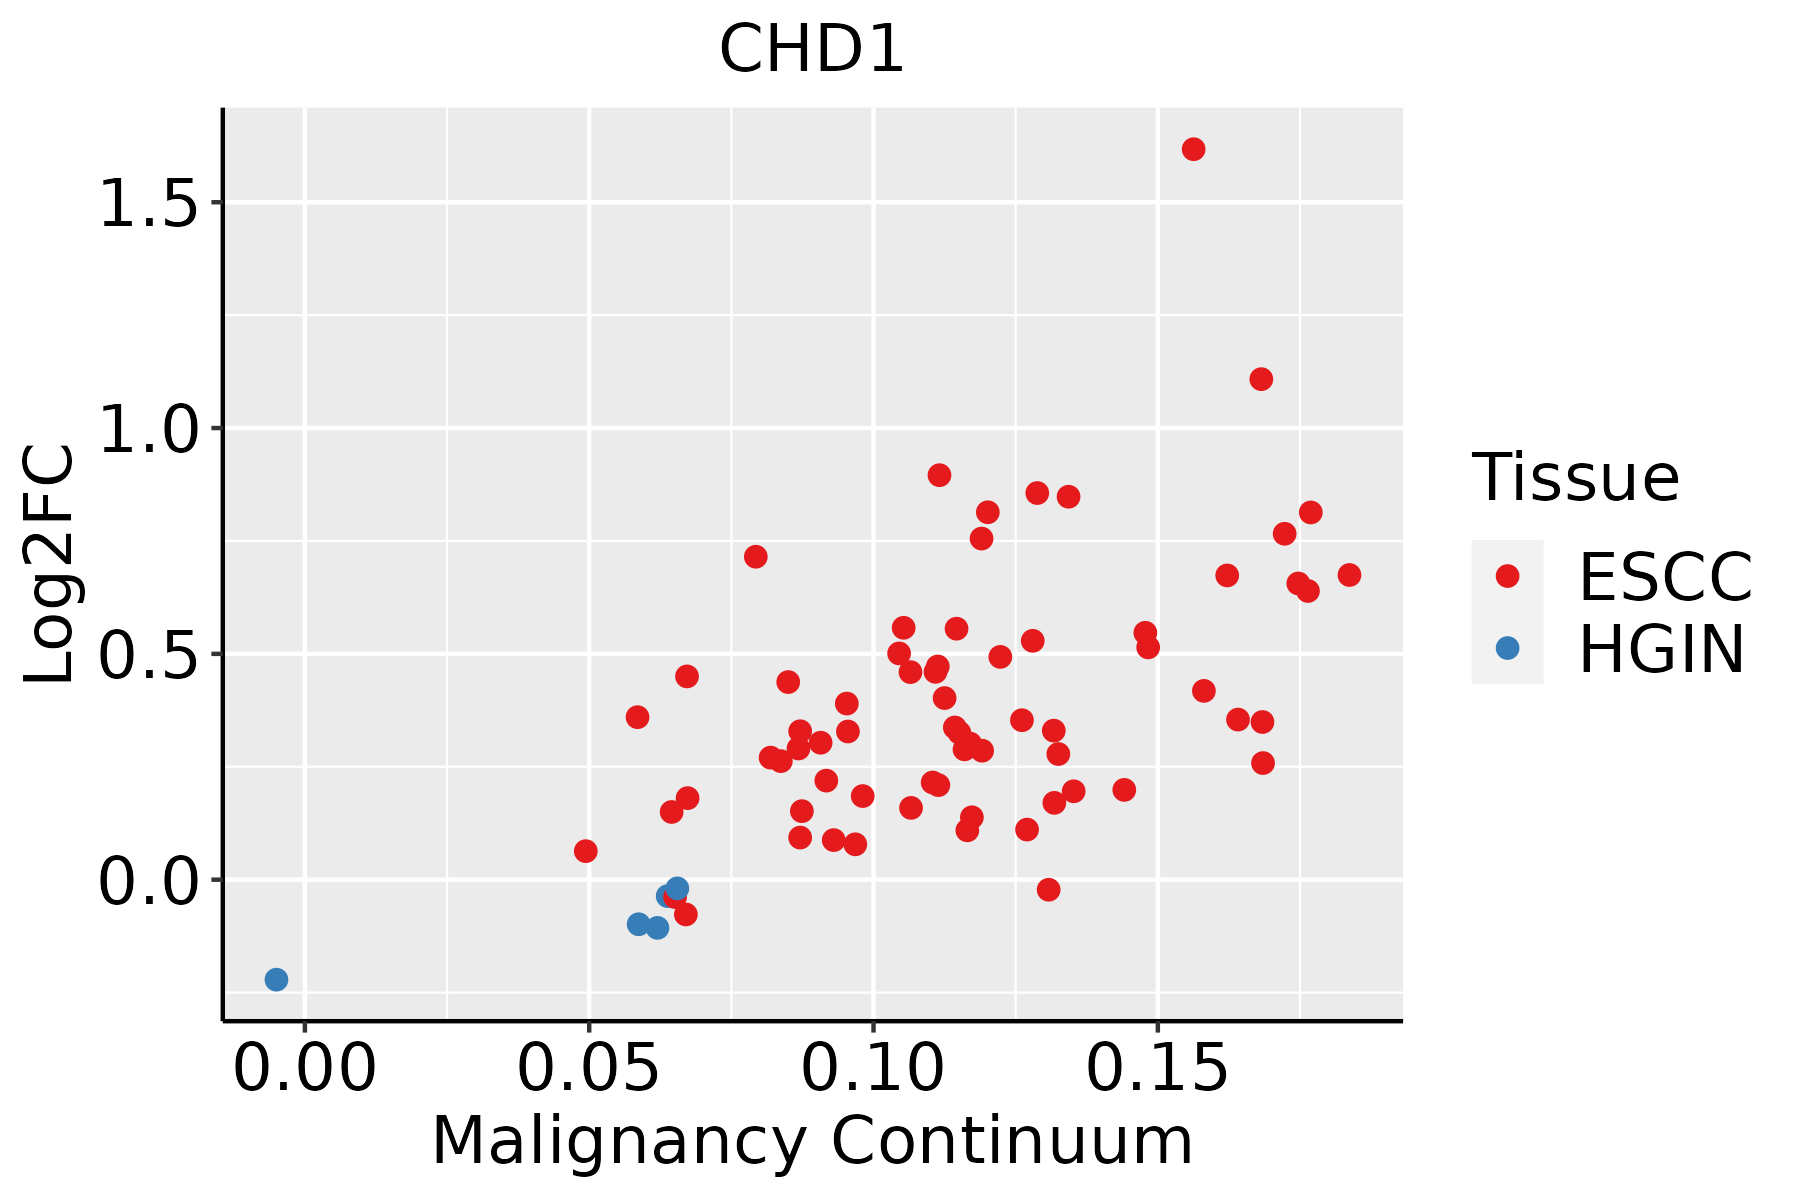 | ESCC: Esophageal squamous cell carcinoma |
| HGIN: High-grade intraepithelial neoplasias |
| LGIN: Low-grade intraepithelial neoplasias |
| Liver | 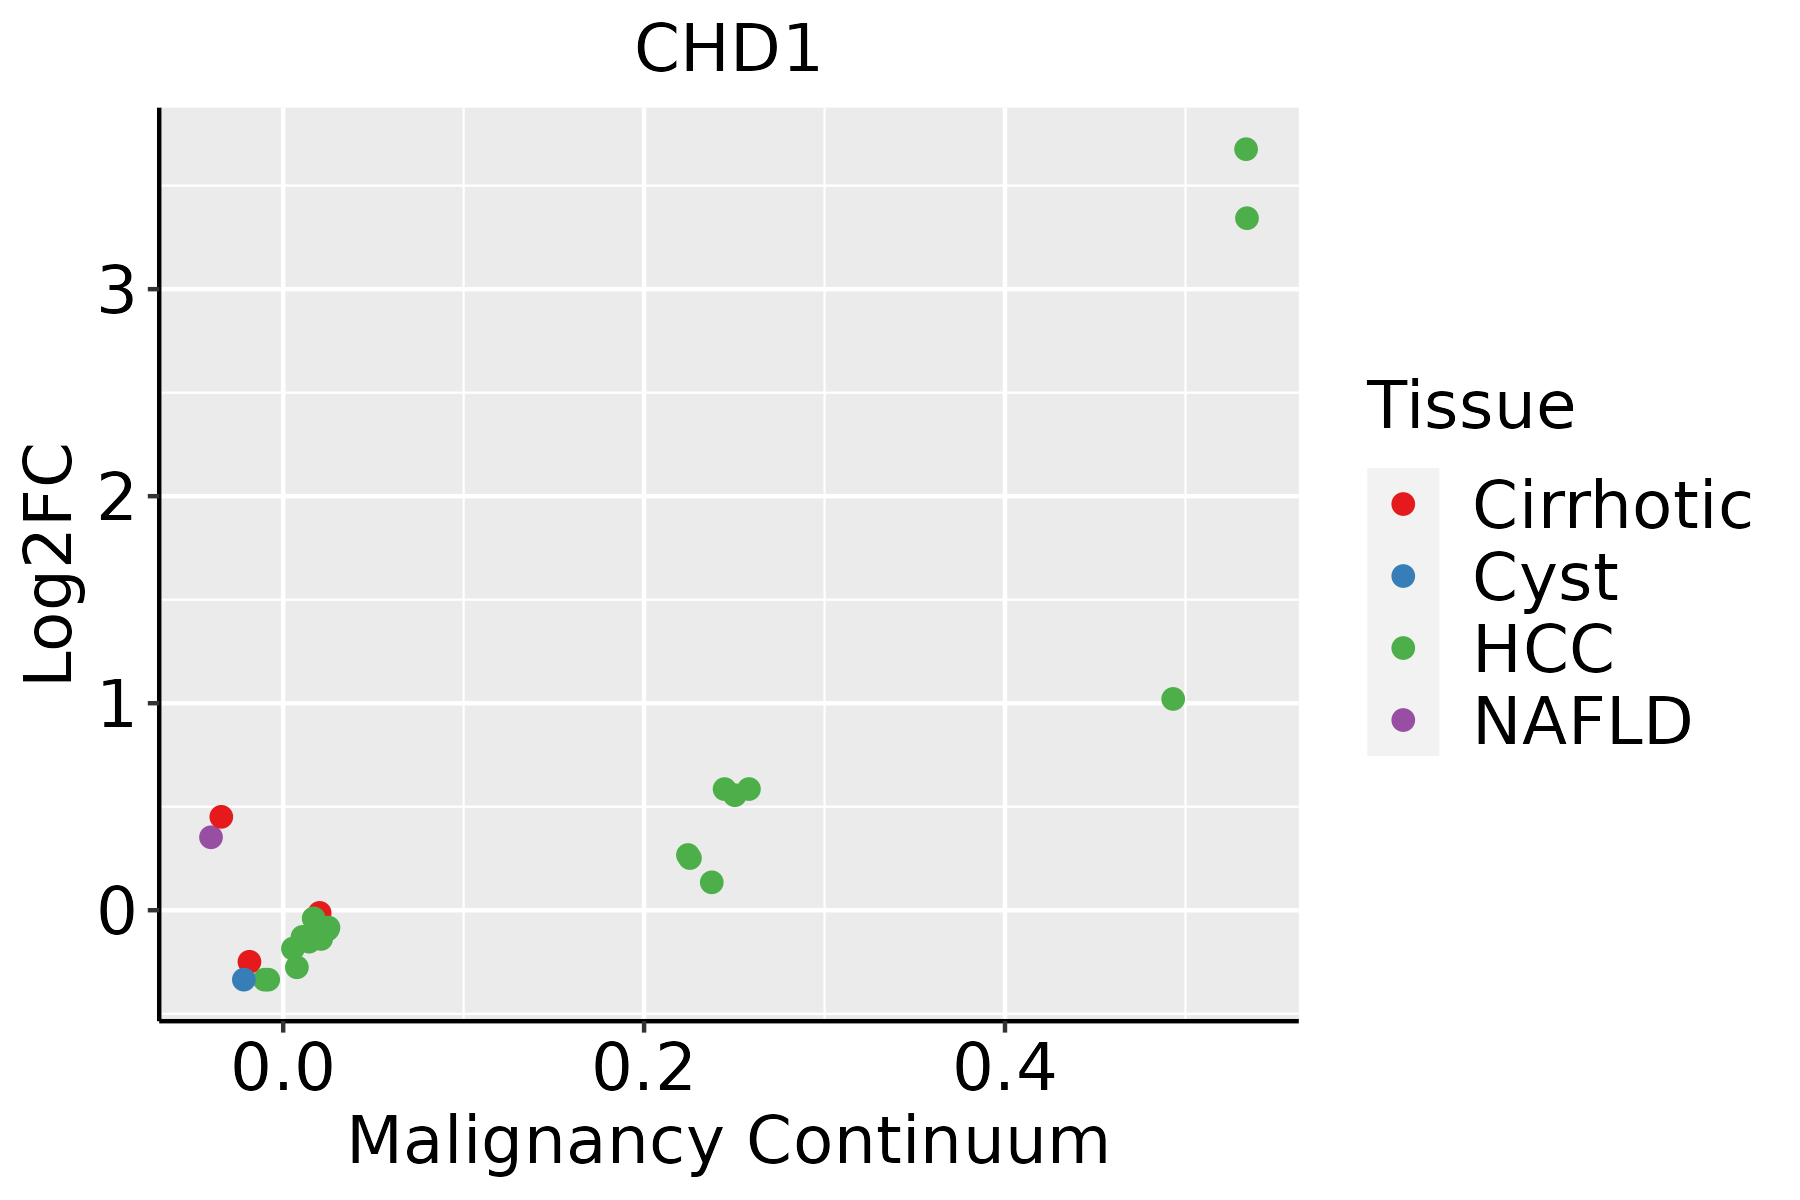 | HCC: Hepatocellular carcinoma |
| NAFLD: Non-alcoholic fatty liver disease |
| Lung | 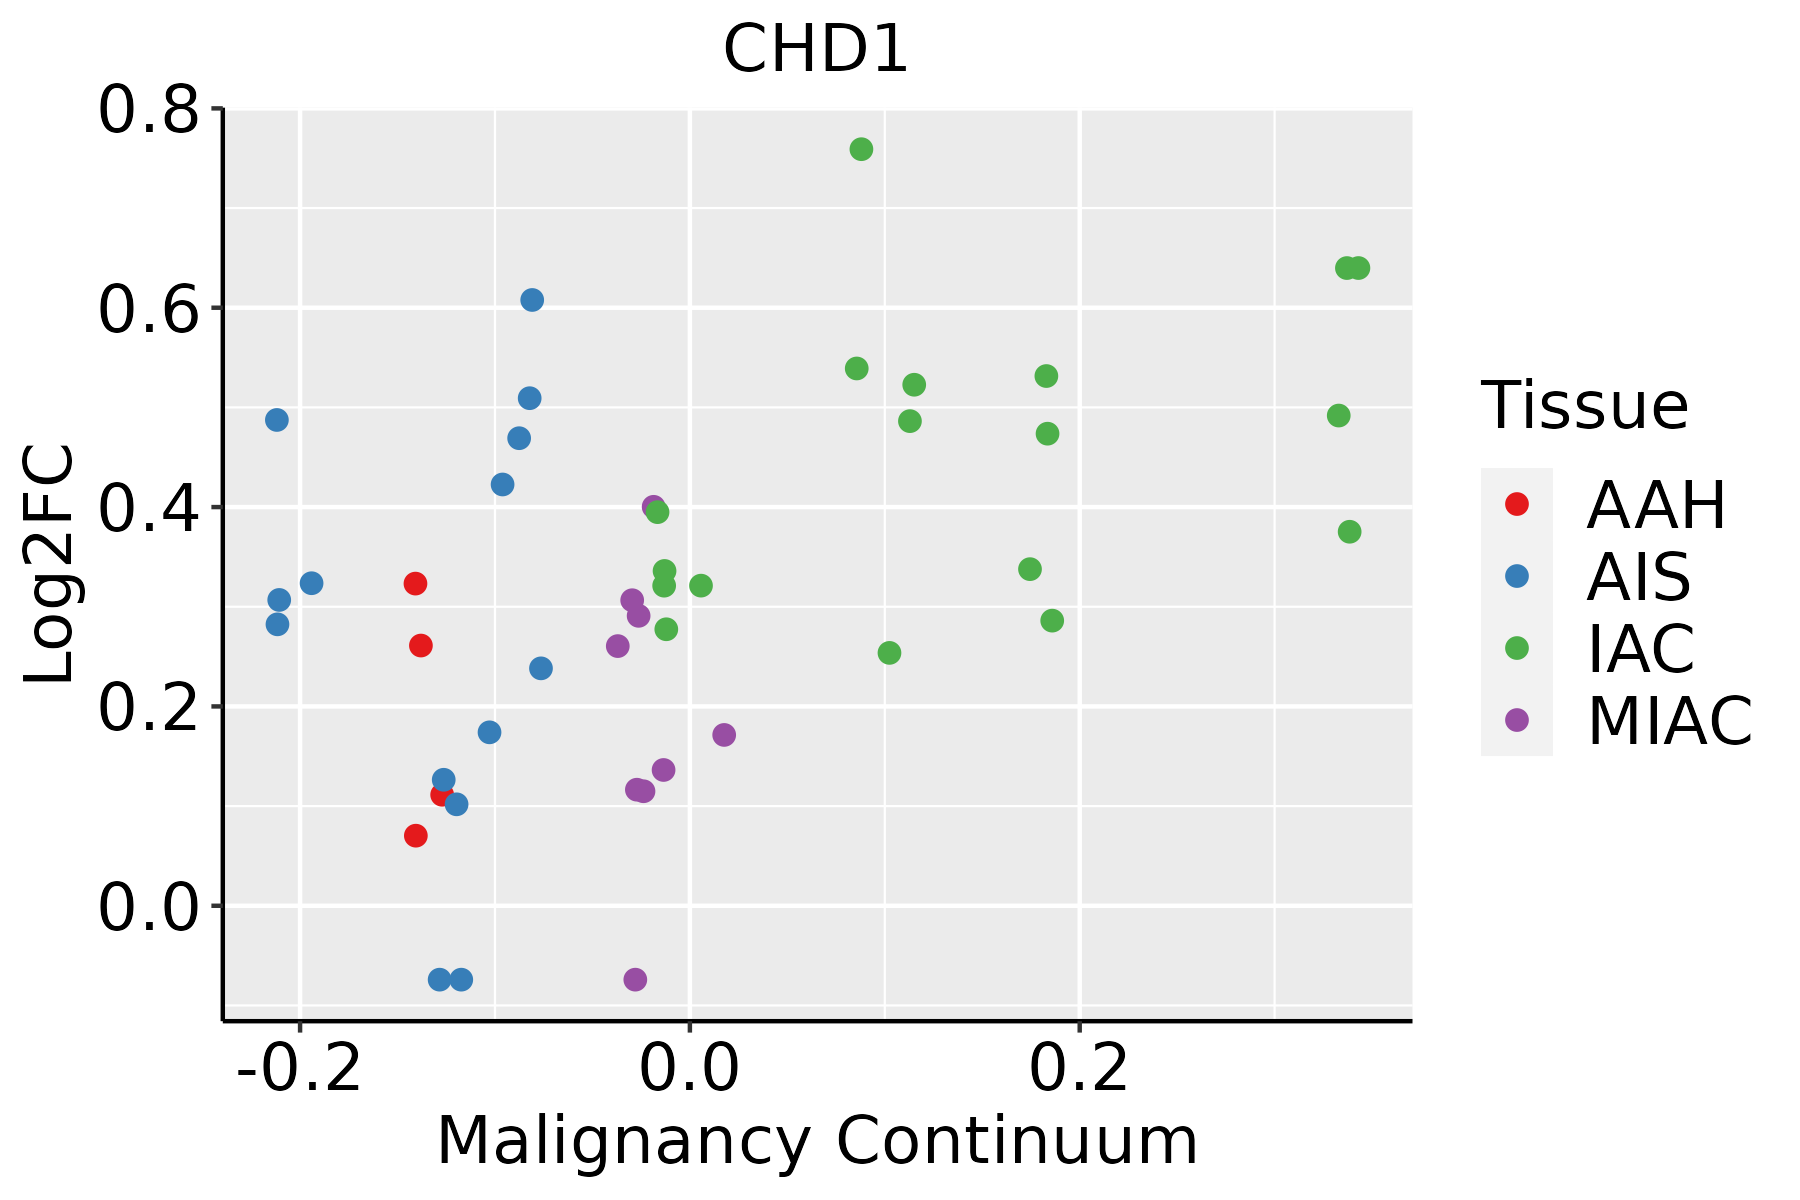 | AAH: Atypical adenomatous hyperplasia |
| AIS: Adenocarcinoma in situ |
| IAC: Invasive lung adenocarcinoma |
| MIA: Minimally invasive adenocarcinoma |
| Oral Cavity | 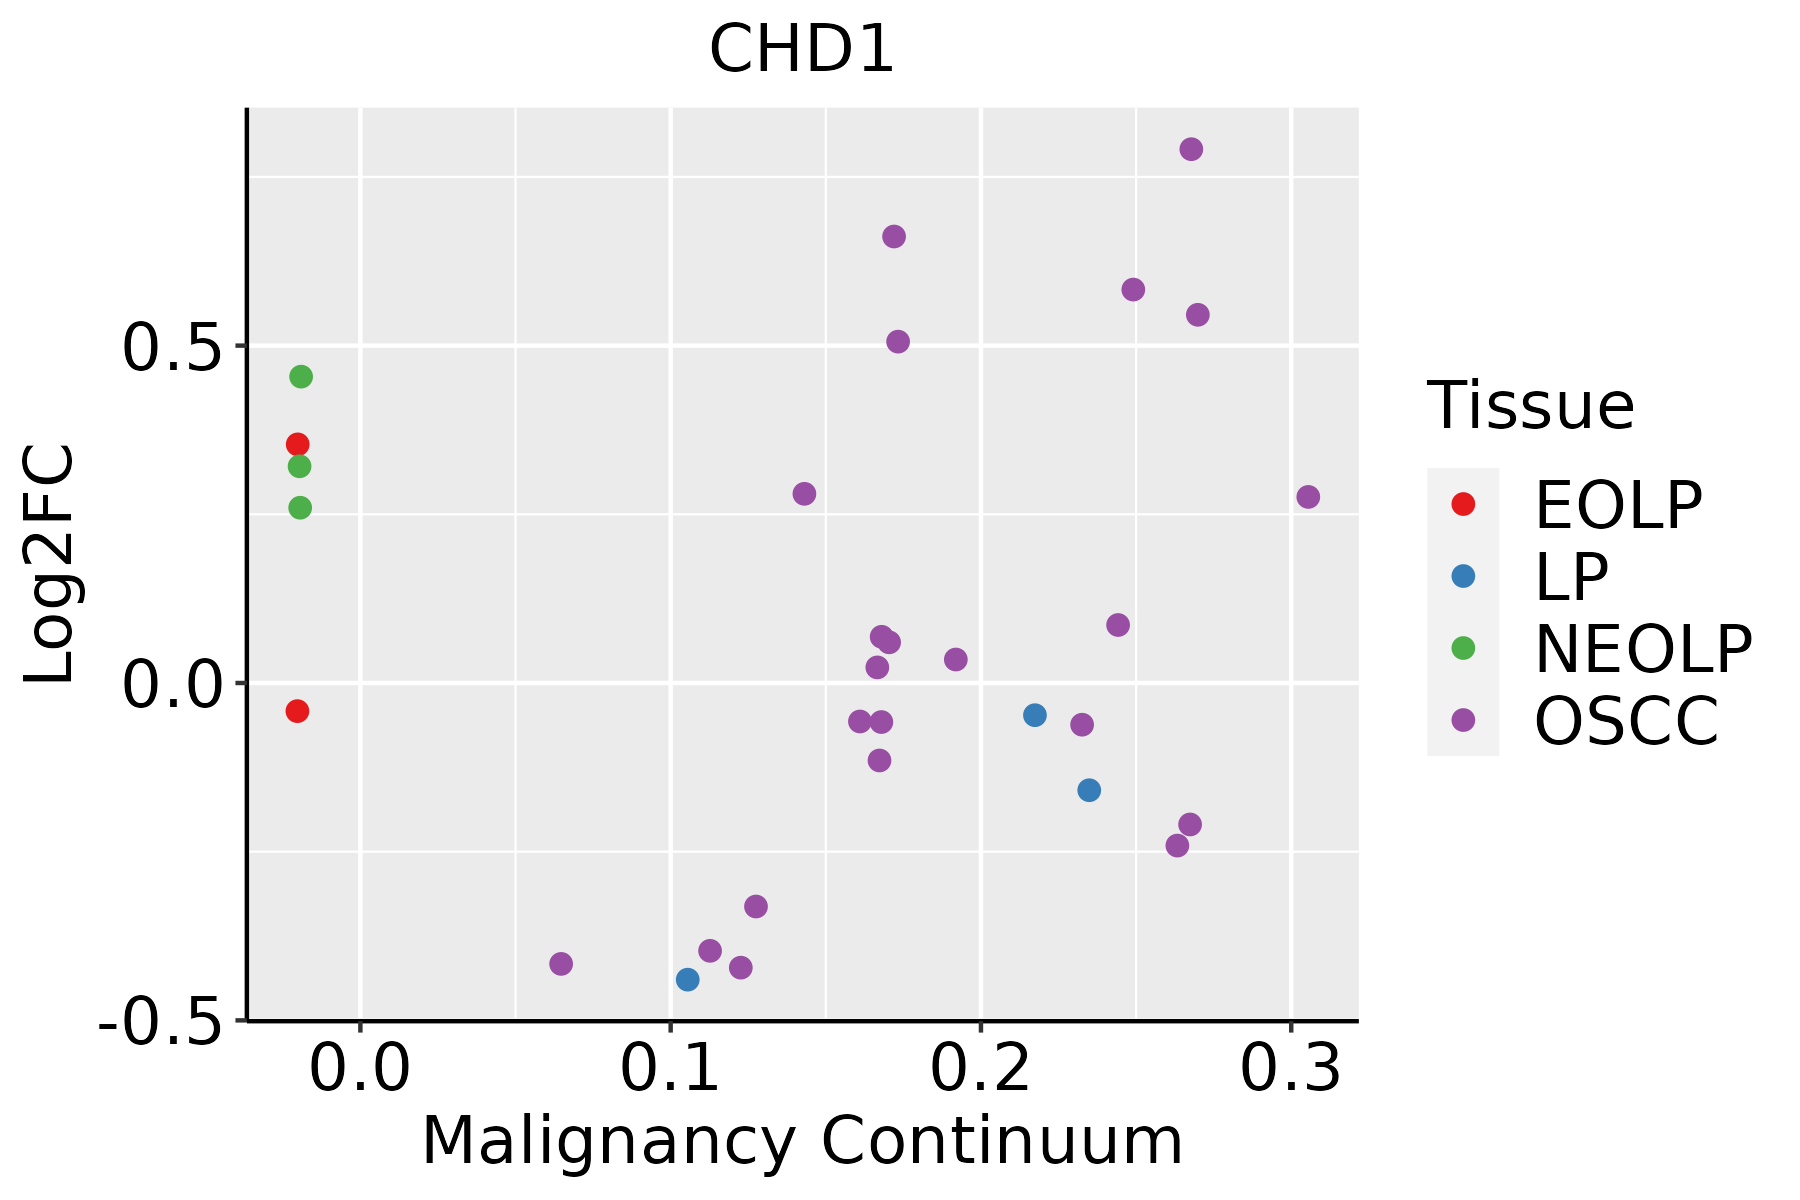 | EOLP: Erosive Oral lichen planus |
| LP: leukoplakia |
| NEOLP: Non-erosive oral lichen planus |
| OSCC: Oral squamous cell carcinoma |
| Prostate | 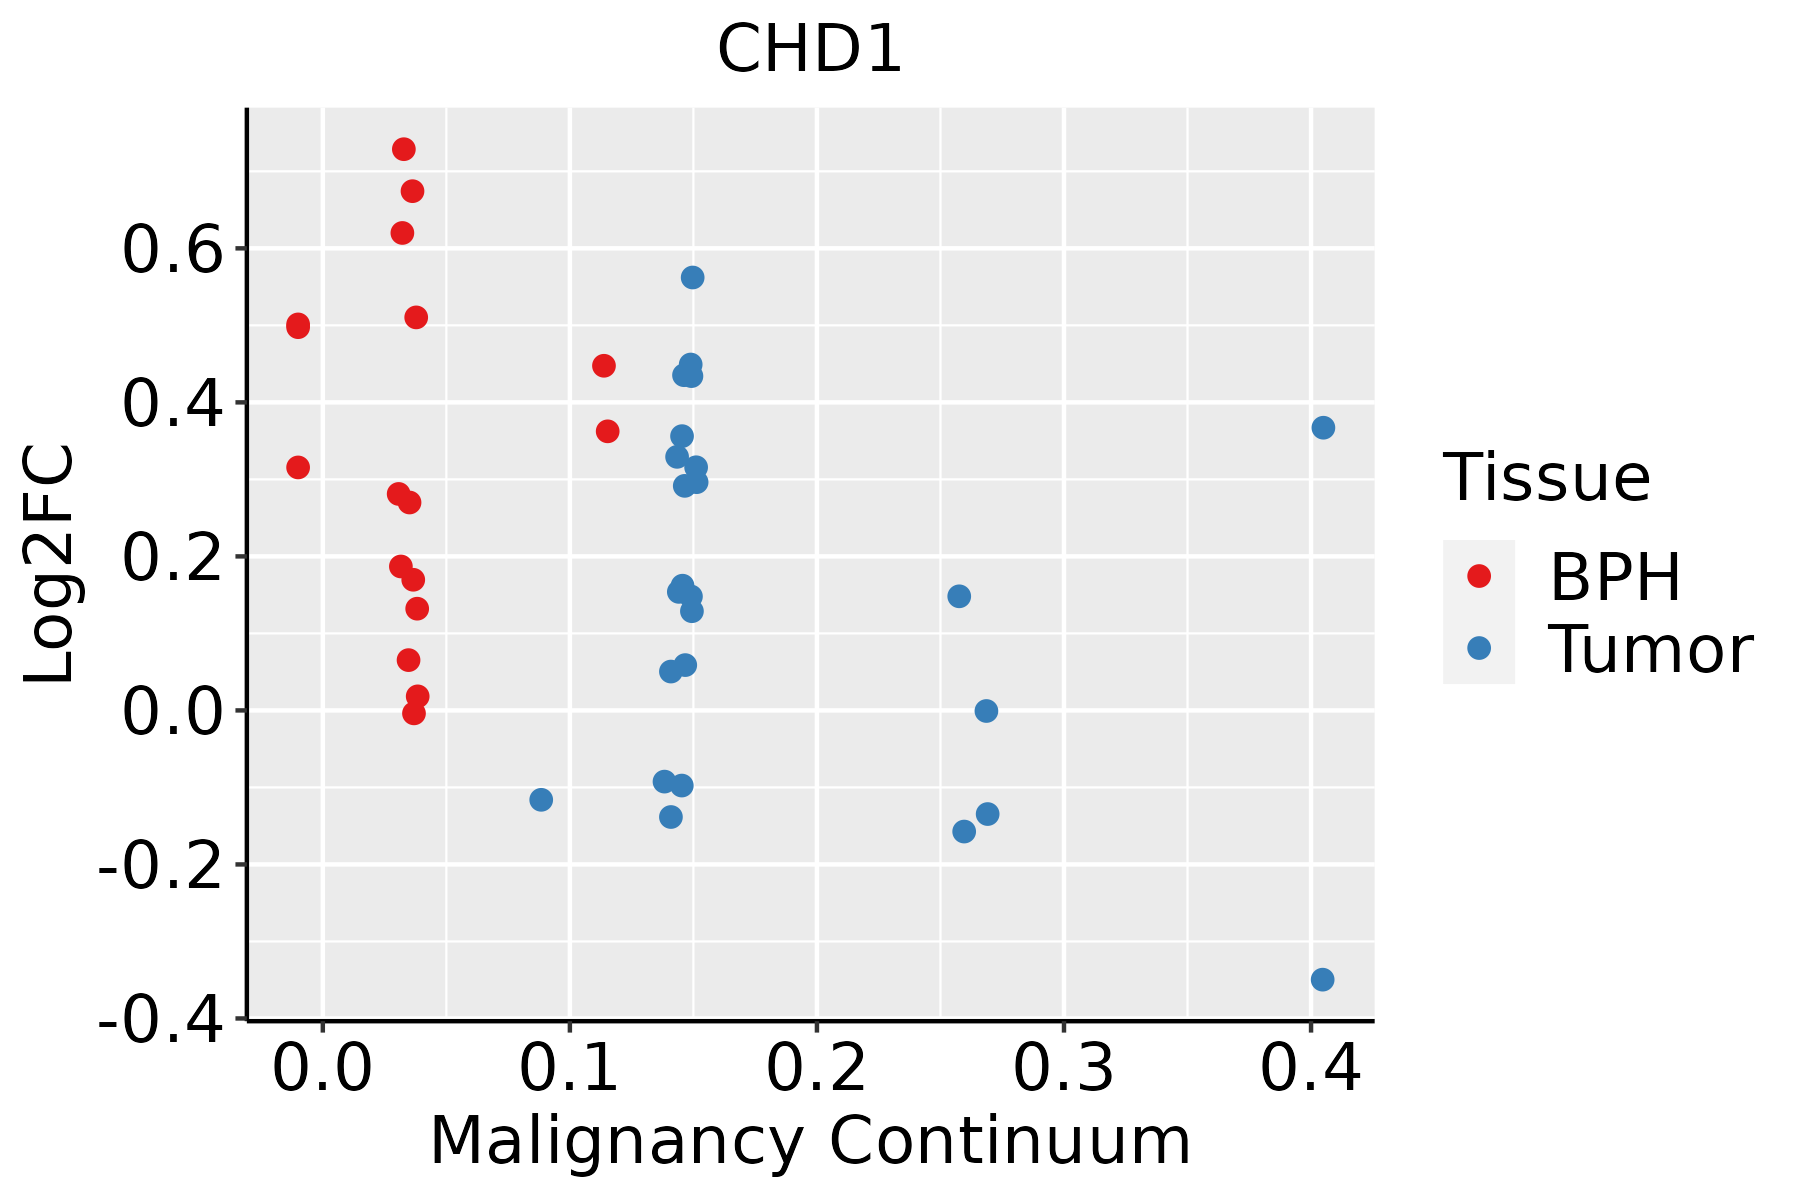 | BPH: Benign Prostatic Hyperplasia |
| Skin | 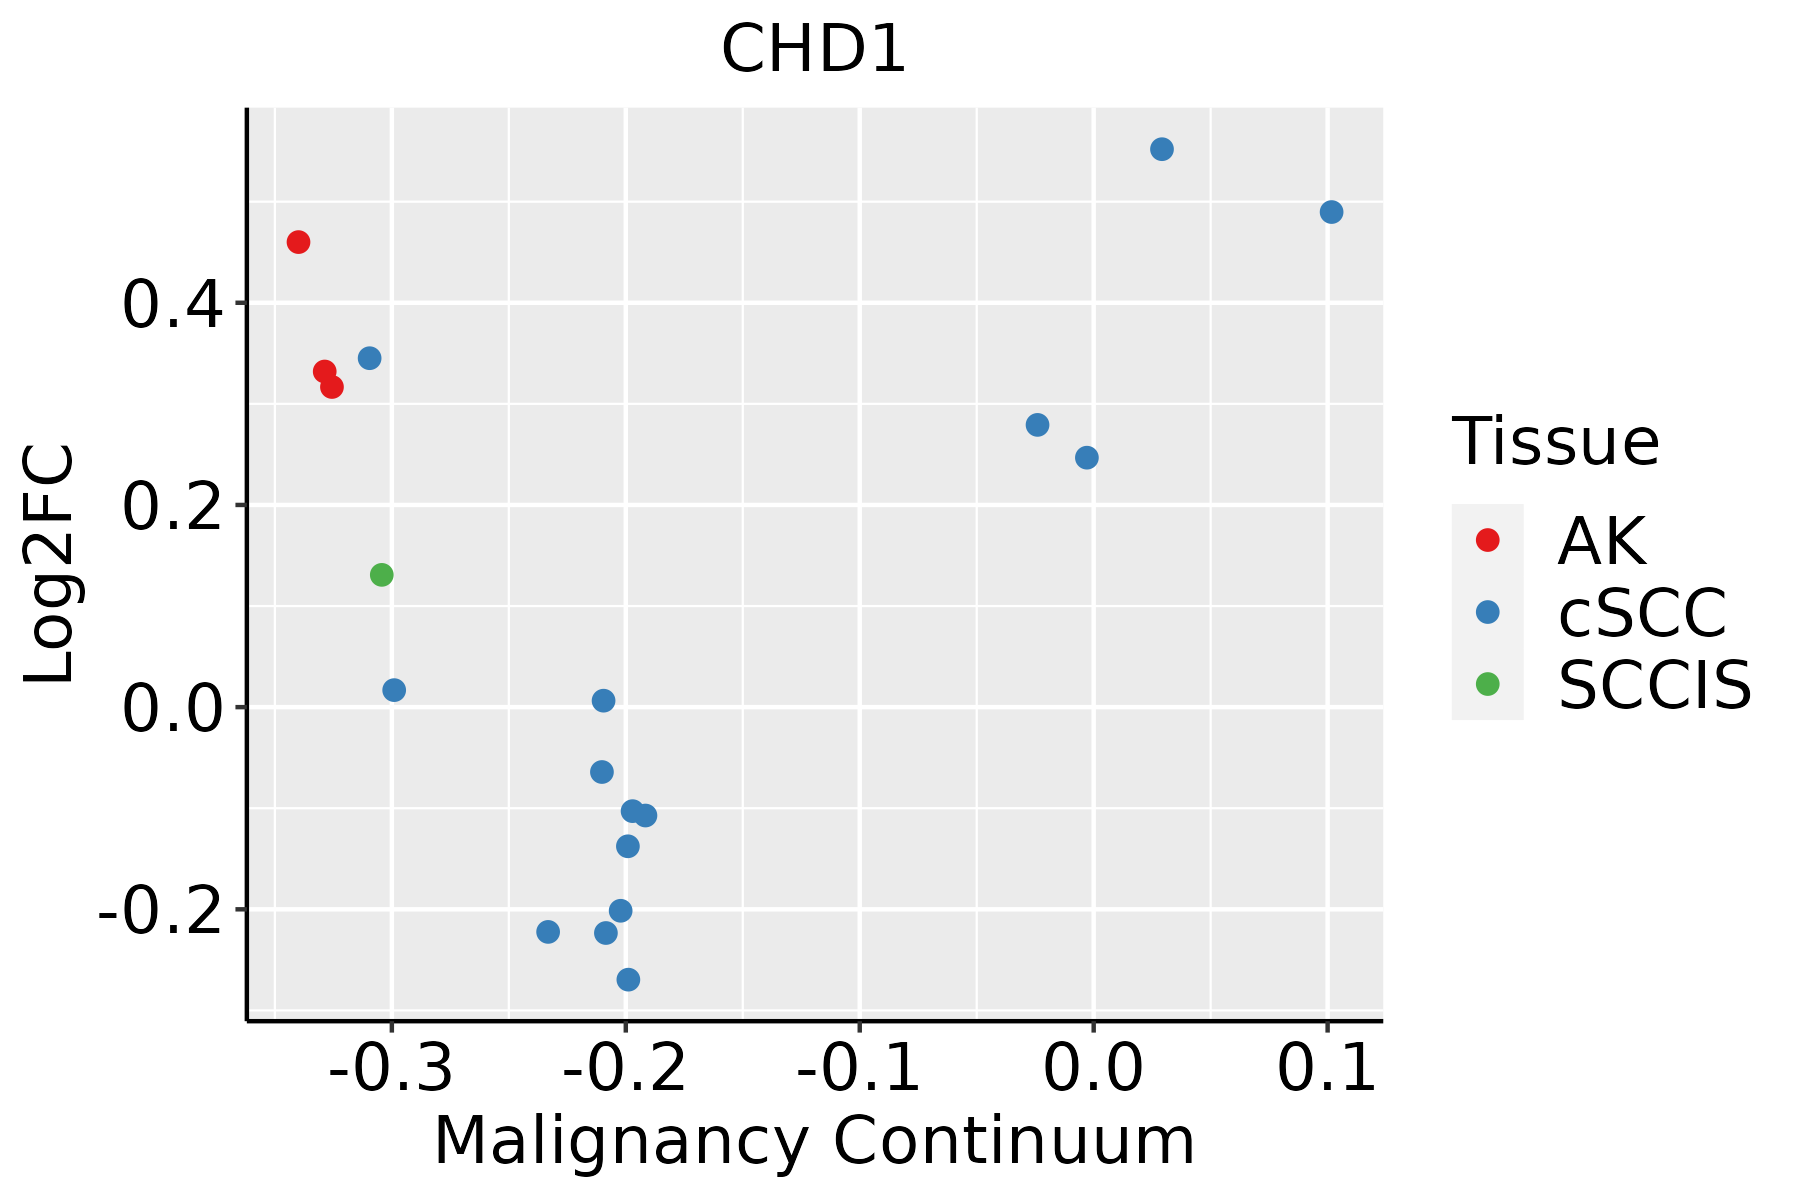 | AK: Actinic keratosis |
| cSCC: Cutaneous squamous cell carcinoma |
| SCCIS:squamous cell carcinoma in situ |
| Thyroid |  | ATC: Anaplastic thyroid cancer |
| HT: Hashimoto's thyroiditis |
| PTC: Papillary thyroid cancer |
| GO ID | Tissue | Disease Stage | Description | Gene Ratio | Bg Ratio | pvalue | p.adjust | Count |
| GO:000630212 | Thyroid | ATC | double-strand break repair | 110/6293 | 251/18723 | 4.48e-04 | 2.65e-03 | 110 |
| GO:004573911 | Thyroid | ATC | positive regulation of DNA repair | 37/6293 | 73/18723 | 1.89e-03 | 9.24e-03 | 37 |
| GO:014005314 | Thyroid | ATC | mitochondrial gene expression | 51/6293 | 108/18723 | 2.26e-03 | 1.06e-02 | 51 |
| GO:003254315 | Thyroid | ATC | mitochondrial translation | 38/6293 | 76/18723 | 2.26e-03 | 1.06e-02 | 38 |
| GO:00458141 | Thyroid | ATC | negative regulation of gene expression, epigenetic | 27/6293 | 50/18723 | 2.35e-03 | 1.10e-02 | 27 |
| GO:009734517 | Thyroid | ATC | mitochondrial outer membrane permeabilization | 19/6293 | 32/18723 | 2.46e-03 | 1.14e-02 | 19 |
| GO:00315071 | Thyroid | ATC | heterochromatin assembly | 22/6293 | 39/18723 | 2.84e-03 | 1.29e-02 | 22 |
| GO:005170222 | Thyroid | ATC | biological process involved in interaction with symbiont | 45/6293 | 94/18723 | 2.86e-03 | 1.30e-02 | 45 |
| GO:007082811 | Thyroid | ATC | heterochromatin organization | 25/6293 | 46/18723 | 3.00e-03 | 1.36e-02 | 25 |
| GO:00510531 | Thyroid | ATC | negative regulation of DNA metabolic process | 57/6293 | 125/18723 | 3.47e-03 | 1.55e-02 | 57 |
| GO:00063031 | Thyroid | ATC | double-strand break repair via nonhomologous end joining | 33/6293 | 66/18723 | 4.27e-03 | 1.80e-02 | 33 |
| GO:004392313 | Thyroid | ATC | positive regulation by host of viral transcription | 11/6293 | 16/18723 | 4.33e-03 | 1.80e-02 | 11 |
| GO:20010321 | Thyroid | ATC | regulation of double-strand break repair via nonhomologous end joining | 17/6293 | 29/18723 | 4.95e-03 | 2.03e-02 | 17 |
| GO:003579417 | Thyroid | ATC | positive regulation of mitochondrial membrane permeability | 23/6293 | 43/18723 | 5.64e-03 | 2.29e-02 | 23 |
| GO:003239216 | Thyroid | ATC | DNA geometric change | 42/6293 | 90/18723 | 6.81e-03 | 2.70e-02 | 42 |
| GO:190268616 | Thyroid | ATC | mitochondrial outer membrane permeabilization involved in programmed cell death | 21/6293 | 40/18723 | 1.05e-02 | 3.81e-02 | 21 |
| GO:0045738 | Thyroid | ATC | negative regulation of DNA repair | 19/6293 | 36/18723 | 1.37e-02 | 4.77e-02 | 19 |
| GO:190571014 | Thyroid | ATC | positive regulation of membrane permeability | 24/6293 | 48/18723 | 1.37e-02 | 4.77e-02 | 24 |
| TF | Cell Type | Tissue | Disease Stage | Target Gene | RSS | Regulon Activity |
| CHD1 | TFH | Endometrium | EEC | MYCBP2-AS1,AC131571.1,NMT1, etc. | 9.10e-02 |  |
| CHD1 | NEUT | Lung | MIAC | IFITM2,VPS37B,NUPR1, etc. | 5.60e-02 |  |
| CHD1 | INMON | Prostate | ADJ | TNFSF15,EZR,ZNF331, etc. | 1.19e-01 |  |
| CHD1 | INMON | Prostate | Tumor | TNFSF15,EZR,ZNF331, etc. | 1.00e-01 |  |
| CHD1 | MSC.MVA | Skin | Healthy | PPP1R15B,YME1L1,CREM, etc. | 3.80e-02 |  |
| CHD1 | CD8TEXINT | Stomach | CAG | FOXK2,TMEM161B,FAM27C, etc. | 2.27e-02 |  |
| CHD1 | MAIT | Stomach | CAG with IM | FOXK2,TMEM161B,FAM27C, etc. | 4.68e-02 |  |
| CHD1 | CD8TEREX | Stomach | Healthy | FOXK2,TMEM161B,FAM27C, etc. | 7.97e-02 |  |
| CHD1 | TH17 | Stomach | Healthy | FOXK2,TMEM161B,FAM27C, etc. | 2.43e-02 | |
| CHD1 | MAIT | Stomach | Healthy | FOXK2,TMEM161B,FAM27C, etc. | 1.79e-02 | |
| Hugo Symbol | Variant Class | Variant Classification | dbSNP RS | HGVSc | HGVSp | HGVSp Short | SWISSPROT | BIOTYPE | SIFT | PolyPhen | Tumor Sample Barcode | Tissue | Histology | Sex | Age | Stage | Therapy Types | Drugs | Outcome |
| CHD1 | SNV | Missense_Mutation | novel | c.1871N>G | p.Ser624Cys | p.S624C | O14646 | protein_coding | deleterious(0) | probably_damaging(0.999) | TCGA-AC-A5XS-01 | Breast | breast invasive carcinoma | Female | >=65 | I/II | Hormone Therapy | femara | SD |
| CHD1 | SNV | Missense_Mutation | | c.2699N>A | p.Arg900Gln | p.R900Q | O14646 | protein_coding | deleterious(0) | probably_damaging(1) | TCGA-AN-A046-01 | Breast | breast invasive carcinoma | Female | >=65 | I/II | Unknown | Unknown | SD |
| CHD1 | SNV | Missense_Mutation | novel | c.2196N>T | p.Arg732Ser | p.R732S | O14646 | protein_coding | deleterious(0) | probably_damaging(0.971) | TCGA-AN-A046-01 | Breast | breast invasive carcinoma | Female | >=65 | I/II | Unknown | Unknown | SD |
| CHD1 | SNV | Missense_Mutation | novel | c.1860N>T | p.Lys620Asn | p.K620N | O14646 | protein_coding | deleterious(0) | probably_damaging(0.999) | TCGA-AN-A046-01 | Breast | breast invasive carcinoma | Female | >=65 | I/II | Unknown | Unknown | SD |
| CHD1 | SNV | Missense_Mutation | novel | c.1135N>A | p.Glu379Lys | p.E379K | O14646 | protein_coding | deleterious(0) | probably_damaging(0.917) | TCGA-AN-A046-01 | Breast | breast invasive carcinoma | Female | >=65 | I/II | Unknown | Unknown | SD |
| CHD1 | SNV | Missense_Mutation | novel | c.1424G>A | p.Gly475Glu | p.G475E | O14646 | protein_coding | tolerated(0.07) | benign(0.097) | TCGA-BH-A0DK-01 | Breast | breast invasive carcinoma | Female | <65 | I/II | Hormone Therapy | tamoxiphen | SD |
| CHD1 | SNV | Missense_Mutation | | c.932N>G | p.Lys311Arg | p.K311R | O14646 | protein_coding | tolerated(0.17) | benign(0.005) | TCGA-BH-A0DL-01 | Breast | breast invasive carcinoma | Female | <65 | I/II | Chemotherapy | cytoxan | CR |
| CHD1 | SNV | Missense_Mutation | | c.107N>G | p.Ser36Cys | p.S36C | O14646 | protein_coding | deleterious_low_confidence(0.02) | probably_damaging(0.971) | TCGA-E9-A229-01 | Breast | breast invasive carcinoma | Female | <65 | I/II | Chemotherapy | 5-fluorouracil | SD |
| CHD1 | SNV | Missense_Mutation | novel | c.422G>A | p.Arg141Lys | p.R141K | O14646 | protein_coding | tolerated_low_confidence(0.51) | benign(0) | TCGA-LD-A66U-01 | Breast | breast invasive carcinoma | Female | <65 | I/II | Chemotherapy | adriamycin | SD |
| CHD1 | insertion | Frame_Shift_Ins | novel | c.3960_3961insA | p.Glu1321ArgfsTer17 | p.E1321Rfs*17 | O14646 | protein_coding | | | TCGA-A8-A09Z-01 | Breast | breast invasive carcinoma | Female | >=65 | I/II | Unknown | Unknown | SD |


