
|
|||||
|
 | |
| |
| |
| |
| |
| |
|
Gene: PTGS2 |
Gene summary for PTGS2 |
| Gene information | Species | Human | Gene symbol | PTGS2 | Gene ID | 5743 |
| Gene name | prostaglandin-endoperoxide synthase 2 | |
| Gene Alias | COX-2 | |
| Cytomap | 1q31.1 | |
| Gene Type | protein-coding | GO ID | GO:0000003 | UniProtAcc | P35354 |
Top |
Malignant transformation analysis |
| Identification of the aberrant gene expression in precancerous and cancerous lesions by comparing the gene expression of stem-like cells in diseased tissues with normal stem cells |
| Entrez ID | Symbol | Replicates | Species | Organ | Tissue | Adj P-value | Log2FC | Malignancy |
| 5743 | PTGS2 | CA_HPV_1 | Human | Cervix | CC | 4.42e-06 | -3.38e-01 | 0.0264 |
| 5743 | PTGS2 | CA_HPV_3 | Human | Cervix | CC | 3.42e-05 | -3.79e-01 | 0.0414 |
| 5743 | PTGS2 | HSIL_HPV_1 | Human | Cervix | HSIL_HPV | 3.79e-03 | -4.77e-01 | 0.0116 |
| 5743 | PTGS2 | HSIL_HPV_2 | Human | Cervix | HSIL_HPV | 3.67e-21 | -5.75e-01 | 0.0208 |
| 5743 | PTGS2 | CCI_2 | Human | Cervix | CC | 3.48e-04 | -6.44e-01 | 0.5249 |
| 5743 | PTGS2 | CCI_3 | Human | Cervix | CC | 1.36e-04 | -6.28e-01 | 0.516 |
| 5743 | PTGS2 | CCII_1 | Human | Cervix | CC | 5.10e-10 | -6.44e-01 | 0.3249 |
| 5743 | PTGS2 | Tumor | Human | Cervix | CC | 9.63e-19 | -6.01e-01 | 0.1241 |
| 5743 | PTGS2 | sample3 | Human | Cervix | CC | 2.31e-07 | -4.77e-01 | 0.1387 |
| 5743 | PTGS2 | L1 | Human | Cervix | CC | 3.88e-11 | -6.44e-01 | 0.0802 |
| 5743 | PTGS2 | T3 | Human | Cervix | CC | 2.50e-10 | -4.74e-01 | 0.1389 |
| 5743 | PTGS2 | LZE8T | Human | Esophagus | ESCC | 5.97e-05 | -2.52e-02 | 0.067 |
| 5743 | PTGS2 | LZE24T | Human | Esophagus | ESCC | 2.55e-02 | -2.90e-01 | 0.0596 |
| 5743 | PTGS2 | P9T-E | Human | Esophagus | ESCC | 2.80e-31 | 1.89e+00 | 0.1131 |
| 5743 | PTGS2 | P10T-E | Human | Esophagus | ESCC | 3.24e-02 | -2.03e-01 | 0.116 |
| 5743 | PTGS2 | P12T-E | Human | Esophagus | ESCC | 1.89e-02 | -2.71e-01 | 0.1122 |
| 5743 | PTGS2 | P16T-E | Human | Esophagus | ESCC | 3.36e-02 | -2.43e-01 | 0.1153 |
| 5743 | PTGS2 | P24T-E | Human | Esophagus | ESCC | 7.63e-03 | -2.69e-01 | 0.1287 |
| 5743 | PTGS2 | P32T-E | Human | Esophagus | ESCC | 1.67e-03 | -2.40e-01 | 0.1666 |
| 5743 | PTGS2 | P61T-E | Human | Esophagus | ESCC | 5.69e-09 | 9.51e-01 | 0.099 |
| Page: 1 2 3 |
| Tissue | Expression Dynamics | Abbreviation |
| Cervix | 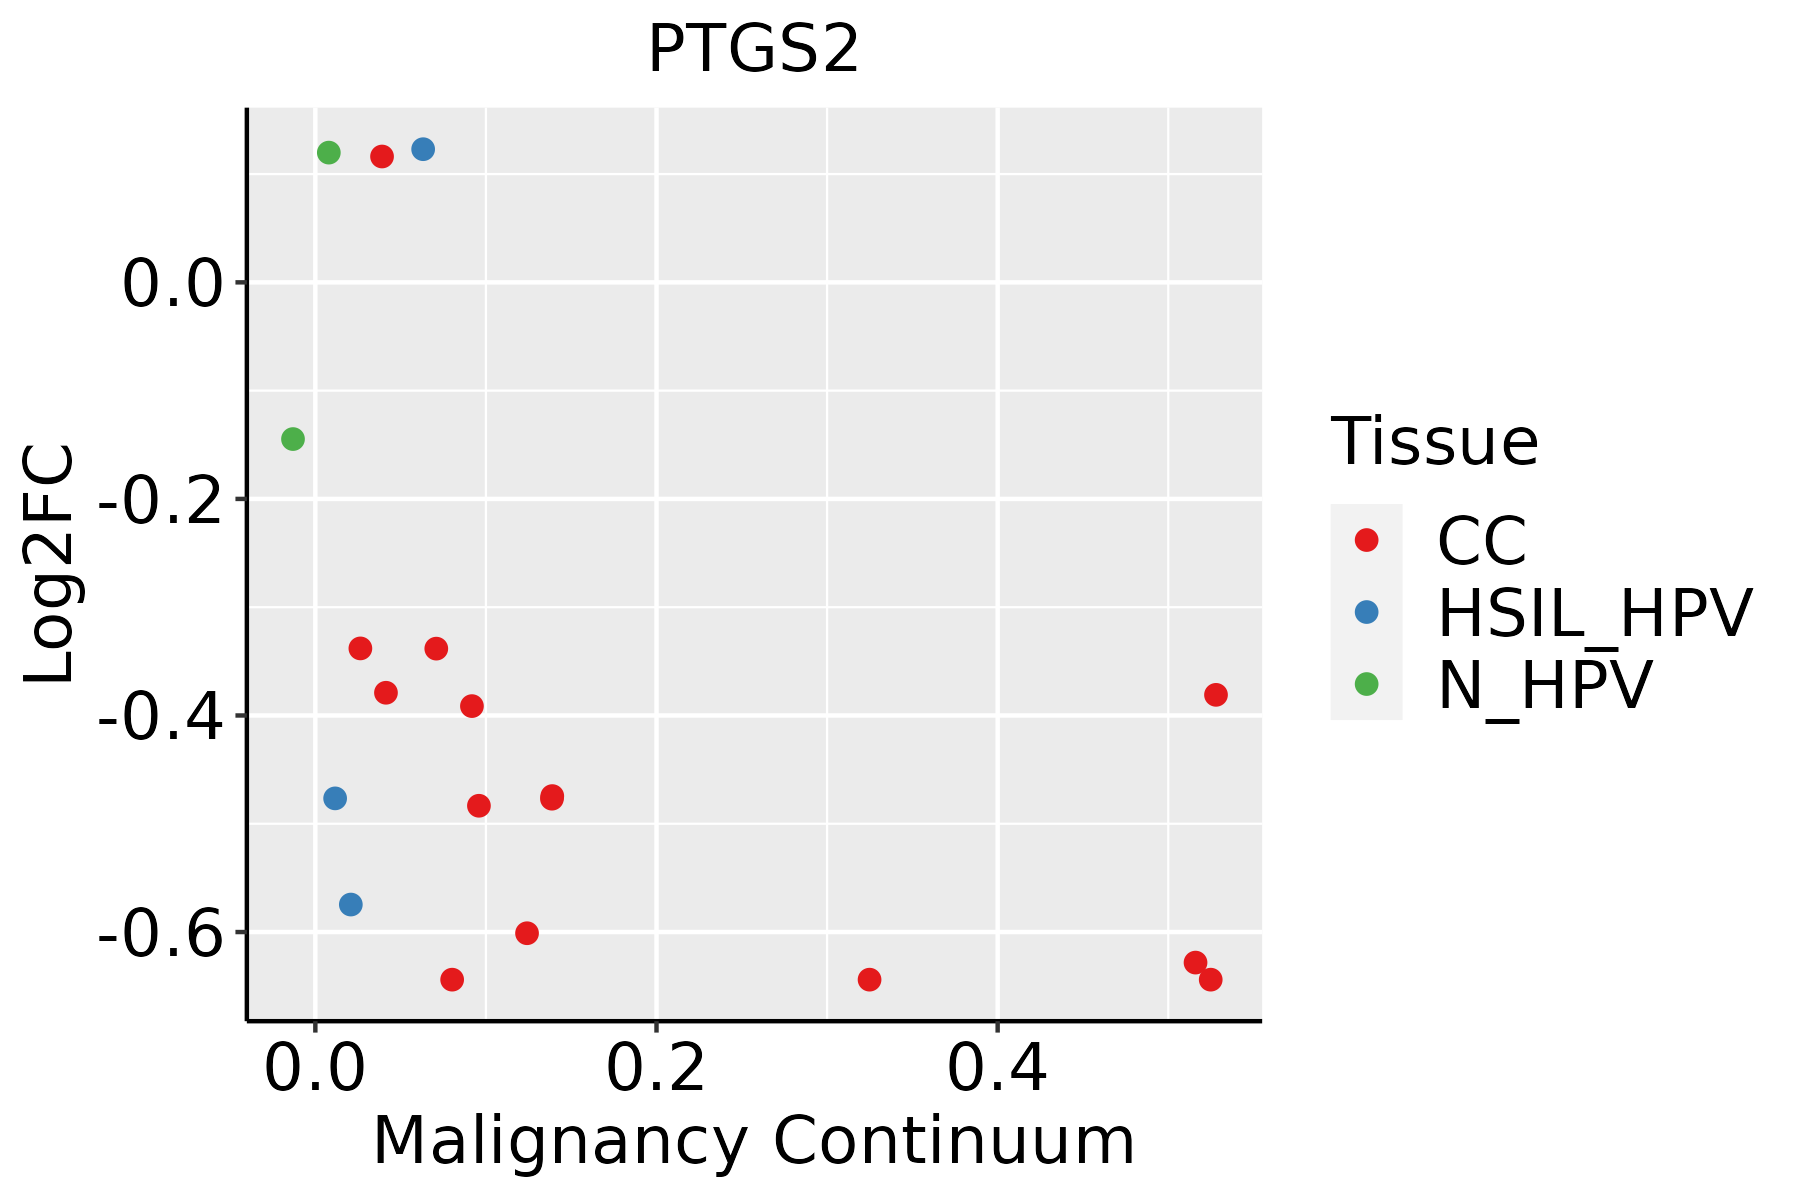 | CC: Cervix cancer |
| HSIL_HPV: HPV-infected high-grade squamous intraepithelial lesions | ||
| N_HPV: HPV-infected normal cervix | ||
| Esophagus | 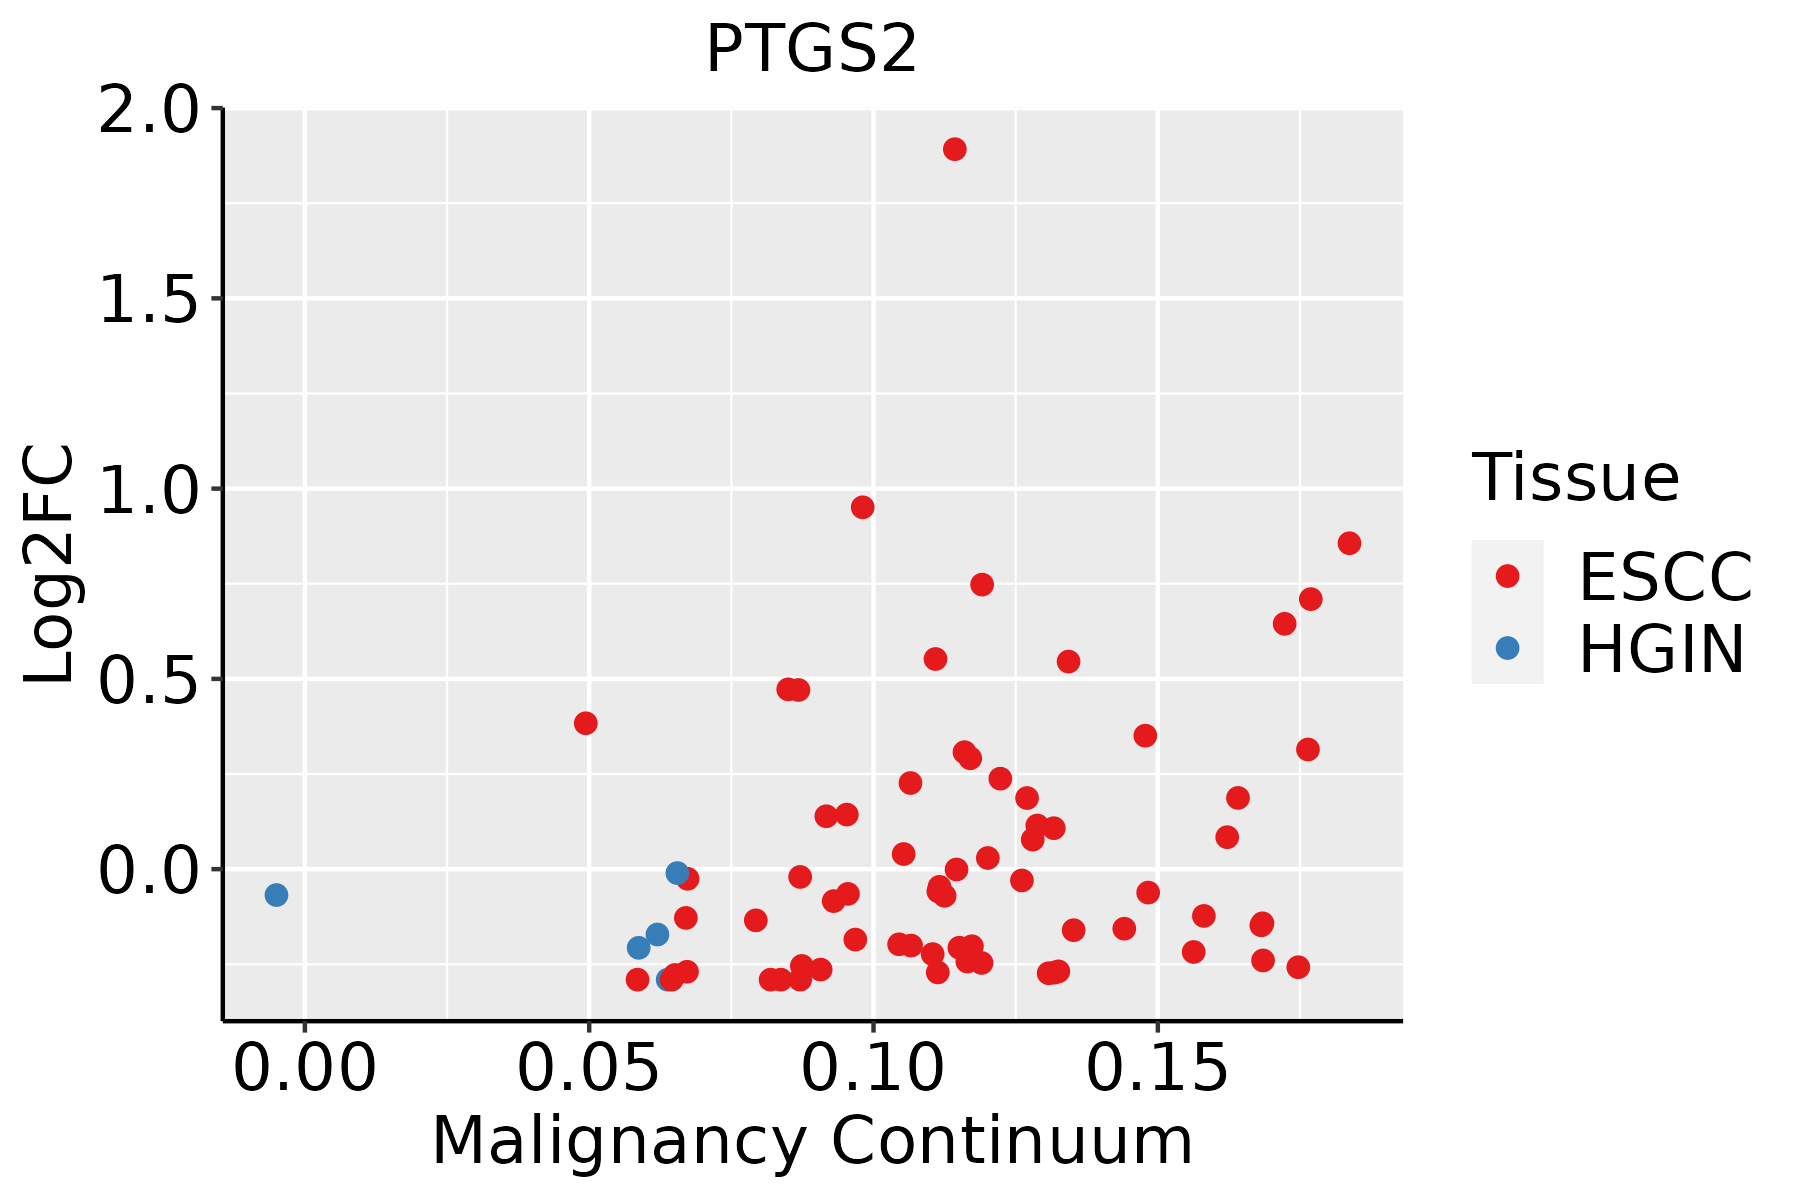 | ESCC: Esophageal squamous cell carcinoma |
| HGIN: High-grade intraepithelial neoplasias | ||
| LGIN: Low-grade intraepithelial neoplasias | ||
| Oral Cavity | 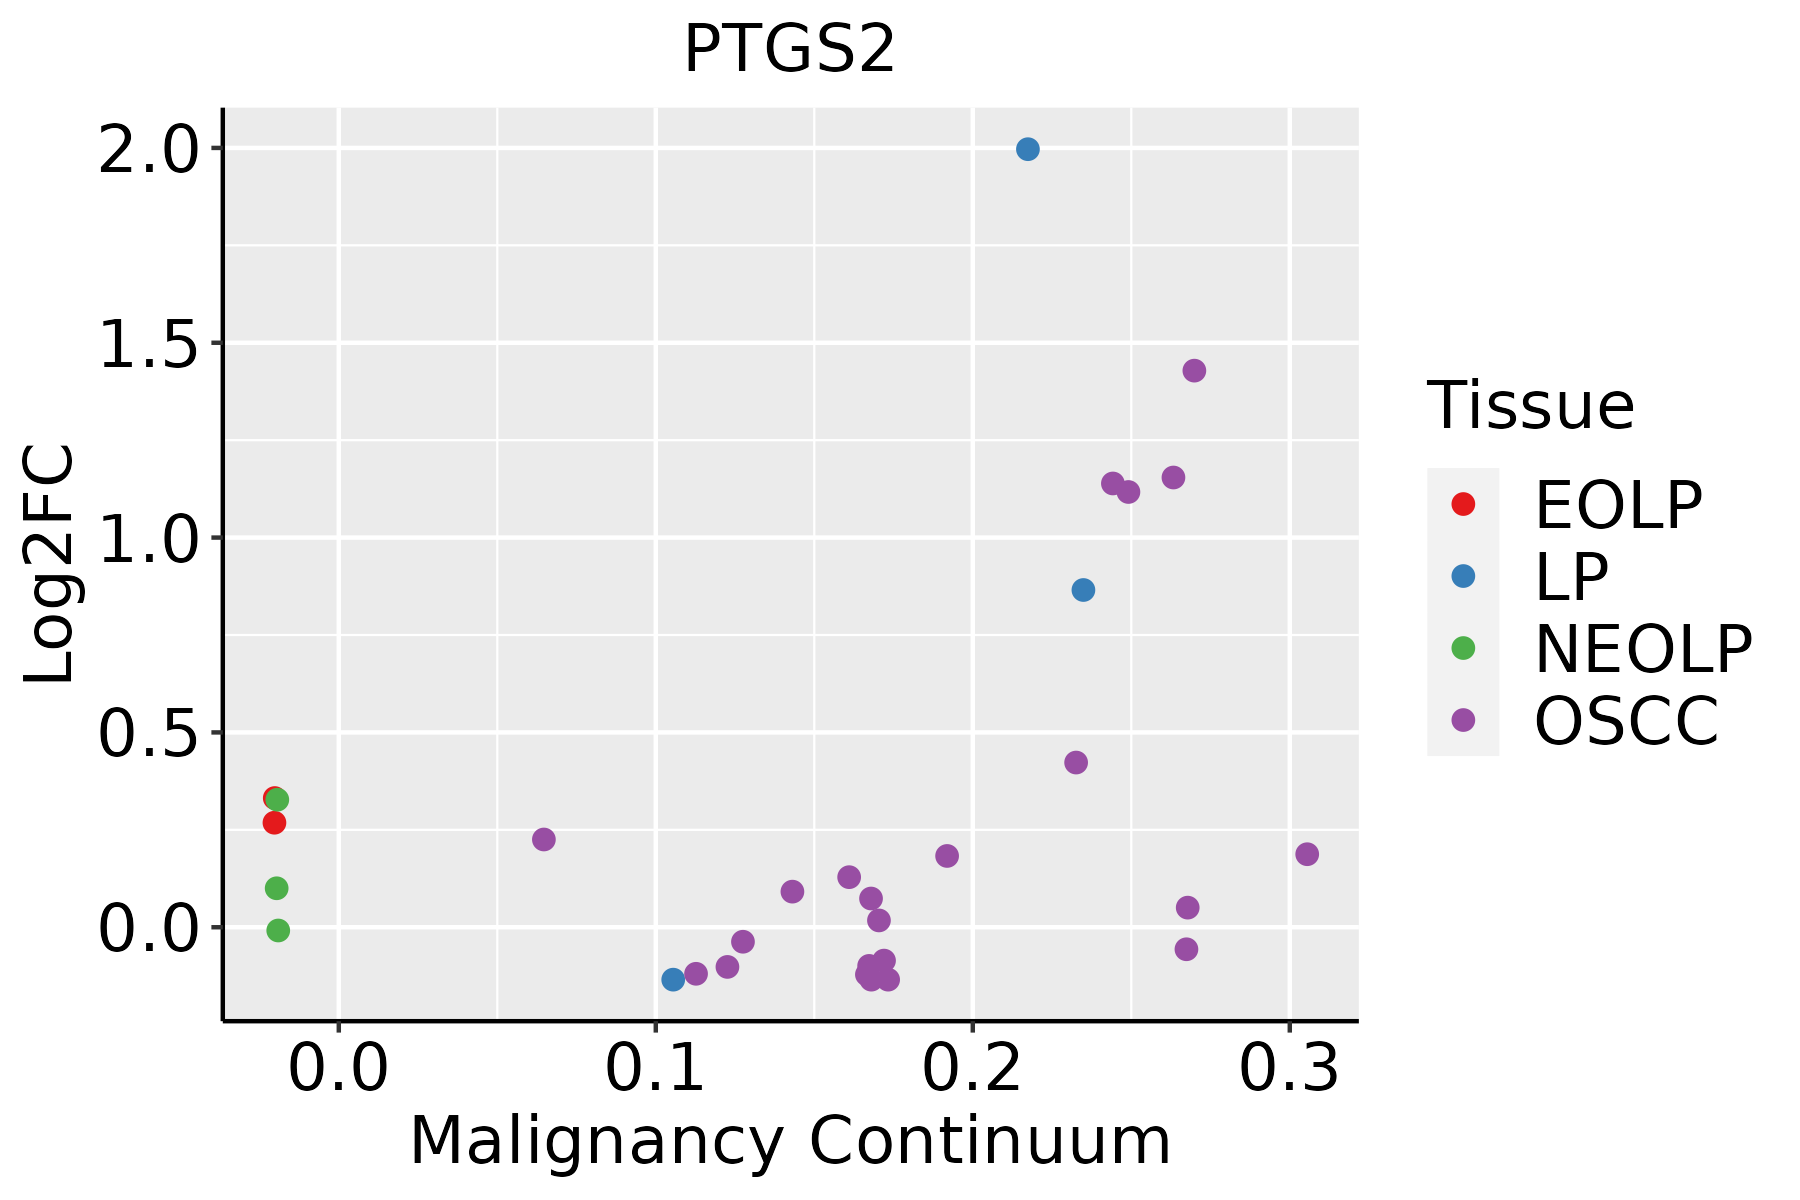 | EOLP: Erosive Oral lichen planus |
| LP: leukoplakia | ||
| NEOLP: Non-erosive oral lichen planus | ||
| OSCC: Oral squamous cell carcinoma | ||
| Prostate | 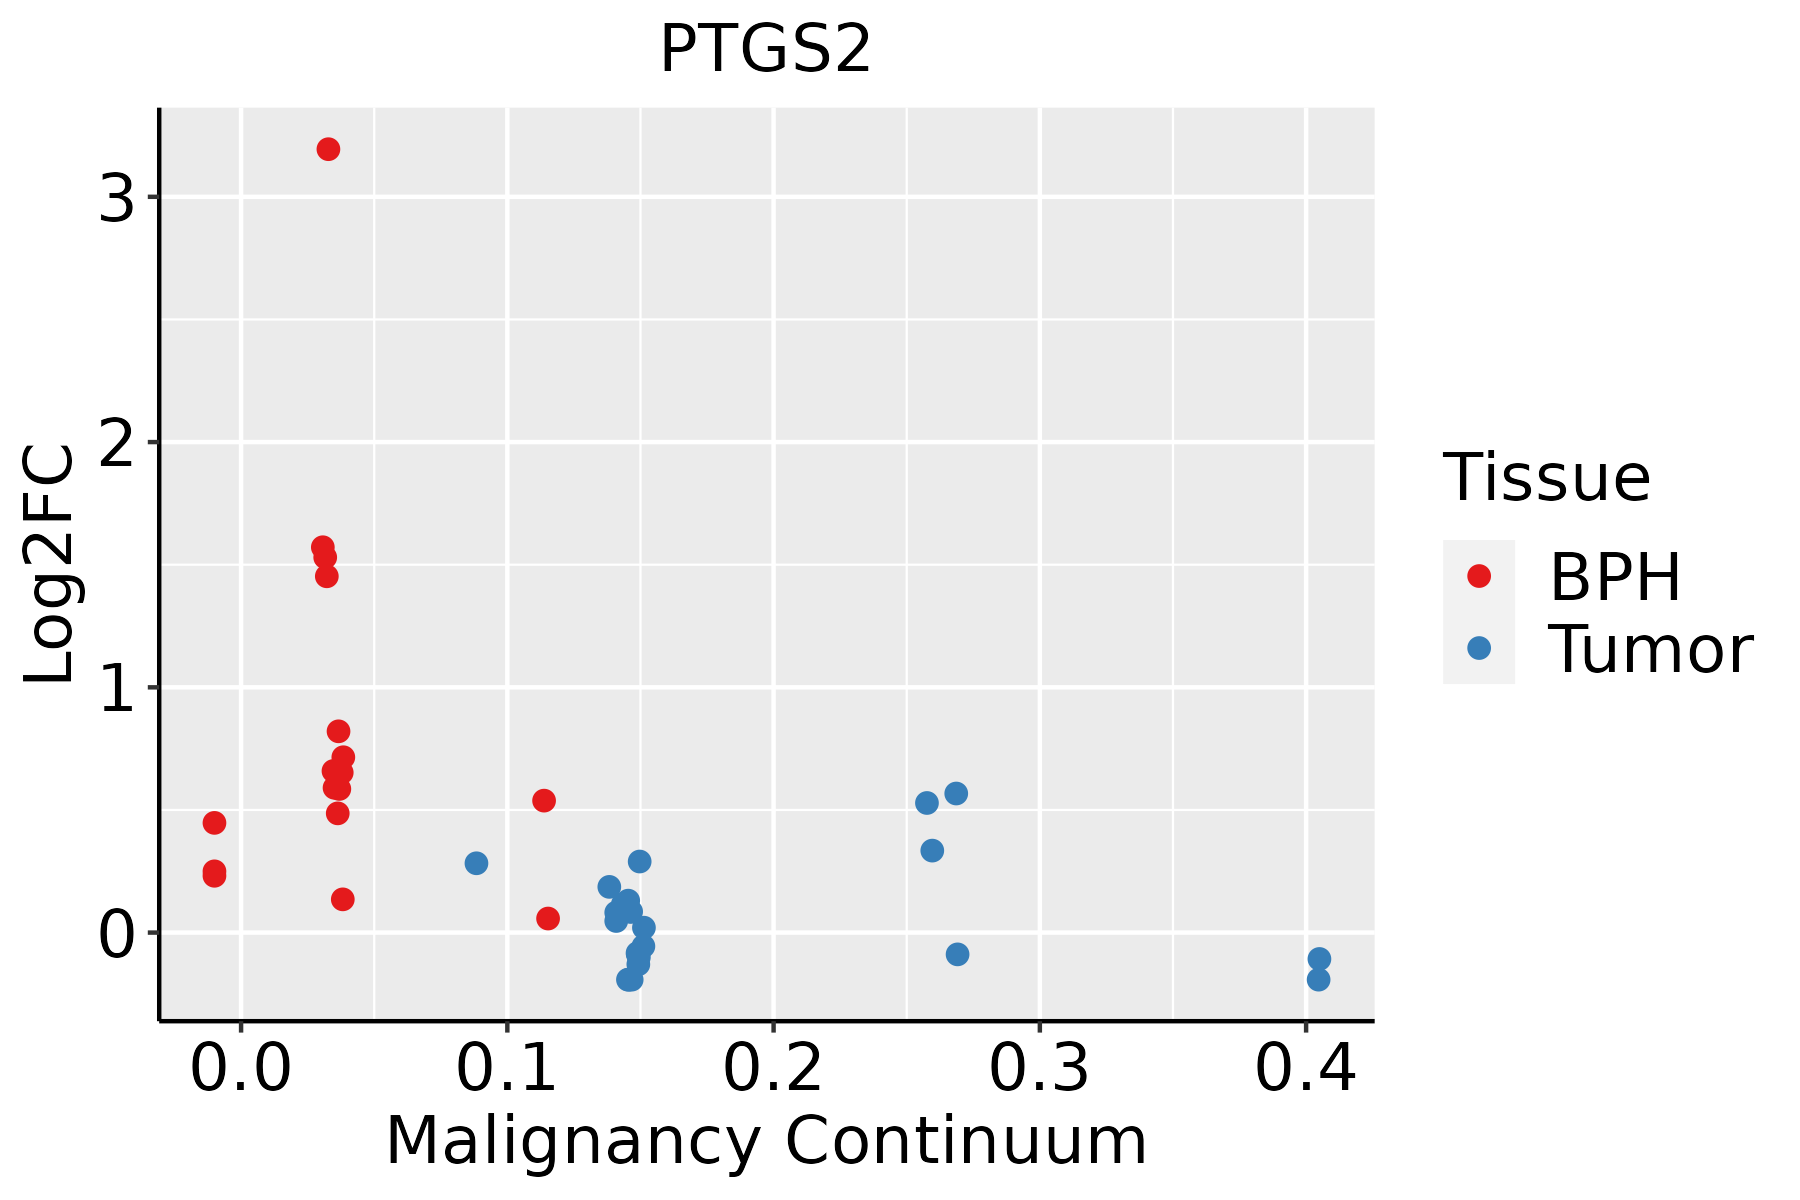 | BPH: Benign Prostatic Hyperplasia |
| ∗log2FC in expression of this searched gene in stem-like cells from each diseased tissue sample relative to stem-like cells in normal samples in each tissue plotted against the malignancy continuum. Samples are colored based on if they are from different disease stage. |
Top |
Malignant transformation related pathway analysis |
| Find out the enriched GO biological processes and KEGG pathways involved in transition from healthy to precancer to cancer |
| Tissue | Disease Stage | Enriched GO biological Processes |
| Colorectum | AD |  |
| Colorectum | SER |  |
| Colorectum | MSS |  |
| Colorectum | MSI-H |  |
| Colorectum | FAP |  |
| ∗Top 15 enriched GO BP terms are showed in the bar plot of each disease state in each tissue. Each row represents a significant GO biological process which is colored according to the -log10(p.adjust). |
| Page: 1 2 3 4 5 6 7 8 9 |
| GO ID | Tissue | Disease Stage | Description | Gene Ratio | Bg Ratio | pvalue | p.adjust | Count |
| GO:0050890 | Prostate | BPH | cognition | 69/3107 | 296/18723 | 1.68e-03 | 9.69e-03 | 69 |
| GO:001407416 | Prostate | BPH | response to purine-containing compound | 39/3107 | 148/18723 | 1.71e-03 | 9.84e-03 | 39 |
| GO:004542810 | Prostate | BPH | regulation of nitric oxide biosynthetic process | 20/3107 | 62/18723 | 1.80e-03 | 1.03e-02 | 20 |
| GO:004668316 | Prostate | BPH | response to organophosphorus | 35/3107 | 131/18723 | 2.23e-03 | 1.23e-02 | 35 |
| GO:000223715 | Prostate | BPH | response to molecule of bacterial origin | 81/3107 | 363/18723 | 2.63e-03 | 1.41e-02 | 81 |
| GO:00455982 | Prostate | BPH | regulation of fat cell differentiation | 36/3107 | 139/18723 | 3.43e-03 | 1.76e-02 | 36 |
| GO:19907763 | Prostate | BPH | response to angiotensin | 11/3107 | 28/18723 | 3.51e-03 | 1.79e-02 | 11 |
| GO:00456005 | Prostate | BPH | positive regulation of fat cell differentiation | 20/3107 | 66/18723 | 4.09e-03 | 2.03e-02 | 20 |
| GO:00714984 | Prostate | BPH | cellular response to fluid shear stress | 9/3107 | 21/18723 | 4.10e-03 | 2.03e-02 | 9 |
| GO:0007611 | Prostate | BPH | learning or memory | 59/3107 | 255/18723 | 4.12e-03 | 2.04e-02 | 59 |
| GO:00601355 | Prostate | BPH | maternal process involved in female pregnancy | 19/3107 | 62/18723 | 4.41e-03 | 2.16e-02 | 19 |
| GO:00714705 | Prostate | BPH | cellular response to osmotic stress | 14/3107 | 41/18723 | 4.75e-03 | 2.27e-02 | 14 |
| GO:00435343 | Prostate | BPH | blood vessel endothelial cell migration | 43/3107 | 176/18723 | 4.79e-03 | 2.29e-02 | 43 |
| GO:000680910 | Prostate | BPH | nitric oxide biosynthetic process | 22/3107 | 76/18723 | 4.96e-03 | 2.34e-02 | 22 |
| GO:00435363 | Prostate | BPH | positive regulation of blood vessel endothelial cell migration | 22/3107 | 76/18723 | 4.96e-03 | 2.34e-02 | 22 |
| GO:00346443 | Prostate | BPH | cellular response to UV | 25/3107 | 90/18723 | 5.18e-03 | 2.43e-02 | 25 |
| GO:004620910 | Prostate | BPH | nitric oxide metabolic process | 23/3107 | 81/18723 | 5.35e-03 | 2.49e-02 | 23 |
| GO:200105710 | Prostate | BPH | reactive nitrogen species metabolic process | 23/3107 | 82/18723 | 6.29e-03 | 2.88e-02 | 23 |
| GO:00094113 | Prostate | BPH | response to UV | 37/3107 | 149/18723 | 6.40e-03 | 2.91e-02 | 37 |
| GO:00423032 | Prostate | BPH | molting cycle | 28/3107 | 107/18723 | 7.85e-03 | 3.43e-02 | 28 |
| Page: 1 2 3 4 5 6 7 8 9 10 11 12 13 14 15 16 17 18 19 20 21 22 23 24 25 26 27 28 29 30 31 32 33 34 35 36 37 38 39 40 41 42 43 44 45 46 47 48 49 50 51 52 53 54 55 |
| Pathway ID | Tissue | Disease Stage | Description | Gene Ratio | Bg Ratio | pvalue | p.adjust | qvalue | Count |
| hsa0501018 | Cervix | CC | Alzheimer disease | 113/1267 | 384/8465 | 9.67e-14 | 3.92e-12 | 2.32e-12 | 113 |
| hsa0502218 | Cervix | CC | Pathways of neurodegeneration - multiple diseases | 128/1267 | 476/8465 | 2.87e-12 | 9.29e-11 | 5.50e-11 | 128 |
| hsa0516720 | Cervix | CC | Kaposi sarcoma-associated herpesvirus infection | 60/1267 | 194/8465 | 9.74e-09 | 1.58e-07 | 9.33e-08 | 60 |
| hsa0516318 | Cervix | CC | Human cytomegalovirus infection | 65/1267 | 225/8465 | 4.59e-08 | 6.47e-07 | 3.83e-07 | 65 |
| hsa0465718 | Cervix | CC | IL-17 signaling pathway | 31/1267 | 94/8465 | 8.71e-06 | 7.43e-05 | 4.39e-05 | 31 |
| hsa0472318 | Cervix | CC | Retrograde endocannabinoid signaling | 42/1267 | 148/8465 | 1.79e-05 | 1.42e-04 | 8.40e-05 | 42 |
| hsa052226 | Cervix | CC | Small cell lung cancer | 29/1267 | 92/8465 | 4.38e-05 | 3.09e-04 | 1.83e-04 | 29 |
| hsa051657 | Cervix | CC | Human papillomavirus infection | 74/1267 | 331/8465 | 1.70e-04 | 1.02e-03 | 6.03e-04 | 74 |
| hsa0514014 | Cervix | CC | Leishmaniasis | 21/1267 | 77/8465 | 3.65e-03 | 1.34e-02 | 7.91e-03 | 21 |
| hsa046686 | Cervix | CC | TNF signaling pathway | 28/1267 | 114/8465 | 4.60e-03 | 1.62e-02 | 9.59e-03 | 28 |
| hsa046254 | Cervix | CC | C-type lectin receptor signaling pathway | 25/1267 | 104/8465 | 9.52e-03 | 2.94e-02 | 1.74e-02 | 25 |
| hsa049218 | Cervix | CC | Oxytocin signaling pathway | 34/1267 | 154/8465 | 1.12e-02 | 3.42e-02 | 2.02e-02 | 34 |
| hsa0501019 | Cervix | CC | Alzheimer disease | 113/1267 | 384/8465 | 9.67e-14 | 3.92e-12 | 2.32e-12 | 113 |
| hsa0502219 | Cervix | CC | Pathways of neurodegeneration - multiple diseases | 128/1267 | 476/8465 | 2.87e-12 | 9.29e-11 | 5.50e-11 | 128 |
| hsa05167110 | Cervix | CC | Kaposi sarcoma-associated herpesvirus infection | 60/1267 | 194/8465 | 9.74e-09 | 1.58e-07 | 9.33e-08 | 60 |
| hsa0516319 | Cervix | CC | Human cytomegalovirus infection | 65/1267 | 225/8465 | 4.59e-08 | 6.47e-07 | 3.83e-07 | 65 |
| hsa0465719 | Cervix | CC | IL-17 signaling pathway | 31/1267 | 94/8465 | 8.71e-06 | 7.43e-05 | 4.39e-05 | 31 |
| hsa0472319 | Cervix | CC | Retrograde endocannabinoid signaling | 42/1267 | 148/8465 | 1.79e-05 | 1.42e-04 | 8.40e-05 | 42 |
| hsa0522213 | Cervix | CC | Small cell lung cancer | 29/1267 | 92/8465 | 4.38e-05 | 3.09e-04 | 1.83e-04 | 29 |
| hsa0516512 | Cervix | CC | Human papillomavirus infection | 74/1267 | 331/8465 | 1.70e-04 | 1.02e-03 | 6.03e-04 | 74 |
| Page: 1 2 3 4 5 6 7 8 9 |
Top |
Cell-cell communication analysis |
| Identification of potential cell-cell interactions between two cell types and their ligand-receptor pairs for different disease states |
| Ligand | Receptor | LRpair | Pathway | Tissue | Disease Stage |
| Page: 1 |
Top |
Single-cell gene regulatory network inference analysis |
| Find out the significant the regulons (TFs) and the target genes of each regulon across cell types for different disease states |
| TF | Cell Type | Tissue | Disease Stage | Target Gene | RSS | Regulon Activity |
| ∗The dot plots of a searched regulon are shown for all cell subpopulations in each disease state of each tissue based on the regulon specific score inferred using pySCENIC and by calculating the average expression. |
| Page: 1 |
Top |
Somatic mutation of malignant transformation related genes |
| Annotation of somatic variants for genes involved in malignant transformation |
| Hugo Symbol | Variant Class | Variant Classification | dbSNP RS | HGVSc | HGVSp | HGVSp Short | SWISSPROT | BIOTYPE | SIFT | PolyPhen | Tumor Sample Barcode | Tissue | Histology | Sex | Age | Stage | Therapy Types | Drugs | Outcome |
| PTGS2 | SNV | Missense_Mutation | novel | c.1298N>A | p.Val433Glu | p.V433E | P35354 | protein_coding | deleterious(0.01) | benign(0.219) | TCGA-A8-A081-01 | Breast | breast invasive carcinoma | Female | >=65 | I/II | Unknown | Unknown | SD |
| PTGS2 | SNV | Missense_Mutation | rs200204426 | c.898G>A | p.Asp300Asn | p.D300N | P35354 | protein_coding | deleterious(0) | probably_damaging(0.954) | TCGA-AN-A046-01 | Breast | breast invasive carcinoma | Female | >=65 | I/II | Unknown | Unknown | SD |
| PTGS2 | SNV | Missense_Mutation | c.112G>A | p.Asp38Asn | p.D38N | P35354 | protein_coding | tolerated(0.1) | benign(0.014) | TCGA-D8-A1J8-01 | Breast | breast invasive carcinoma | Female | >=65 | I/II | Hormone Therapy | nolvadex | SD | |
| PTGS2 | SNV | Missense_Mutation | c.691C>T | p.Arg231Cys | p.R231C | P35354 | protein_coding | deleterious(0) | probably_damaging(1) | TCGA-E9-A1QZ-01 | Breast | breast invasive carcinoma | Female | <65 | I/II | Unknown | Unknown | SD | |
| PTGS2 | SNV | Missense_Mutation | c.297N>A | p.Met99Ile | p.M99I | P35354 | protein_coding | deleterious(0) | possibly_damaging(0.672) | TCGA-EW-A1J5-01 | Breast | breast invasive carcinoma | Female | <65 | I/II | Chemotherapy | adriamycin | SD | |
| PTGS2 | SNV | Missense_Mutation | novel | c.1565G>A | p.Gly522Asp | p.G522D | P35354 | protein_coding | deleterious(0) | probably_damaging(0.998) | TCGA-2W-A8YY-01 | Cervix | cervical & endocervical cancer | Female | <65 | I/II | Chemotherapy | cisplatin | CR |
| PTGS2 | SNV | Missense_Mutation | c.1358G>A | p.Arg453His | p.R453H | P35354 | protein_coding | deleterious(0) | probably_damaging(1) | TCGA-2W-A8YY-01 | Cervix | cervical & endocervical cancer | Female | <65 | I/II | Chemotherapy | cisplatin | CR | |
| PTGS2 | SNV | Missense_Mutation | rs200132172 | c.284G>A | p.Arg95Gln | p.R95Q | P35354 | protein_coding | tolerated(0.11) | benign(0.028) | TCGA-FU-A3HZ-01 | Cervix | cervical & endocervical cancer | Female | <65 | I/II | Chemotherapy | cisplatin | CR |
| PTGS2 | SNV | Missense_Mutation | c.1738N>G | p.Asn580Asp | p.N580D | P35354 | protein_coding | tolerated(0.11) | benign(0.205) | TCGA-AA-3492-01 | Colorectum | colon adenocarcinoma | Female | >=65 | I/II | Unknown | Unknown | SD | |
| PTGS2 | SNV | Missense_Mutation | novel | c.1492N>G | p.Pro498Ala | p.P498A | P35354 | protein_coding | tolerated(0.19) | benign(0.011) | TCGA-AA-3947-01 | Colorectum | colon adenocarcinoma | Female | <65 | I/II | Unknown | Unknown | SD |
| Page: 1 2 3 4 5 6 7 8 |
Top |
Related drugs of malignant transformation related genes |
| Identification of chemicals and drugs interact with genes involved in malignant transfromation |
| (DGIdb 4.0) |
| Entrez ID | Symbol | Category | Interaction Types | Drug Claim Name | Drug Name | PMIDs |
| 5743 | PTGS2 | DRUGGABLE GENOME, ENZYME | Tolmetin | TOLMETIN | ||
| 5743 | PTGS2 | DRUGGABLE GENOME, ENZYME | inhibitor | CHEMBL599 | MELOXICAM | |
| 5743 | PTGS2 | DRUGGABLE GENOME, ENZYME | IBUPROFEN | IBUPROFEN | ||
| 5743 | PTGS2 | DRUGGABLE GENOME, ENZYME | PHENYLBUTAZONE | PHENYLBUTAZONE | ||
| 5743 | PTGS2 | DRUGGABLE GENOME, ENZYME | NEPAFENAC | NEPAFENAC | ||
| 5743 | PTGS2 | DRUGGABLE GENOME, ENZYME | inhibitor | CHEMBL2105683 | NAPROXEN ETEMESIL | |
| 5743 | PTGS2 | DRUGGABLE GENOME, ENZYME | atenolol | ATENOLOL | ||
| 5743 | PTGS2 | DRUGGABLE GENOME, ENZYME | inhibitor | CHEMBL876 | MECLOFENAMATE SODIUM | |
| 5743 | PTGS2 | DRUGGABLE GENOME, ENZYME | OXAPROZIN | OXAPROZIN | ||
| 5743 | PTGS2 | DRUGGABLE GENOME, ENZYME | KETOPROFEN | KETOPROFEN |
| Page: 1 2 3 4 5 6 7 8 9 10 11 12 13 14 15 16 17 18 19 20 21 22 23 24 25 |

Copyright 2023-Present -The University of Texas Health Science Center at Houston |