
|
|||||
|
 | |
| |
| |
| |
| |
| |
|
Gene: DDX5 |
Gene summary for DDX5 |
| Gene information | Species | Human | Gene symbol | DDX5 | Gene ID | 1655 |
| Gene name | DEAD-box helicase 5 | |
| Gene Alias | G17P1 | |
| Cytomap | 17q23.3 | |
| Gene Type | protein-coding | GO ID | GO:0000122 | UniProtAcc | P17844 |
Top |
Malignant transformation analysis |
| Identification of the aberrant gene expression in precancerous and cancerous lesions by comparing the gene expression of stem-like cells in diseased tissues with normal stem cells |
| Entrez ID | Symbol | Replicates | Species | Organ | Tissue | Adj P-value | Log2FC | Malignancy |
| 1655 | DDX5 | GSM4909277 | Human | Breast | Precancer | 6.04e-10 | 7.44e-01 | 0.0177 |
| 1655 | DDX5 | GSM4909286 | Human | Breast | IDC | 1.91e-06 | -7.89e-02 | 0.1081 |
| 1655 | DDX5 | GSM4909287 | Human | Breast | IDC | 4.57e-06 | 1.72e-01 | 0.2057 |
| 1655 | DDX5 | GSM4909289 | Human | Breast | IDC | 4.59e-06 | 4.77e-01 | 0.1064 |
| 1655 | DDX5 | GSM4909291 | Human | Breast | IDC | 7.05e-43 | 7.49e-01 | 0.1753 |
| 1655 | DDX5 | GSM4909293 | Human | Breast | IDC | 9.41e-48 | 6.21e-01 | 0.1581 |
| 1655 | DDX5 | GSM4909294 | Human | Breast | IDC | 2.69e-10 | -2.98e-01 | 0.2022 |
| 1655 | DDX5 | GSM4909295 | Human | Breast | IDC | 2.70e-07 | 3.95e-01 | 0.0898 |
| 1655 | DDX5 | GSM4909296 | Human | Breast | IDC | 2.05e-23 | -6.26e-01 | 0.1524 |
| 1655 | DDX5 | GSM4909297 | Human | Breast | IDC | 6.67e-32 | 2.93e-01 | 0.1517 |
| 1655 | DDX5 | GSM4909298 | Human | Breast | IDC | 4.01e-20 | 4.56e-01 | 0.1551 |
| 1655 | DDX5 | GSM4909299 | Human | Breast | IDC | 1.05e-13 | 4.13e-01 | 0.035 |
| 1655 | DDX5 | GSM4909300 | Human | Breast | IDC | 7.89e-04 | 3.67e-01 | 0.0334 |
| 1655 | DDX5 | GSM4909303 | Human | Breast | IDC | 8.83e-06 | 3.55e-01 | 0.0438 |
| 1655 | DDX5 | GSM4909305 | Human | Breast | IDC | 1.07e-04 | 2.89e-01 | 0.0436 |
| 1655 | DDX5 | GSM4909308 | Human | Breast | IDC | 1.11e-09 | 3.34e-01 | 0.158 |
| 1655 | DDX5 | GSM4909309 | Human | Breast | IDC | 2.01e-02 | 1.52e-01 | 0.0483 |
| 1655 | DDX5 | GSM4909311 | Human | Breast | IDC | 7.49e-41 | -4.51e-01 | 0.1534 |
| 1655 | DDX5 | GSM4909312 | Human | Breast | IDC | 2.41e-11 | -2.73e-01 | 0.1552 |
| 1655 | DDX5 | GSM4909313 | Human | Breast | IDC | 4.24e-03 | 1.64e-01 | 0.0391 |
| Page: 1 2 3 4 5 6 7 8 9 10 11 12 13 14 15 16 |
| Tissue | Expression Dynamics | Abbreviation |
| Breast | 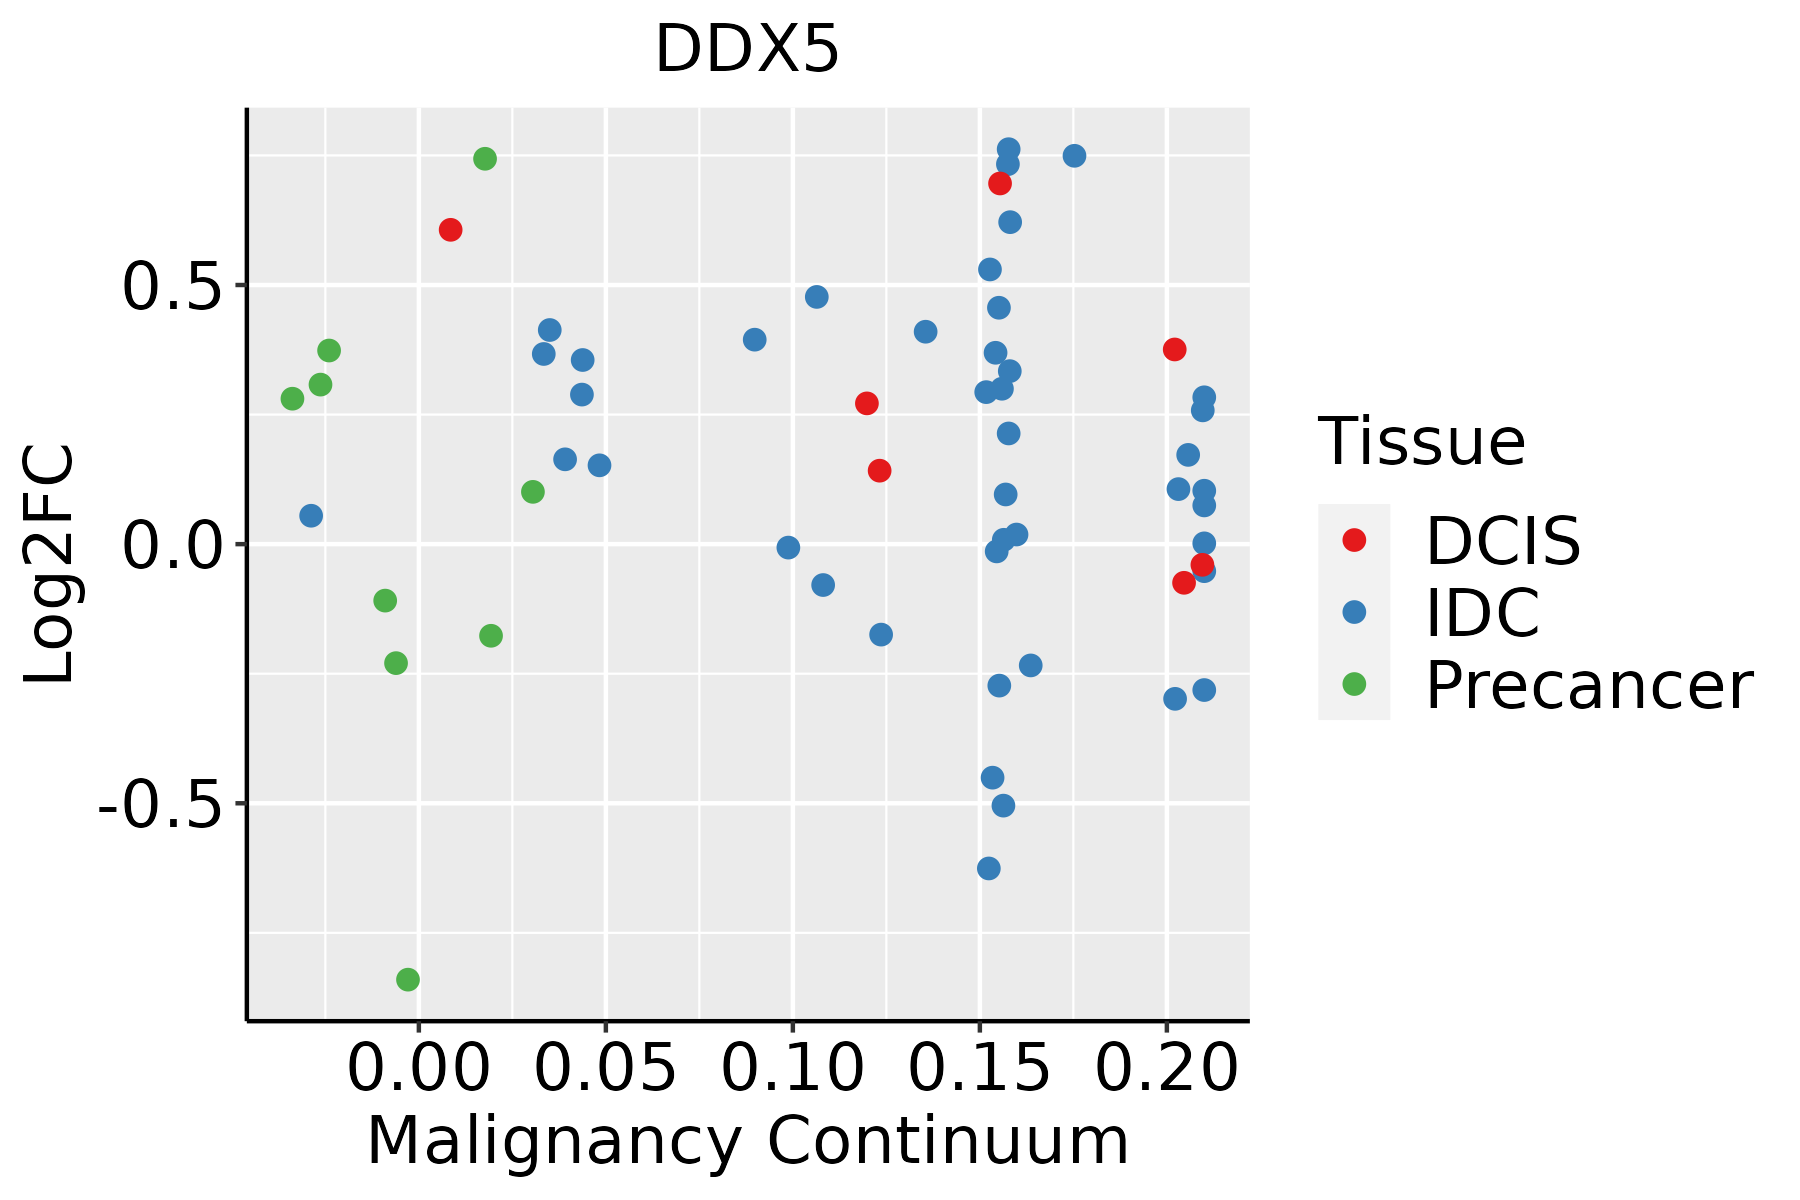 | IDC: Invasive ductal carcinoma |
| DCIS: Ductal carcinoma in situ | ||
| Precancer(BRCA1-mut): Precancerous lesion from BRCA1 mutation carriers | ||
| Cervix |  | CC: Cervix cancer |
| HSIL_HPV: HPV-infected high-grade squamous intraepithelial lesions | ||
| N_HPV: HPV-infected normal cervix | ||
| Colorectum (GSE201348) |  | FAP: Familial adenomatous polyposis |
| CRC: Colorectal cancer | ||
| Colorectum (HTA11) |  | AD: Adenomas |
| SER: Sessile serrated lesions | ||
| MSI-H: Microsatellite-high colorectal cancer | ||
| MSS: Microsatellite stable colorectal cancer | ||
| Endometrium | 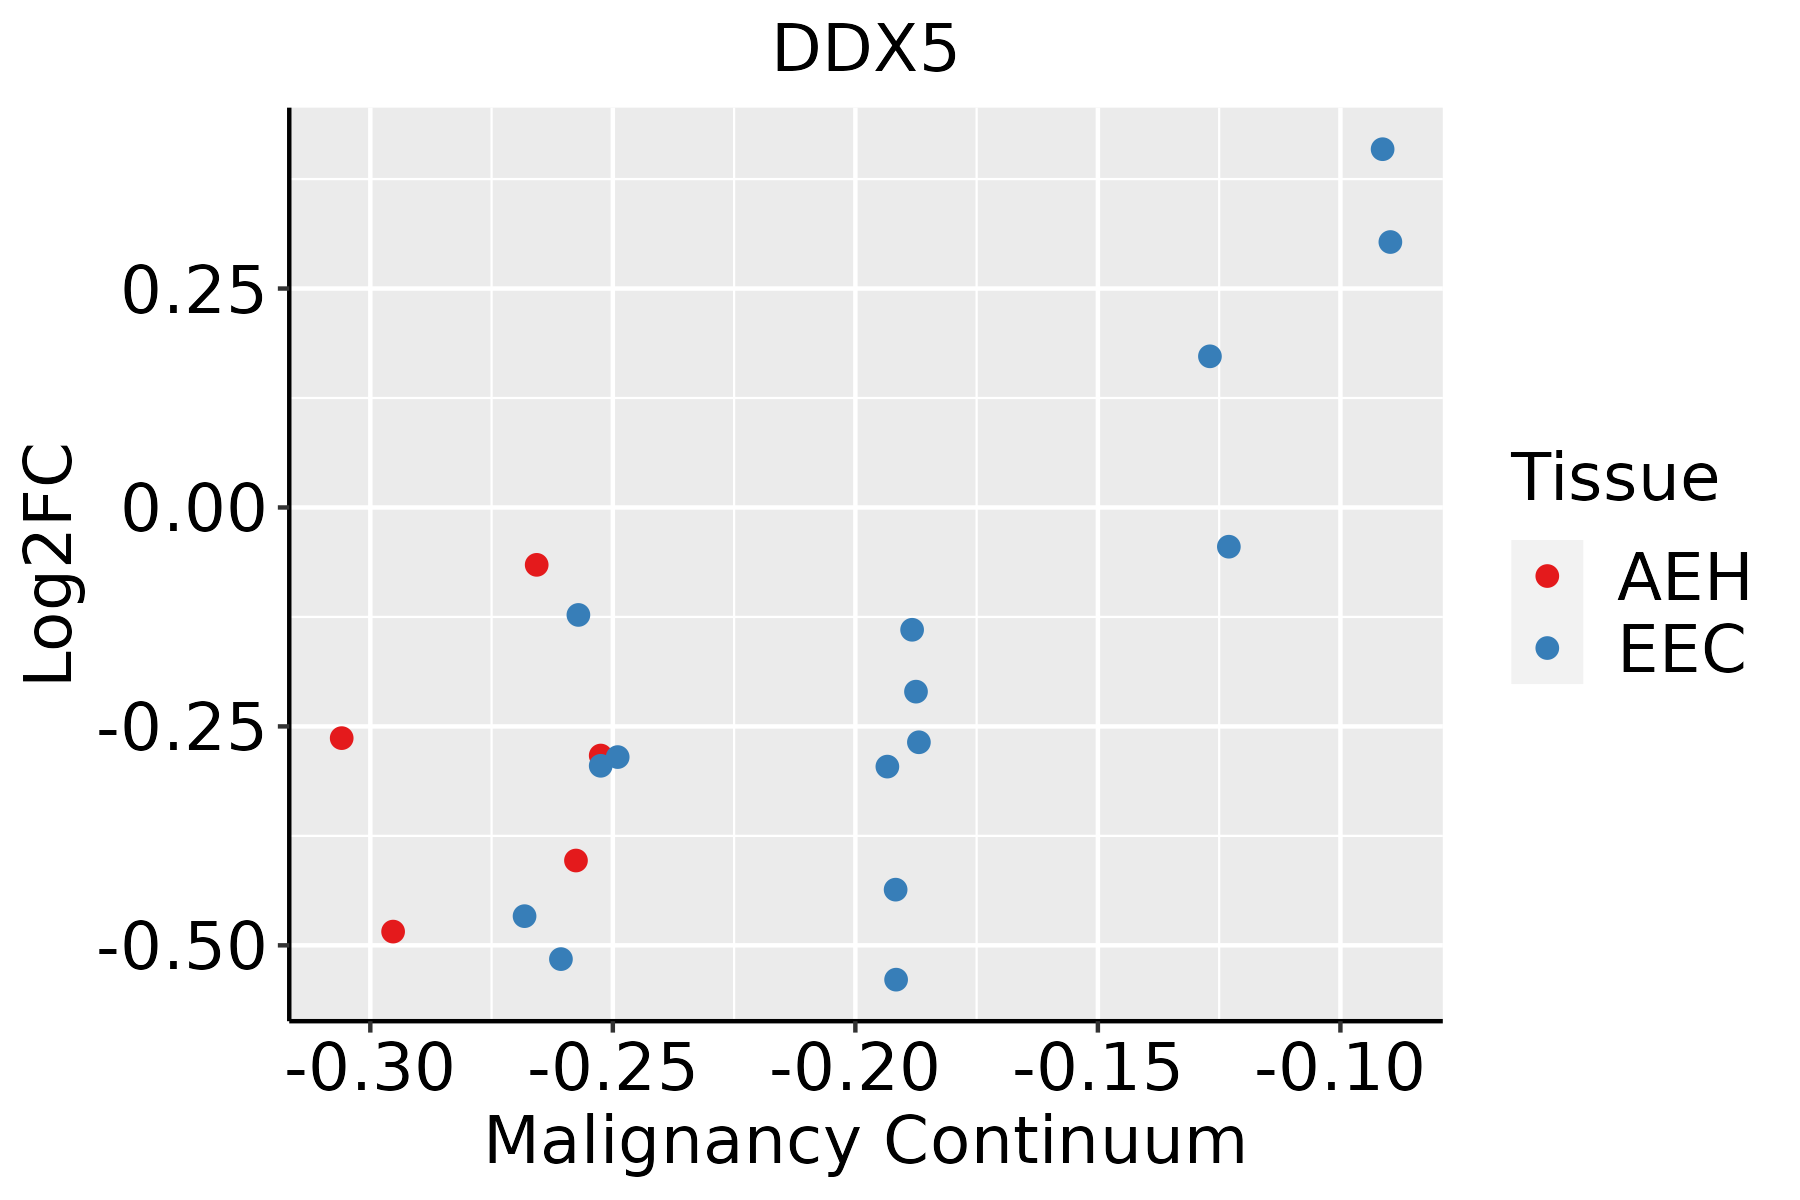 | AEH: Atypical endometrial hyperplasia |
| EEC: Endometrioid Cancer | ||
| Esophagus | 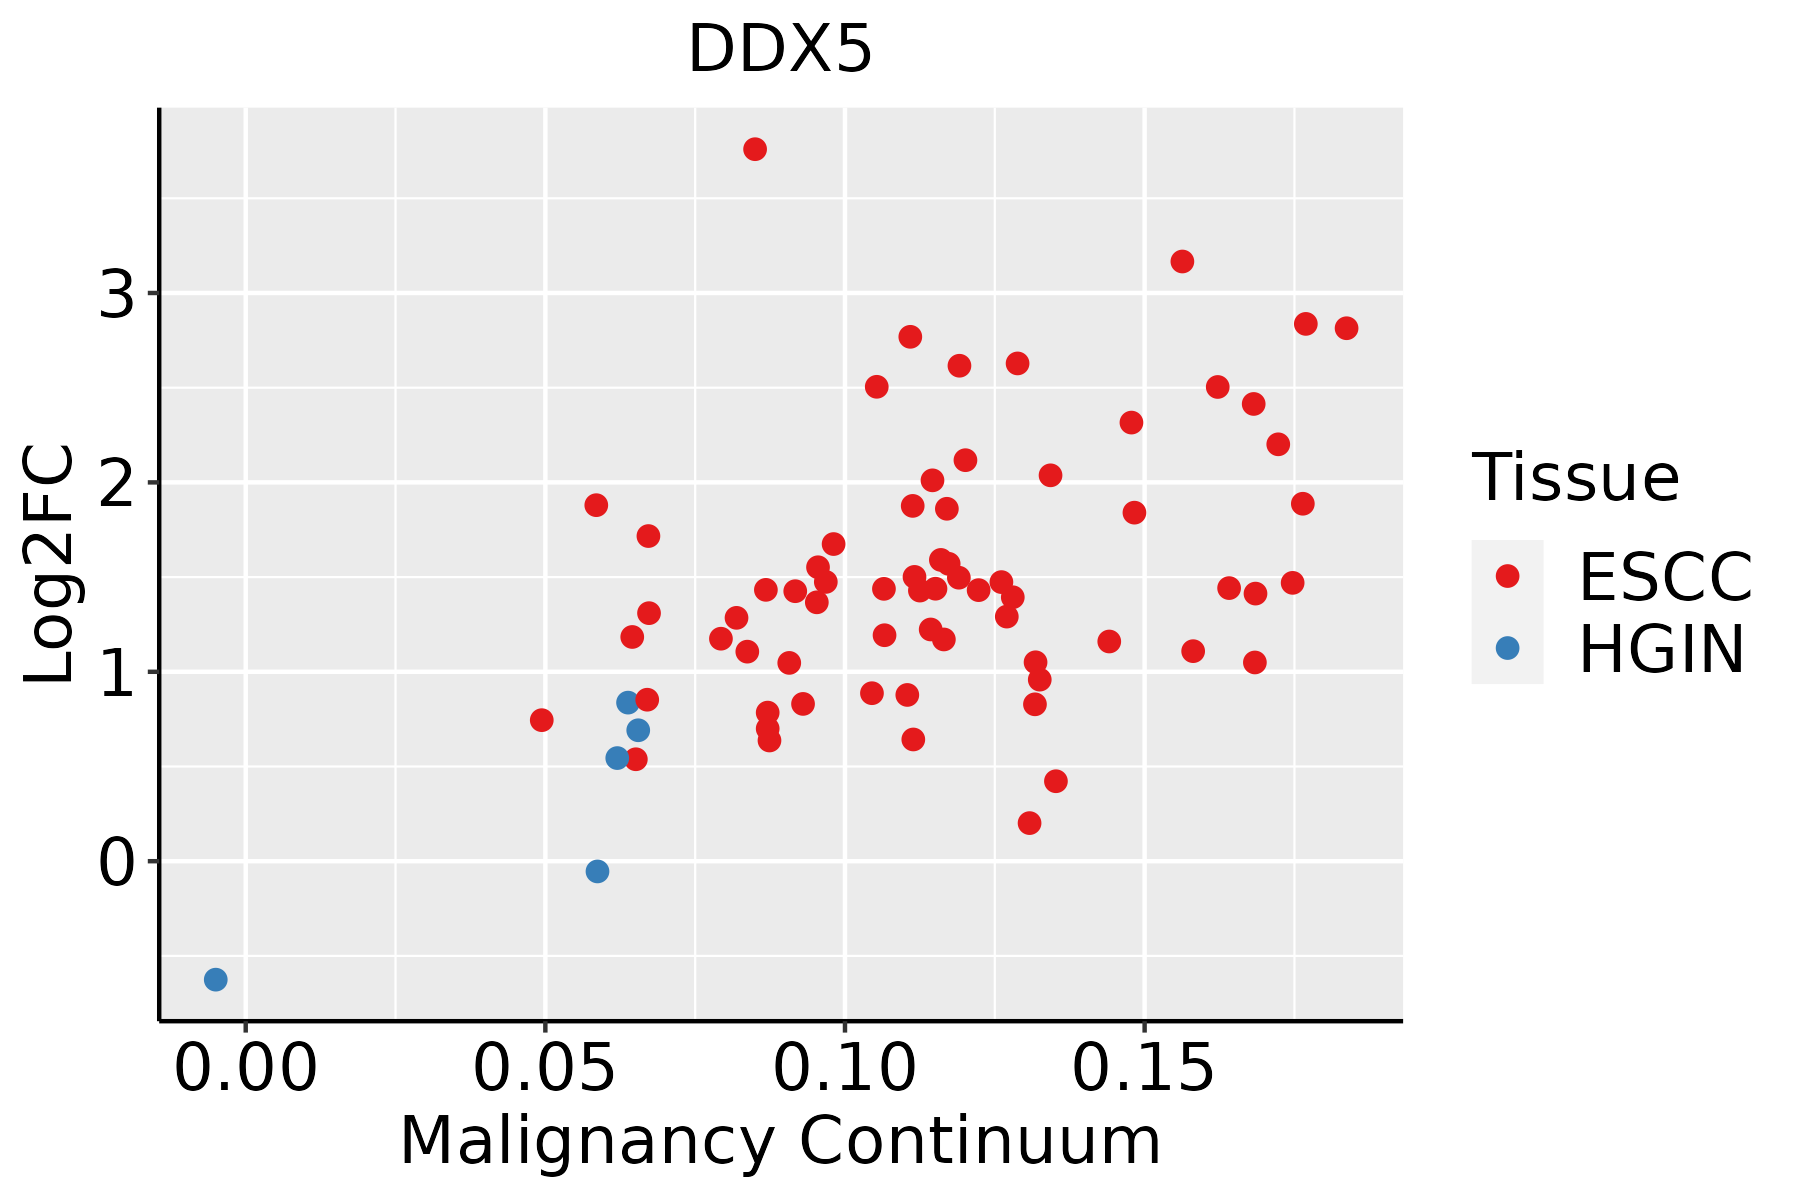 | ESCC: Esophageal squamous cell carcinoma |
| HGIN: High-grade intraepithelial neoplasias | ||
| LGIN: Low-grade intraepithelial neoplasias | ||
| Liver | 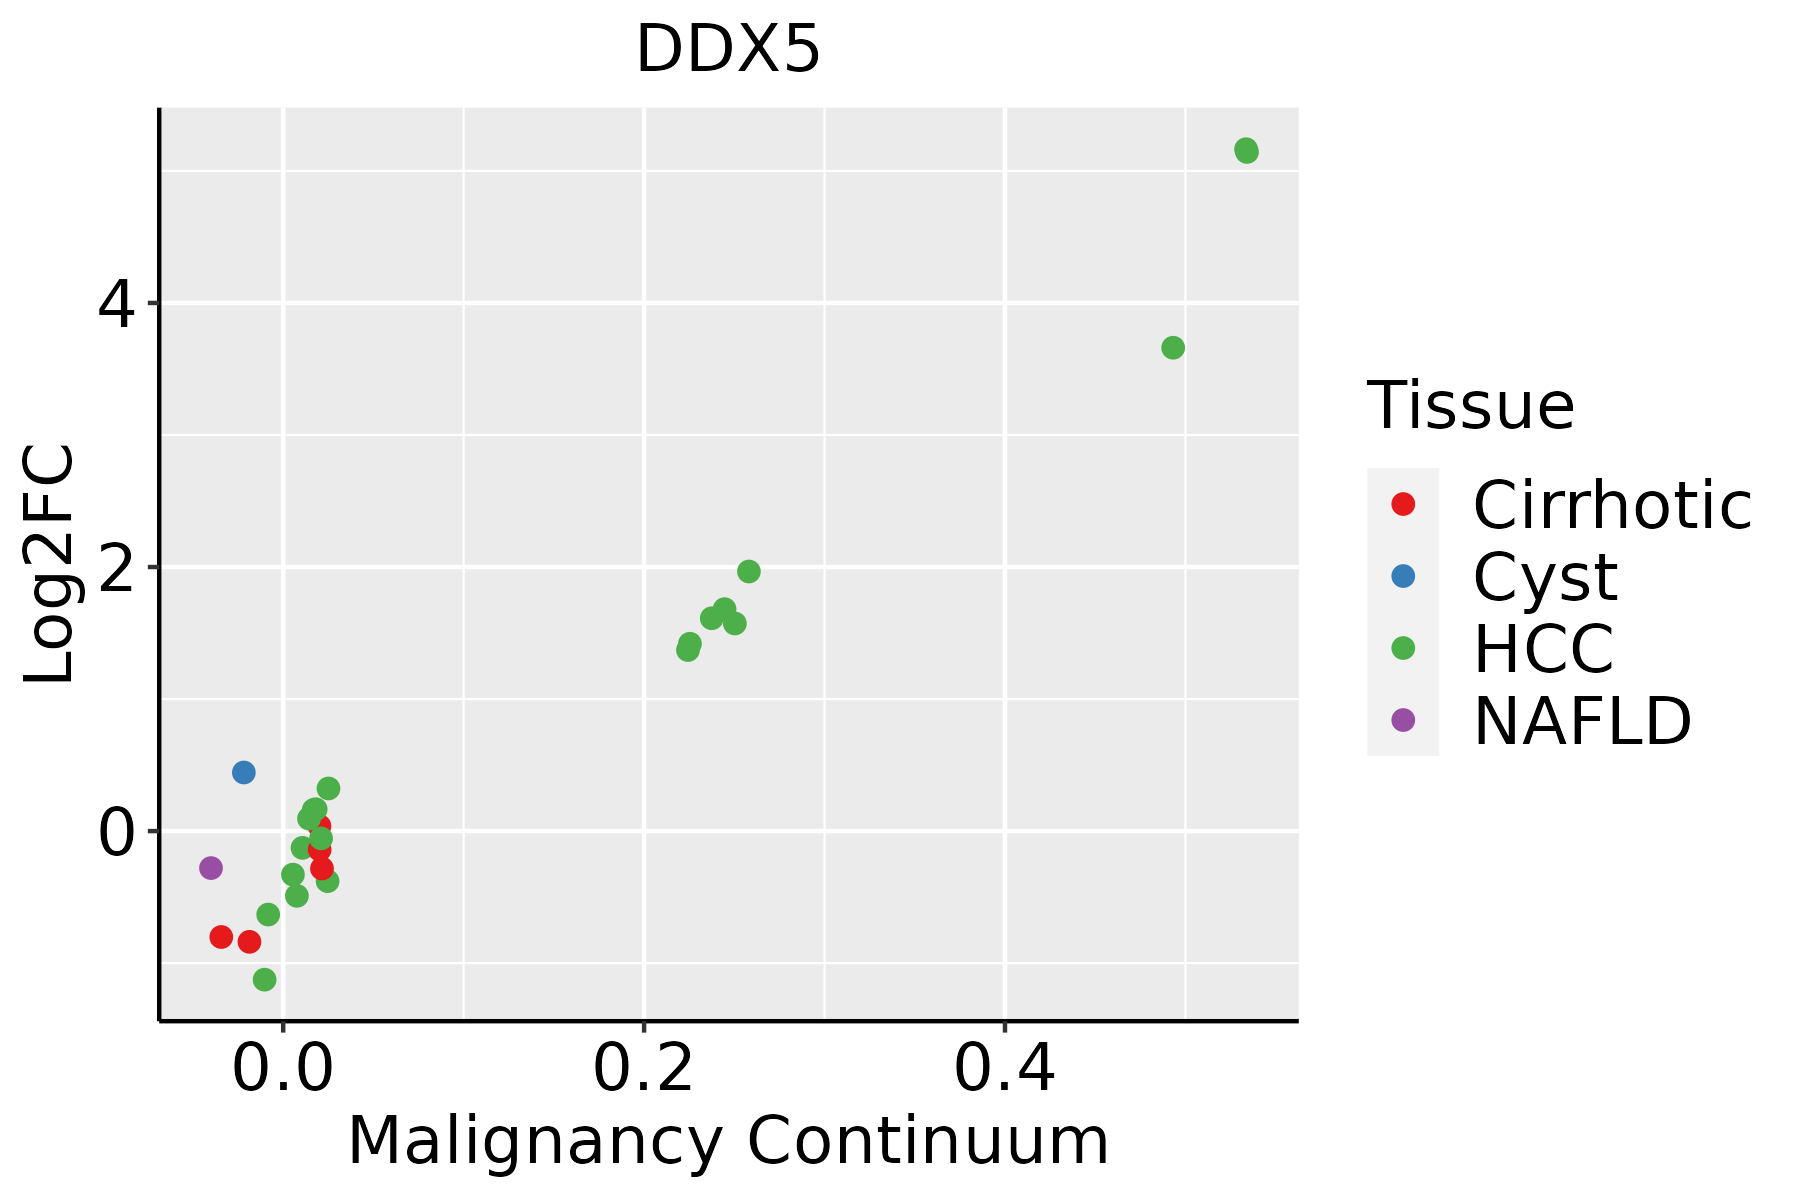 | HCC: Hepatocellular carcinoma |
| NAFLD: Non-alcoholic fatty liver disease | ||
| Lung | 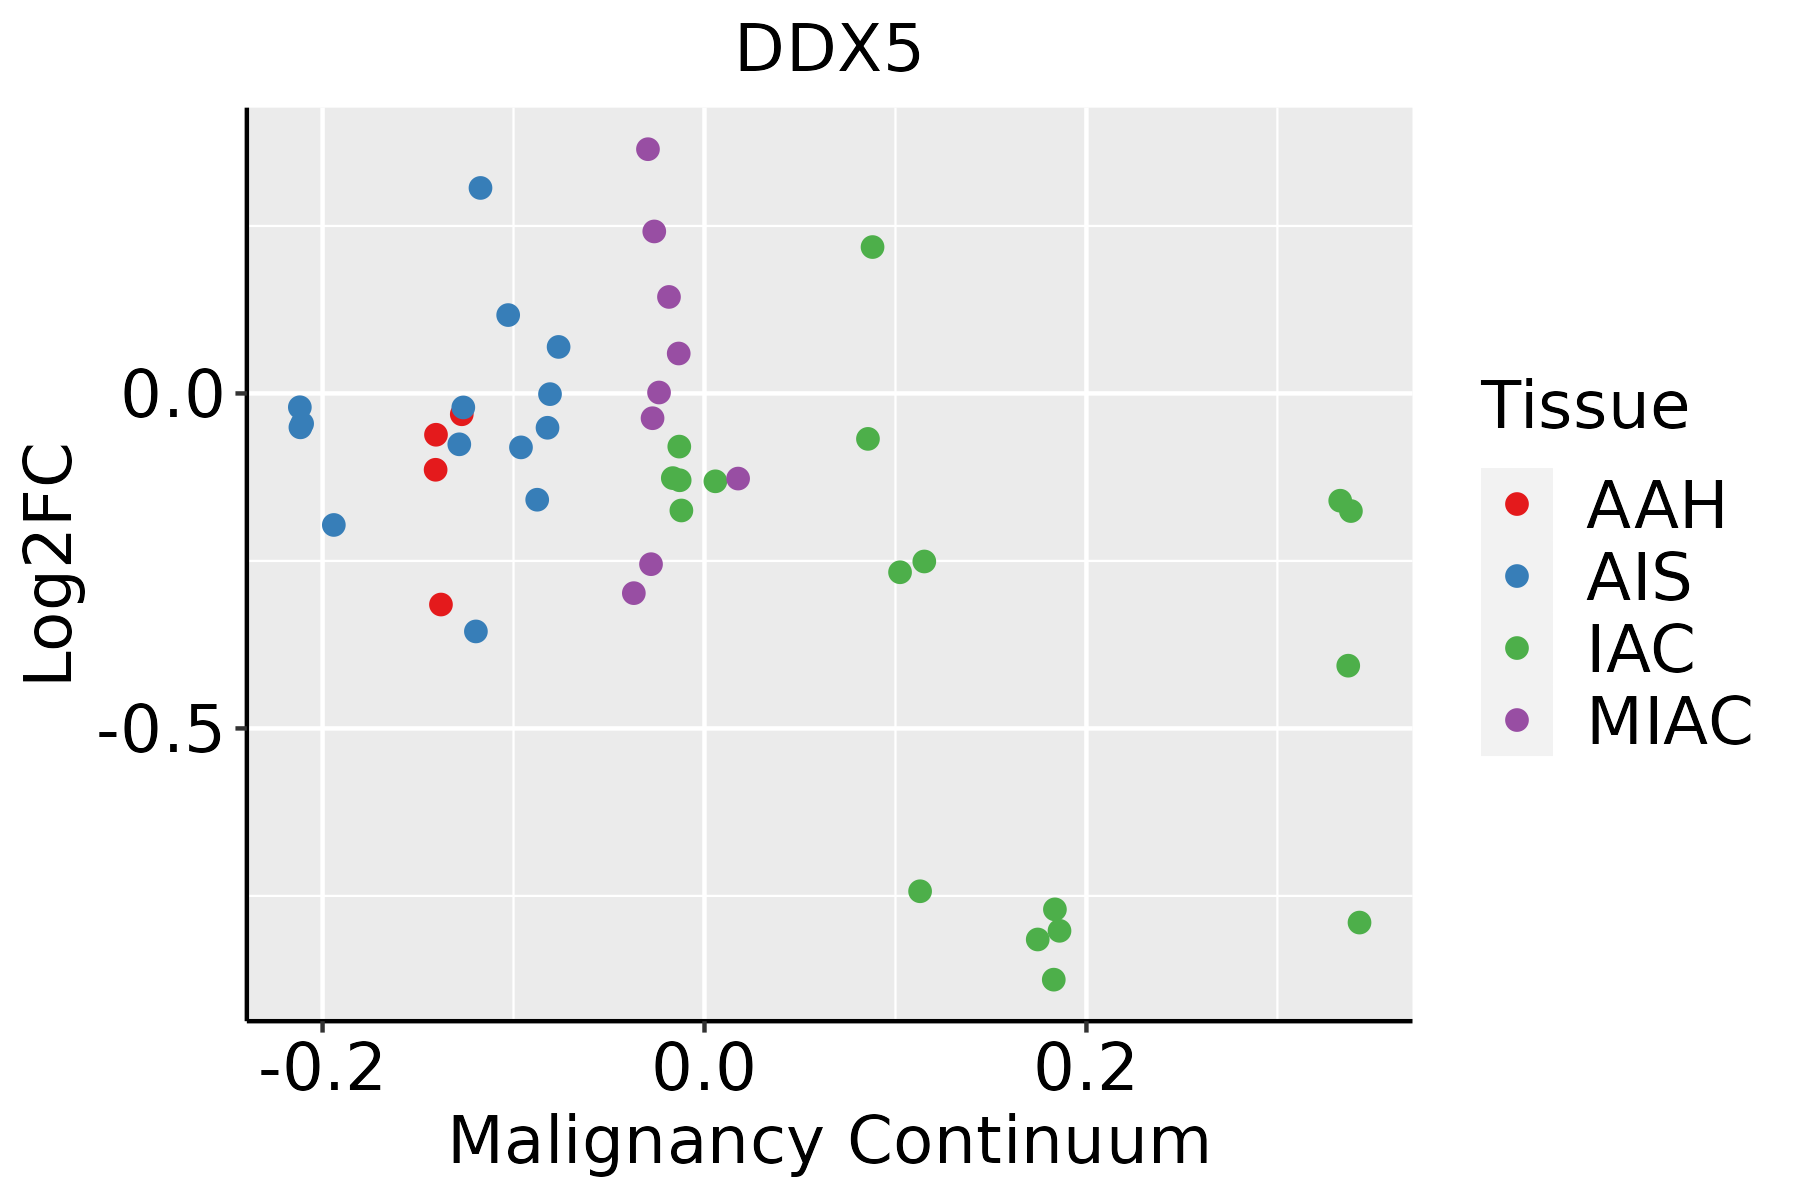 | AAH: Atypical adenomatous hyperplasia |
| AIS: Adenocarcinoma in situ | ||
| IAC: Invasive lung adenocarcinoma | ||
| MIA: Minimally invasive adenocarcinoma | ||
| Oral Cavity | 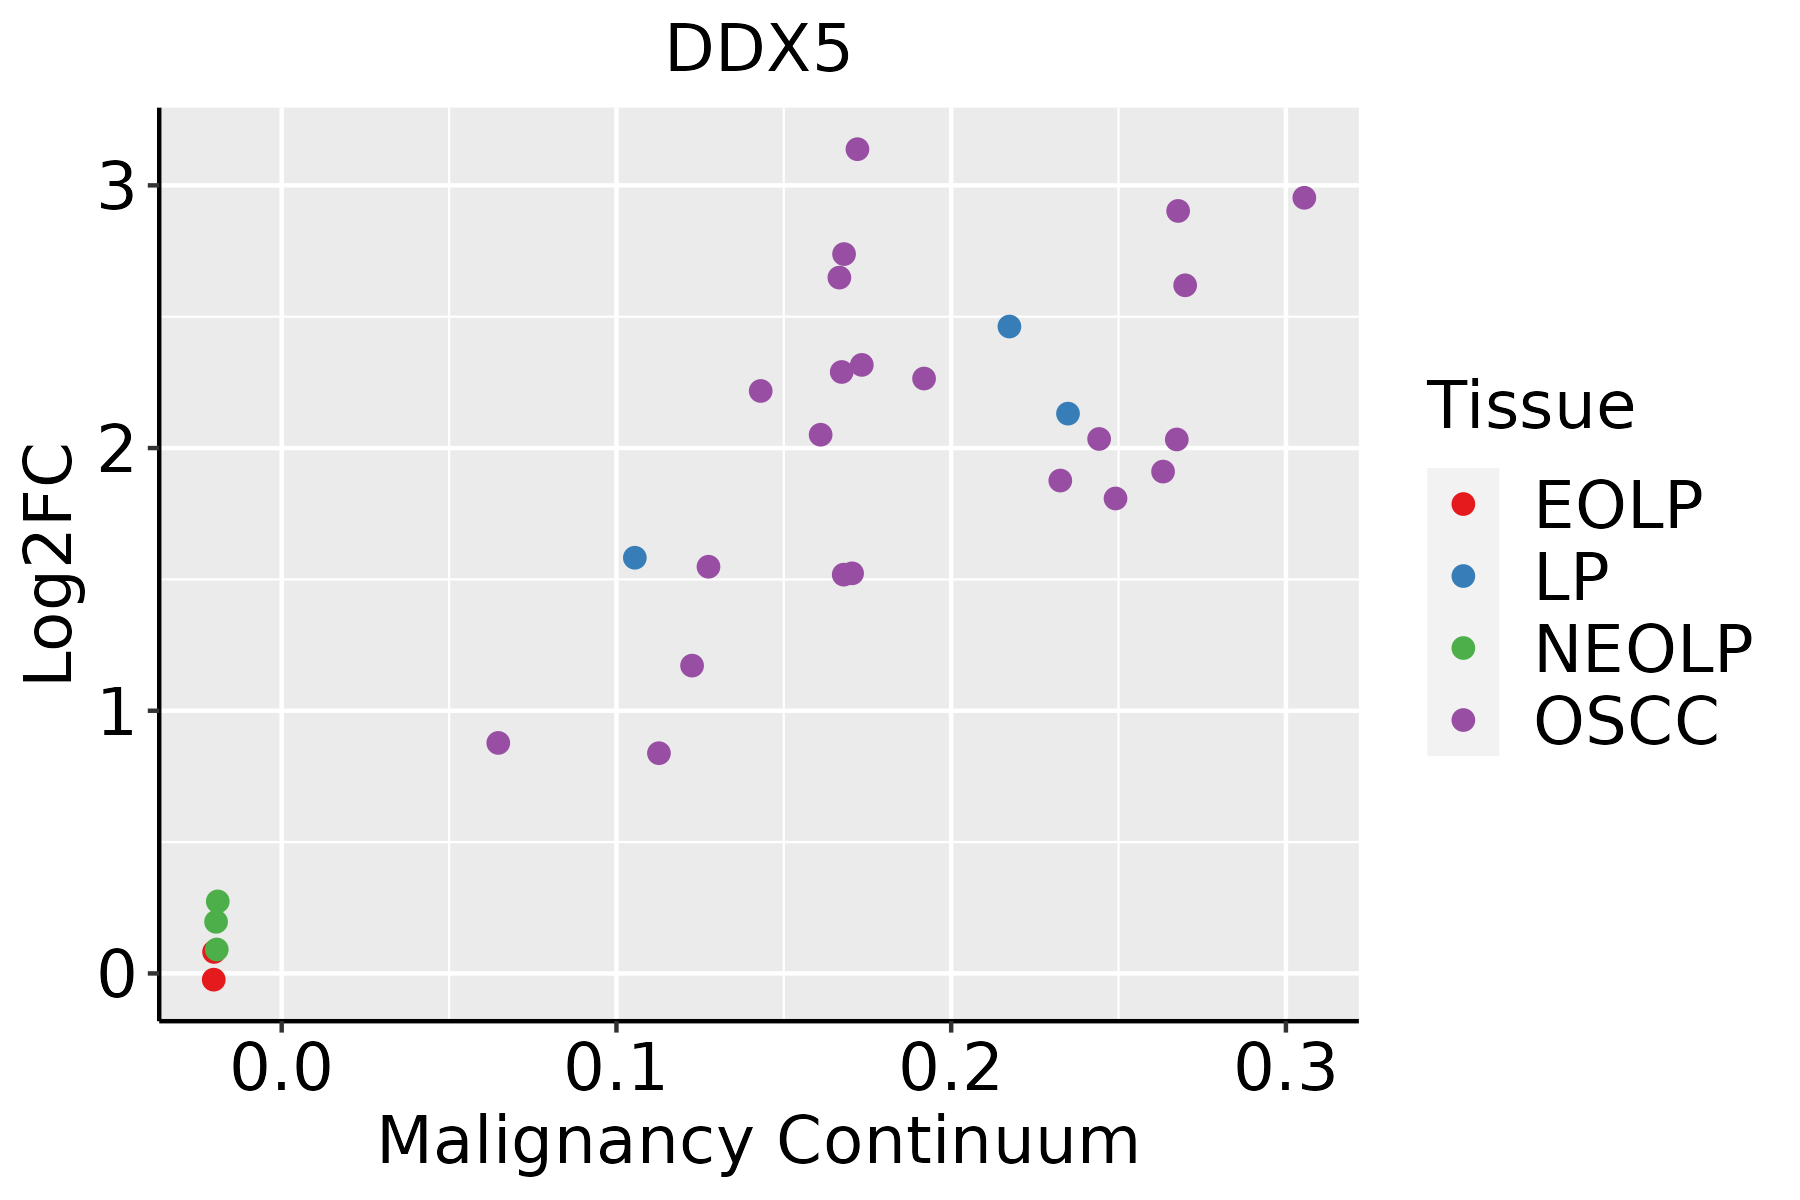 | EOLP: Erosive Oral lichen planus |
| LP: leukoplakia | ||
| NEOLP: Non-erosive oral lichen planus | ||
| OSCC: Oral squamous cell carcinoma | ||
| Prostate | 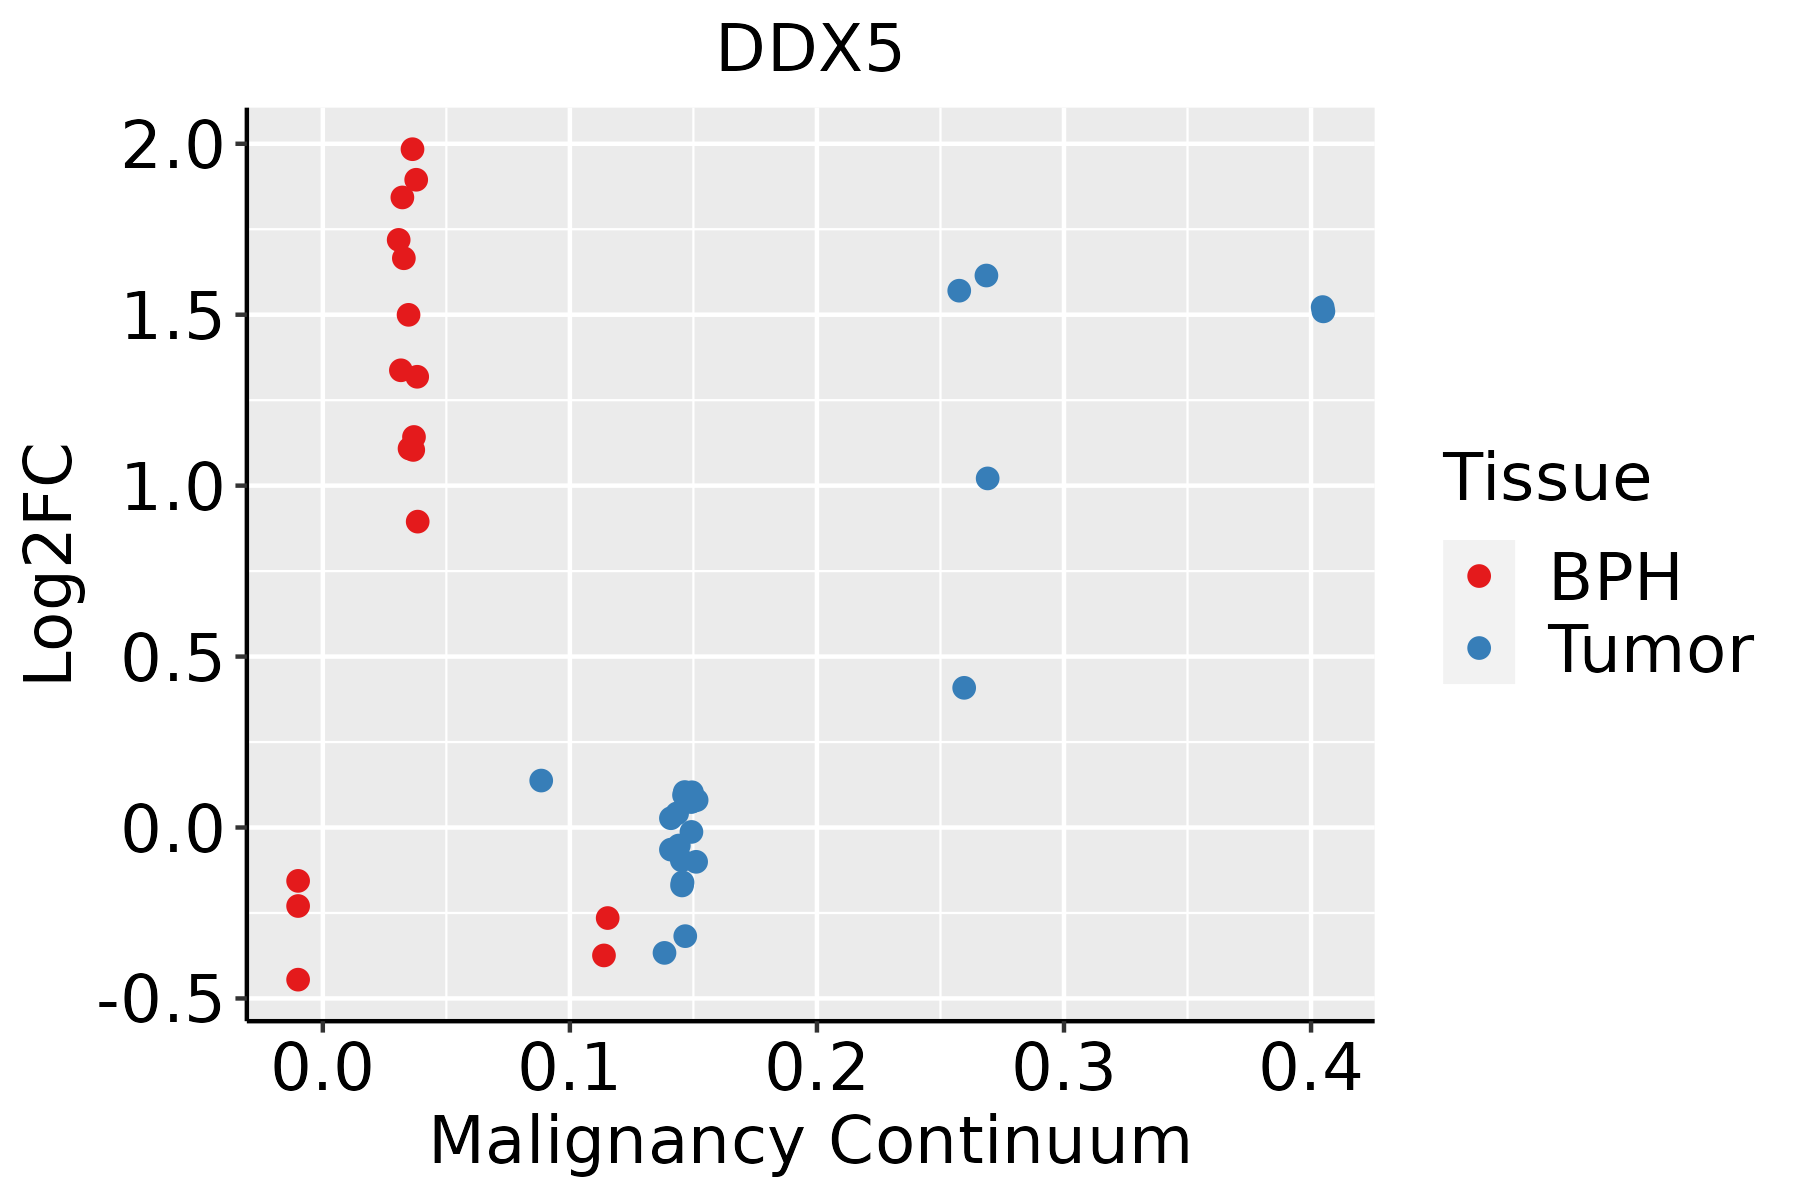 | BPH: Benign Prostatic Hyperplasia |
| Skin | 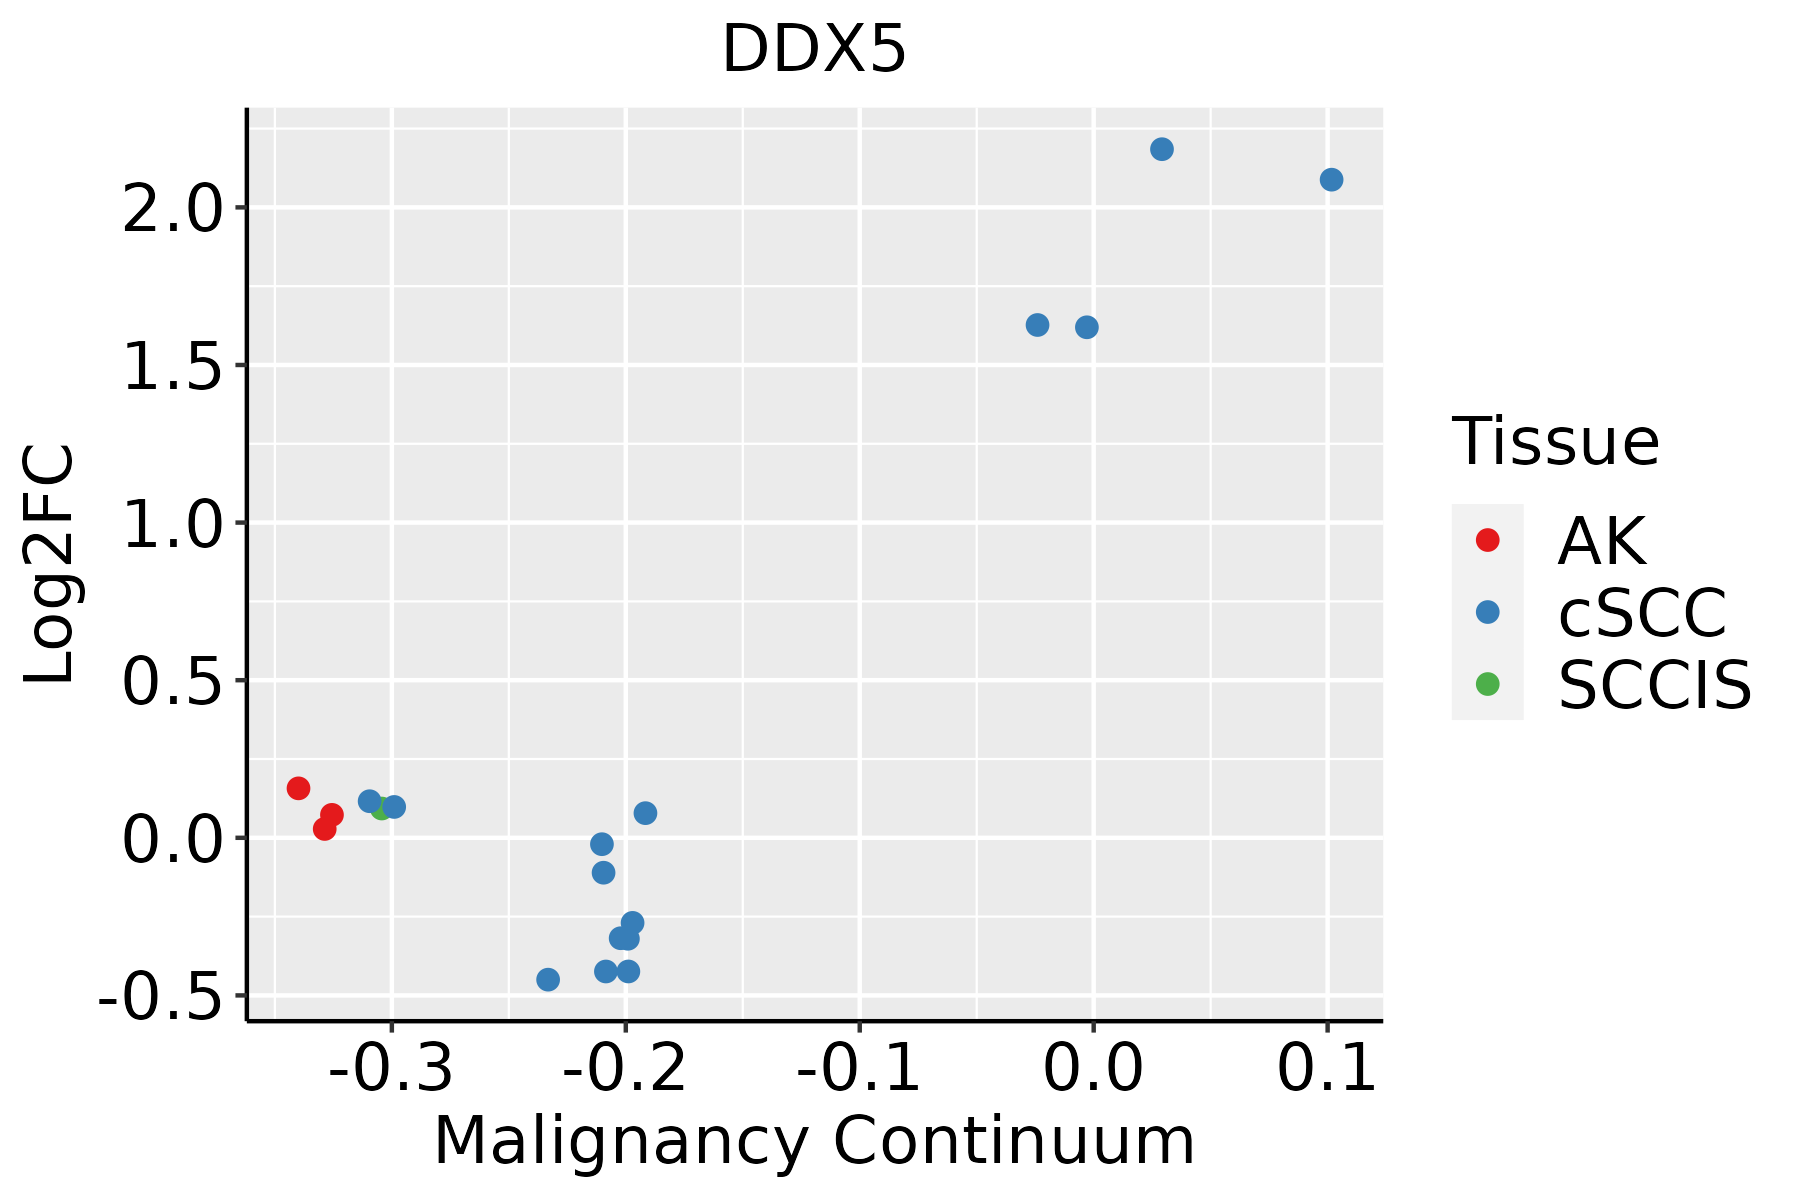 | AK: Actinic keratosis |
| cSCC: Cutaneous squamous cell carcinoma | ||
| SCCIS:squamous cell carcinoma in situ | ||
| Thyroid | 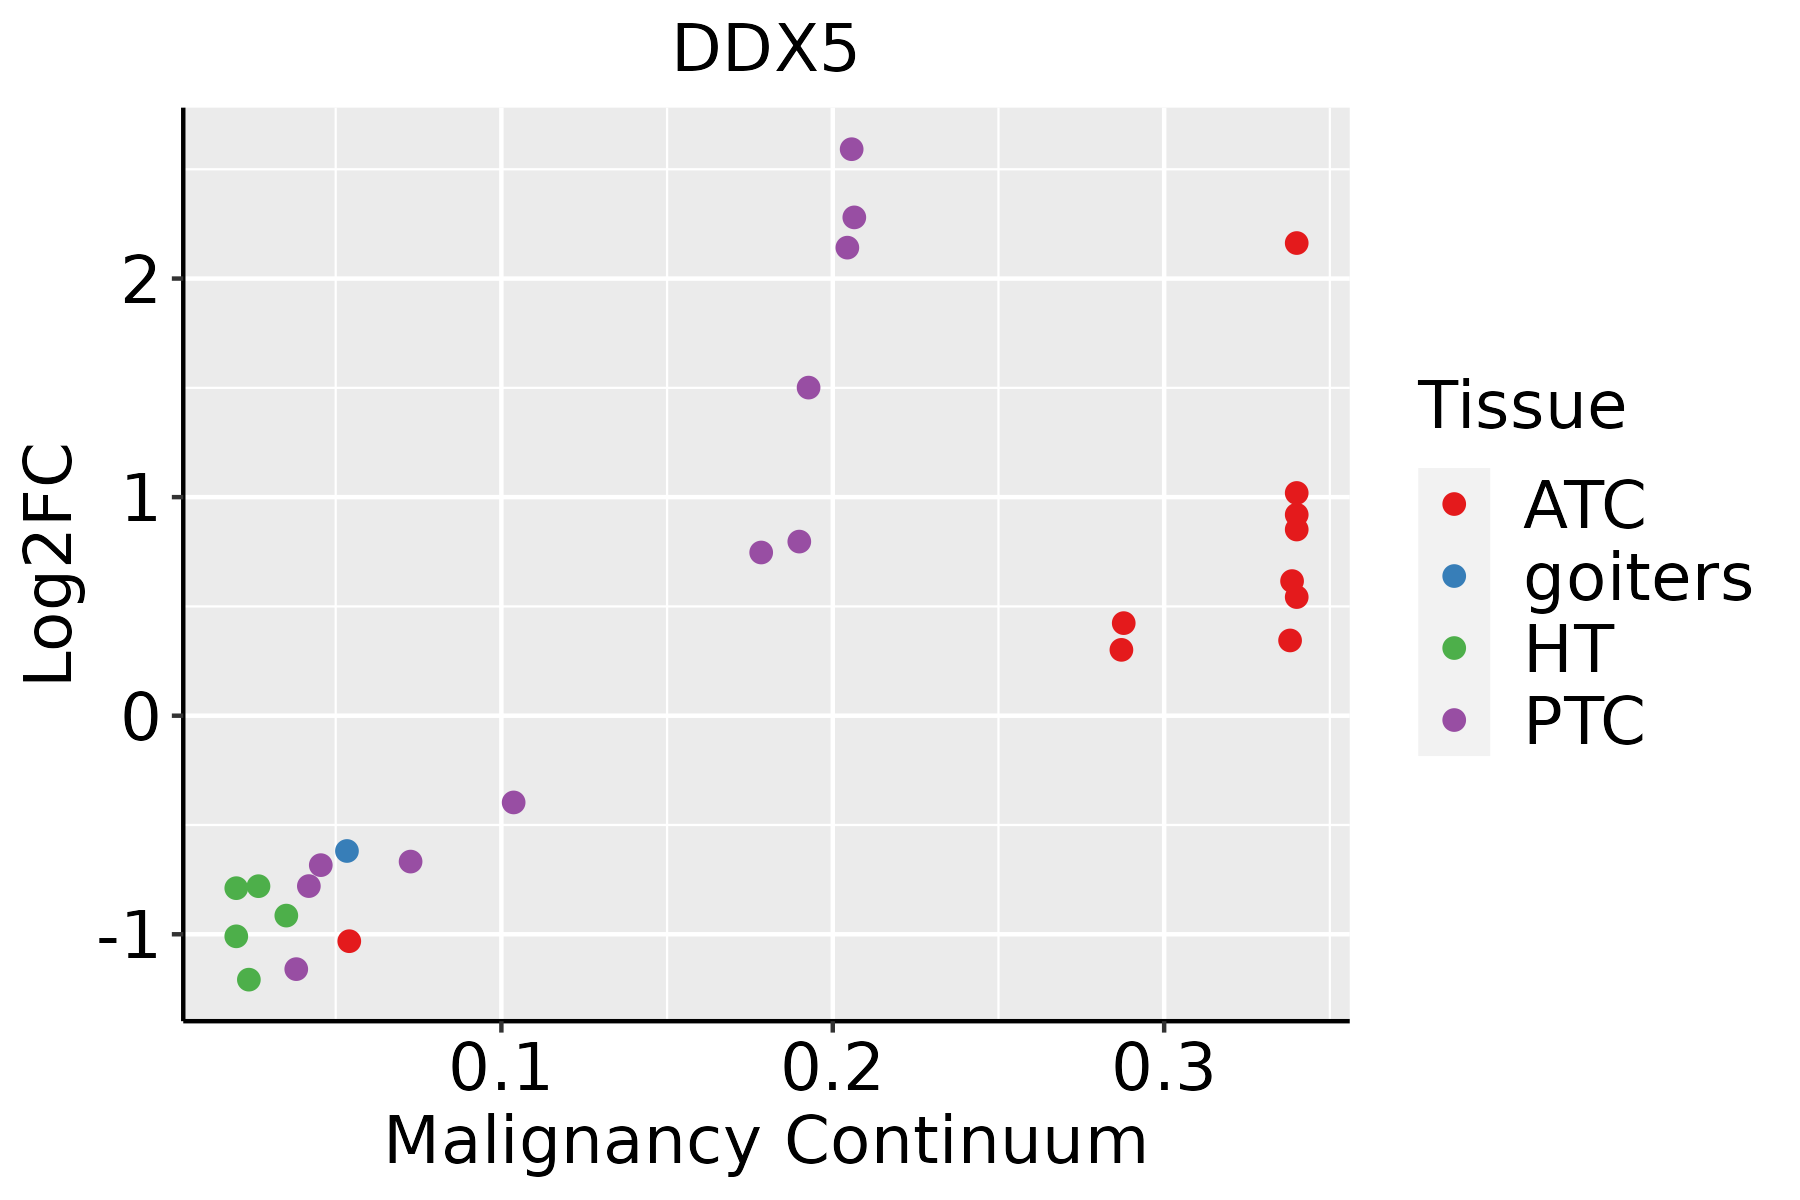 | ATC: Anaplastic thyroid cancer |
| HT: Hashimoto's thyroiditis | ||
| PTC: Papillary thyroid cancer |
| ∗log2FC in expression of this searched gene in stem-like cells from each diseased tissue sample relative to stem-like cells in normal samples in each tissue plotted against the malignancy continuum. Samples are colored based on if they are from different disease stage. |
Top |
Malignant transformation related pathway analysis |
| Find out the enriched GO biological processes and KEGG pathways involved in transition from healthy to precancer to cancer |
| Tissue | Disease Stage | Enriched GO biological Processes |
| Colorectum | AD |  |
| Colorectum | SER |  |
| Colorectum | MSS |  |
| Colorectum | MSI-H |  |
| Colorectum | FAP |  |
| ∗Top 15 enriched GO BP terms are showed in the bar plot of each disease state in each tissue. Each row represents a significant GO biological process which is colored according to the -log10(p.adjust). |
| Page: 1 2 3 4 5 6 7 8 9 |
| GO ID | Tissue | Disease Stage | Description | Gene Ratio | Bg Ratio | pvalue | p.adjust | Count |
| GO:001607212 | Liver | HCC | rRNA metabolic process | 193/7958 | 236/18723 | 1.26e-35 | 1.14e-32 | 193 |
| GO:000636421 | Liver | HCC | rRNA processing | 185/7958 | 225/18723 | 8.14e-35 | 6.45e-32 | 185 |
| GO:00346601 | Liver | HCC | ncRNA metabolic process | 332/7958 | 485/18723 | 1.48e-31 | 7.80e-29 | 332 |
| GO:001603222 | Liver | HCC | viral process | 286/7958 | 415/18723 | 4.41e-28 | 1.86e-25 | 286 |
| GO:004427021 | Liver | HCC | cellular nitrogen compound catabolic process | 303/7958 | 451/18723 | 9.76e-27 | 3.64e-24 | 303 |
| GO:004670021 | Liver | HCC | heterocycle catabolic process | 299/7958 | 445/18723 | 2.07e-26 | 7.29e-24 | 299 |
| GO:190136121 | Liver | HCC | organic cyclic compound catabolic process | 325/7958 | 495/18723 | 6.52e-26 | 2.18e-23 | 325 |
| GO:001943921 | Liver | HCC | aromatic compound catabolic process | 309/7958 | 467/18723 | 1.56e-25 | 4.94e-23 | 309 |
| GO:000037522 | Liver | HCC | RNA splicing, via transesterification reactions | 228/7958 | 324/18723 | 1.47e-24 | 4.06e-22 | 228 |
| GO:000640121 | Liver | HCC | RNA catabolic process | 201/7958 | 278/18723 | 3.88e-24 | 1.02e-21 | 201 |
| GO:003465521 | Liver | HCC | nucleobase-containing compound catabolic process | 273/7958 | 407/18723 | 4.84e-24 | 1.23e-21 | 273 |
| GO:000037722 | Liver | HCC | RNA splicing, via transesterification reactions with bulged adenosine as nucleophile | 224/7958 | 320/18723 | 1.16e-23 | 2.62e-21 | 224 |
| GO:000039822 | Liver | HCC | mRNA splicing, via spliceosome | 224/7958 | 320/18723 | 1.16e-23 | 2.62e-21 | 224 |
| GO:190331121 | Liver | HCC | regulation of mRNA metabolic process | 205/7958 | 288/18723 | 3.38e-23 | 6.90e-21 | 205 |
| GO:000640221 | Liver | HCC | mRNA catabolic process | 169/7958 | 232/18723 | 4.50e-21 | 6.96e-19 | 169 |
| GO:001905822 | Liver | HCC | viral life cycle | 209/7958 | 317/18723 | 2.05e-17 | 2.09e-15 | 209 |
| GO:004348422 | Liver | HCC | regulation of RNA splicing | 113/7958 | 148/18723 | 4.32e-17 | 4.15e-15 | 113 |
| GO:005068421 | Liver | HCC | regulation of mRNA processing | 106/7958 | 137/18723 | 7.64e-17 | 7.12e-15 | 106 |
| GO:004227422 | Liver | HCC | ribosomal small subunit biogenesis | 65/7958 | 73/18723 | 1.09e-16 | 9.92e-15 | 65 |
| GO:009719322 | Liver | HCC | intrinsic apoptotic signaling pathway | 184/7958 | 288/18723 | 1.50e-13 | 8.32e-12 | 184 |
| Page: 1 2 3 4 5 6 7 8 9 10 11 12 13 14 15 16 17 18 19 20 21 22 23 24 25 26 27 28 29 30 31 32 33 34 35 36 37 38 39 40 41 42 43 44 45 46 47 48 49 50 51 52 53 54 55 56 57 58 59 60 61 62 63 64 65 66 67 68 69 70 71 72 73 74 75 76 77 78 79 80 81 82 83 84 85 86 87 88 89 90 91 92 93 94 95 96 97 98 99 100 101 102 103 104 105 106 |
| Pathway ID | Tissue | Disease Stage | Description | Gene Ratio | Bg Ratio | pvalue | p.adjust | qvalue | Count |
| hsa0520523 | Breast | IDC | Proteoglycans in cancer | 42/867 | 205/8465 | 7.69e-06 | 9.99e-05 | 7.48e-05 | 42 |
| hsa0304023 | Breast | IDC | Spliceosome | 40/867 | 217/8465 | 1.53e-04 | 1.42e-03 | 1.06e-03 | 40 |
| hsa0520533 | Breast | IDC | Proteoglycans in cancer | 42/867 | 205/8465 | 7.69e-06 | 9.99e-05 | 7.48e-05 | 42 |
| hsa0304033 | Breast | IDC | Spliceosome | 40/867 | 217/8465 | 1.53e-04 | 1.42e-03 | 1.06e-03 | 40 |
| hsa0520542 | Breast | DCIS | Proteoglycans in cancer | 39/846 | 205/8465 | 5.36e-05 | 5.58e-04 | 4.11e-04 | 39 |
| hsa0304043 | Breast | DCIS | Spliceosome | 40/846 | 217/8465 | 8.97e-05 | 8.52e-04 | 6.28e-04 | 40 |
| hsa0520552 | Breast | DCIS | Proteoglycans in cancer | 39/846 | 205/8465 | 5.36e-05 | 5.58e-04 | 4.11e-04 | 39 |
| hsa0304053 | Breast | DCIS | Spliceosome | 40/846 | 217/8465 | 8.97e-05 | 8.52e-04 | 6.28e-04 | 40 |
| hsa0520516 | Cervix | CC | Proteoglycans in cancer | 60/1267 | 205/8465 | 9.13e-08 | 1.18e-06 | 7.00e-07 | 60 |
| hsa0520517 | Cervix | CC | Proteoglycans in cancer | 60/1267 | 205/8465 | 9.13e-08 | 1.18e-06 | 7.00e-07 | 60 |
| hsa05205 | Colorectum | AD | Proteoglycans in cancer | 70/2092 | 205/8465 | 1.37e-03 | 8.46e-03 | 5.39e-03 | 70 |
| hsa03040 | Colorectum | AD | Spliceosome | 73/2092 | 217/8465 | 1.73e-03 | 9.68e-03 | 6.18e-03 | 73 |
| hsa052051 | Colorectum | AD | Proteoglycans in cancer | 70/2092 | 205/8465 | 1.37e-03 | 8.46e-03 | 5.39e-03 | 70 |
| hsa030401 | Colorectum | AD | Spliceosome | 73/2092 | 217/8465 | 1.73e-03 | 9.68e-03 | 6.18e-03 | 73 |
| hsa052052 | Colorectum | SER | Proteoglycans in cancer | 58/1580 | 205/8465 | 4.37e-04 | 3.82e-03 | 2.77e-03 | 58 |
| hsa052053 | Colorectum | SER | Proteoglycans in cancer | 58/1580 | 205/8465 | 4.37e-04 | 3.82e-03 | 2.77e-03 | 58 |
| hsa052054 | Colorectum | MSS | Proteoglycans in cancer | 65/1875 | 205/8465 | 8.66e-04 | 5.38e-03 | 3.29e-03 | 65 |
| hsa030402 | Colorectum | MSS | Spliceosome | 66/1875 | 217/8465 | 2.58e-03 | 1.27e-02 | 7.81e-03 | 66 |
| hsa052055 | Colorectum | MSS | Proteoglycans in cancer | 65/1875 | 205/8465 | 8.66e-04 | 5.38e-03 | 3.29e-03 | 65 |
| hsa030403 | Colorectum | MSS | Spliceosome | 66/1875 | 217/8465 | 2.58e-03 | 1.27e-02 | 7.81e-03 | 66 |
| Page: 1 2 3 4 5 |
Top |
Cell-cell communication analysis |
| Identification of potential cell-cell interactions between two cell types and their ligand-receptor pairs for different disease states |
| Ligand | Receptor | LRpair | Pathway | Tissue | Disease Stage |
| Page: 1 |
Top |
Single-cell gene regulatory network inference analysis |
| Find out the significant the regulons (TFs) and the target genes of each regulon across cell types for different disease states |
| TF | Cell Type | Tissue | Disease Stage | Target Gene | RSS | Regulon Activity |
| ∗The dot plots of a searched regulon are shown for all cell subpopulations in each disease state of each tissue based on the regulon specific score inferred using pySCENIC and by calculating the average expression. |
| Page: 1 |
Top |
Somatic mutation of malignant transformation related genes |
| Annotation of somatic variants for genes involved in malignant transformation |
| Hugo Symbol | Variant Class | Variant Classification | dbSNP RS | HGVSc | HGVSp | HGVSp Short | SWISSPROT | BIOTYPE | SIFT | PolyPhen | Tumor Sample Barcode | Tissue | Histology | Sex | Age | Stage | Therapy Types | Drugs | Outcome |
| DDX5 | SNV | Missense_Mutation | novel | c.778N>A | p.Pro260Thr | p.P260T | P17844 | protein_coding | deleterious(0) | probably_damaging(0.997) | TCGA-AR-A2LL-01 | Breast | breast invasive carcinoma | Female | >=65 | I/II | Hormone Therapy | tamoxiphen | SD |
| DDX5 | SNV | Missense_Mutation | novel | c.197N>G | p.Ala66Gly | p.A66G | P17844 | protein_coding | tolerated(0.08) | benign(0.027) | TCGA-AR-A5QQ-01 | Breast | breast invasive carcinoma | Female | >=65 | III/IV | Chemotherapy | carboplatin | PD |
| DDX5 | SNV | Missense_Mutation | novel | c.991N>T | p.Arg331Cys | p.R331C | P17844 | protein_coding | deleterious(0.01) | benign(0.046) | TCGA-BH-A0DZ-01 | Breast | breast invasive carcinoma | Female | <65 | I/II | Chemotherapy | docetaxel | SD |
| DDX5 | SNV | Missense_Mutation | c.1379N>G | p.Leu460Arg | p.L460R | P17844 | protein_coding | deleterious(0) | probably_damaging(0.997) | TCGA-BH-A1FC-01 | Breast | breast invasive carcinoma | Female | >=65 | I/II | Unknown | Unknown | SD | |
| DDX5 | SNV | Missense_Mutation | c.214G>A | p.Glu72Lys | p.E72K | P17844 | protein_coding | deleterious(0) | possibly_damaging(0.662) | TCGA-E9-A1R4-01 | Breast | breast invasive carcinoma | Female | >=65 | I/II | Chemotherapy | 5-fluorouracil | SD | |
| DDX5 | insertion | Frame_Shift_Ins | novel | c.766dupA | p.Met256AsnfsTer4 | p.M256Nfs*4 | P17844 | protein_coding | TCGA-A8-A09Q-01 | Breast | breast invasive carcinoma | Female | >=65 | III/IV | Hormone Therapy | anastrozole | SD | ||
| DDX5 | insertion | Nonsense_Mutation | novel | c.1032_1033insTTGAATGTGAAAACTTAAGCTGAAAAATTGT | p.Ile345LeufsTer6 | p.I345Lfs*6 | P17844 | protein_coding | TCGA-AN-A0FX-01 | Breast | breast invasive carcinoma | Female | <65 | I/II | Unknown | Unknown | SD | ||
| DDX5 | deletion | Frame_Shift_Del | rs782756724 | c.1620delC | p.Tyr540Ter | p.Y540* | P17844 | protein_coding | TCGA-BH-A0BM-01 | Breast | breast invasive carcinoma | Female | <65 | I/II | Chemotherapy | adriamycin | SD | ||
| DDX5 | deletion | Frame_Shift_Del | novel | c.1030delA | p.Thr344ProfsTer18 | p.T344Pfs*18 | P17844 | protein_coding | TCGA-EW-A2FV-01 | Breast | breast invasive carcinoma | Female | <65 | III/IV | Chemotherapy | docetaxel | SD | ||
| DDX5 | SNV | Missense_Mutation | rs781795658 | c.992N>A | p.Arg331His | p.R331H | P17844 | protein_coding | deleterious(0.05) | benign(0.133) | TCGA-C5-A3HE-01 | Cervix | cervical & endocervical cancer | Female | <65 | I/II | Unknown | Unknown | PD |
| Page: 1 2 3 4 5 6 |
Top |
Related drugs of malignant transformation related genes |
| Identification of chemicals and drugs interact with genes involved in malignant transfromation |
| (DGIdb 4.0) |
| Entrez ID | Symbol | Category | Interaction Types | Drug Claim Name | Drug Name | PMIDs |
| 1655 | DDX5 | CLINICALLY ACTIONABLE | RX-5902 |
| Page: 1 |

Copyright 2023-Present -The University of Texas Health Science Center at Houston |