| Tissue | Expression Dynamics | Abbreviation |
| Breast | 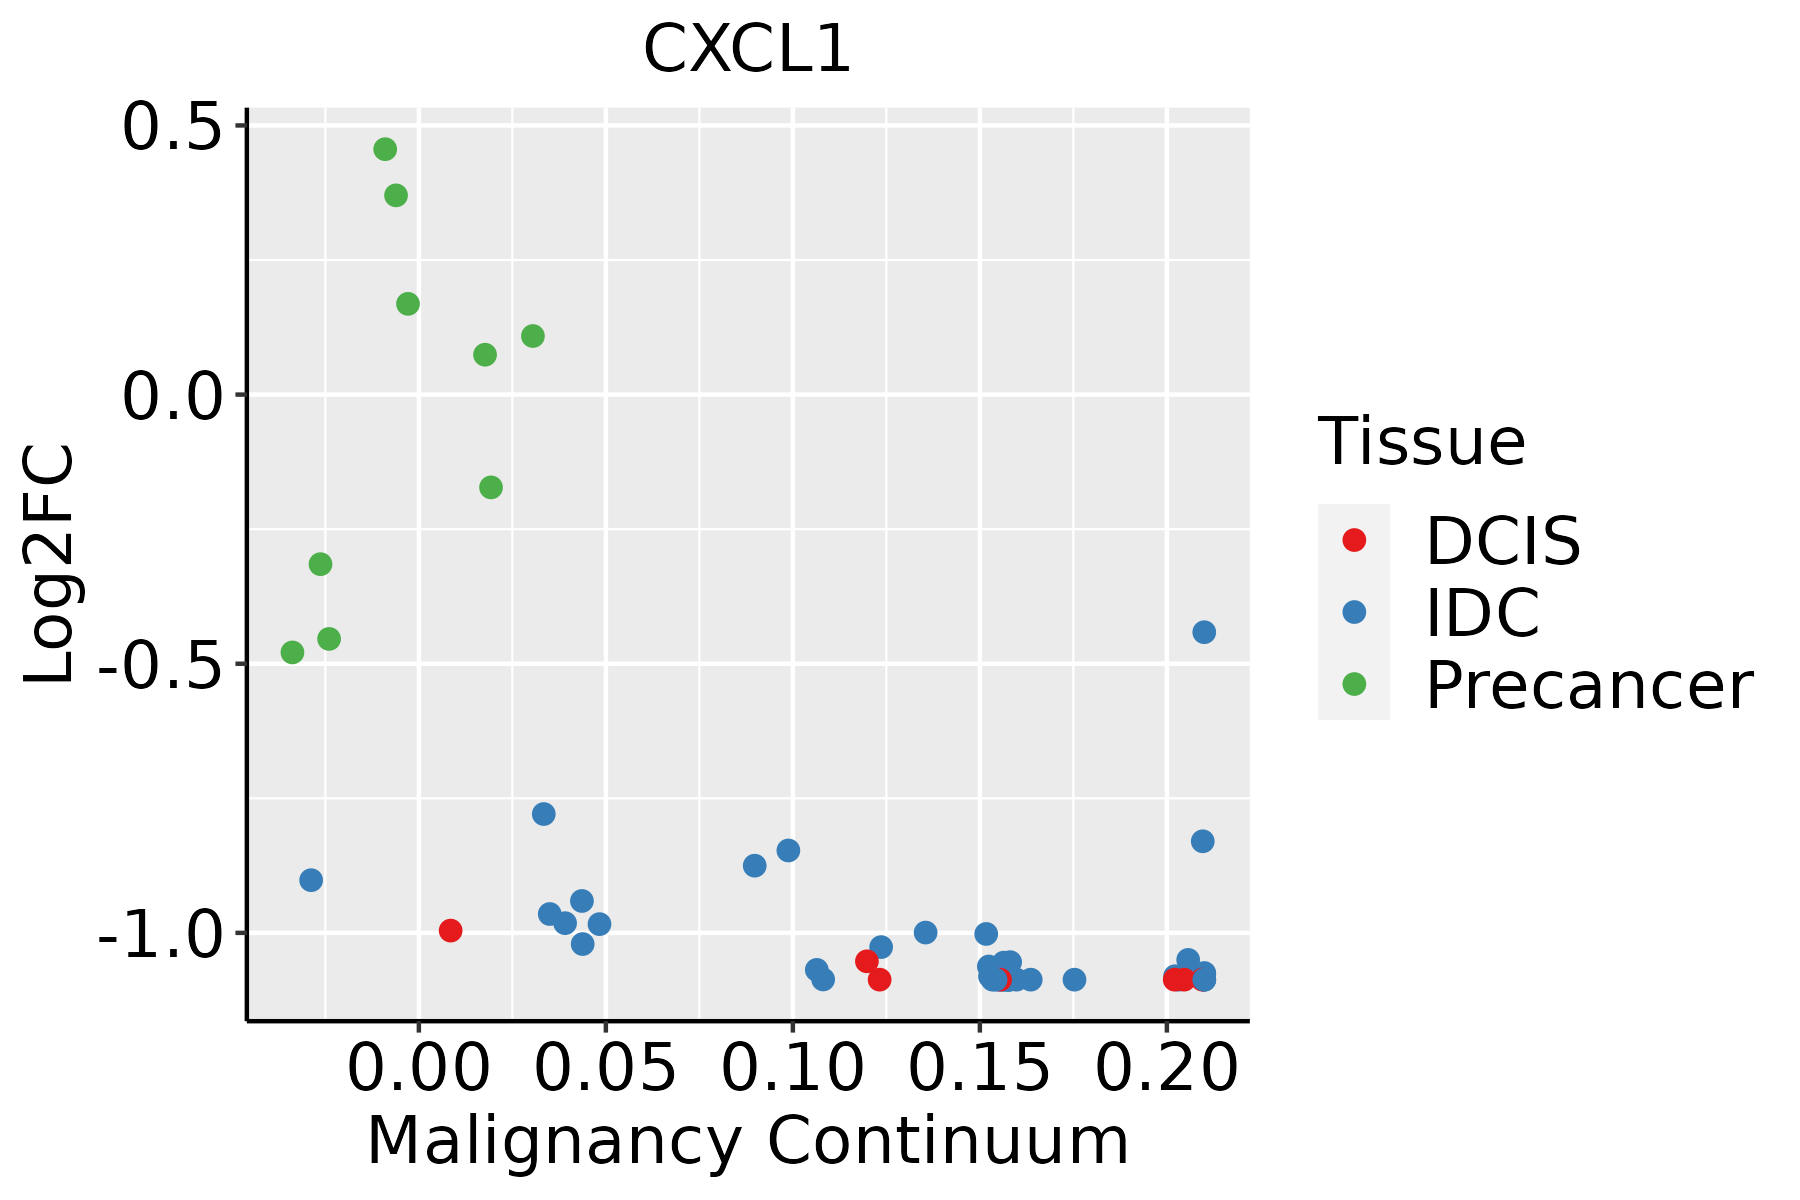 | IDC: Invasive ductal carcinoma |
| DCIS: Ductal carcinoma in situ |
| Precancer(BRCA1-mut): Precancerous lesion from BRCA1 mutation carriers |
| Cervix | 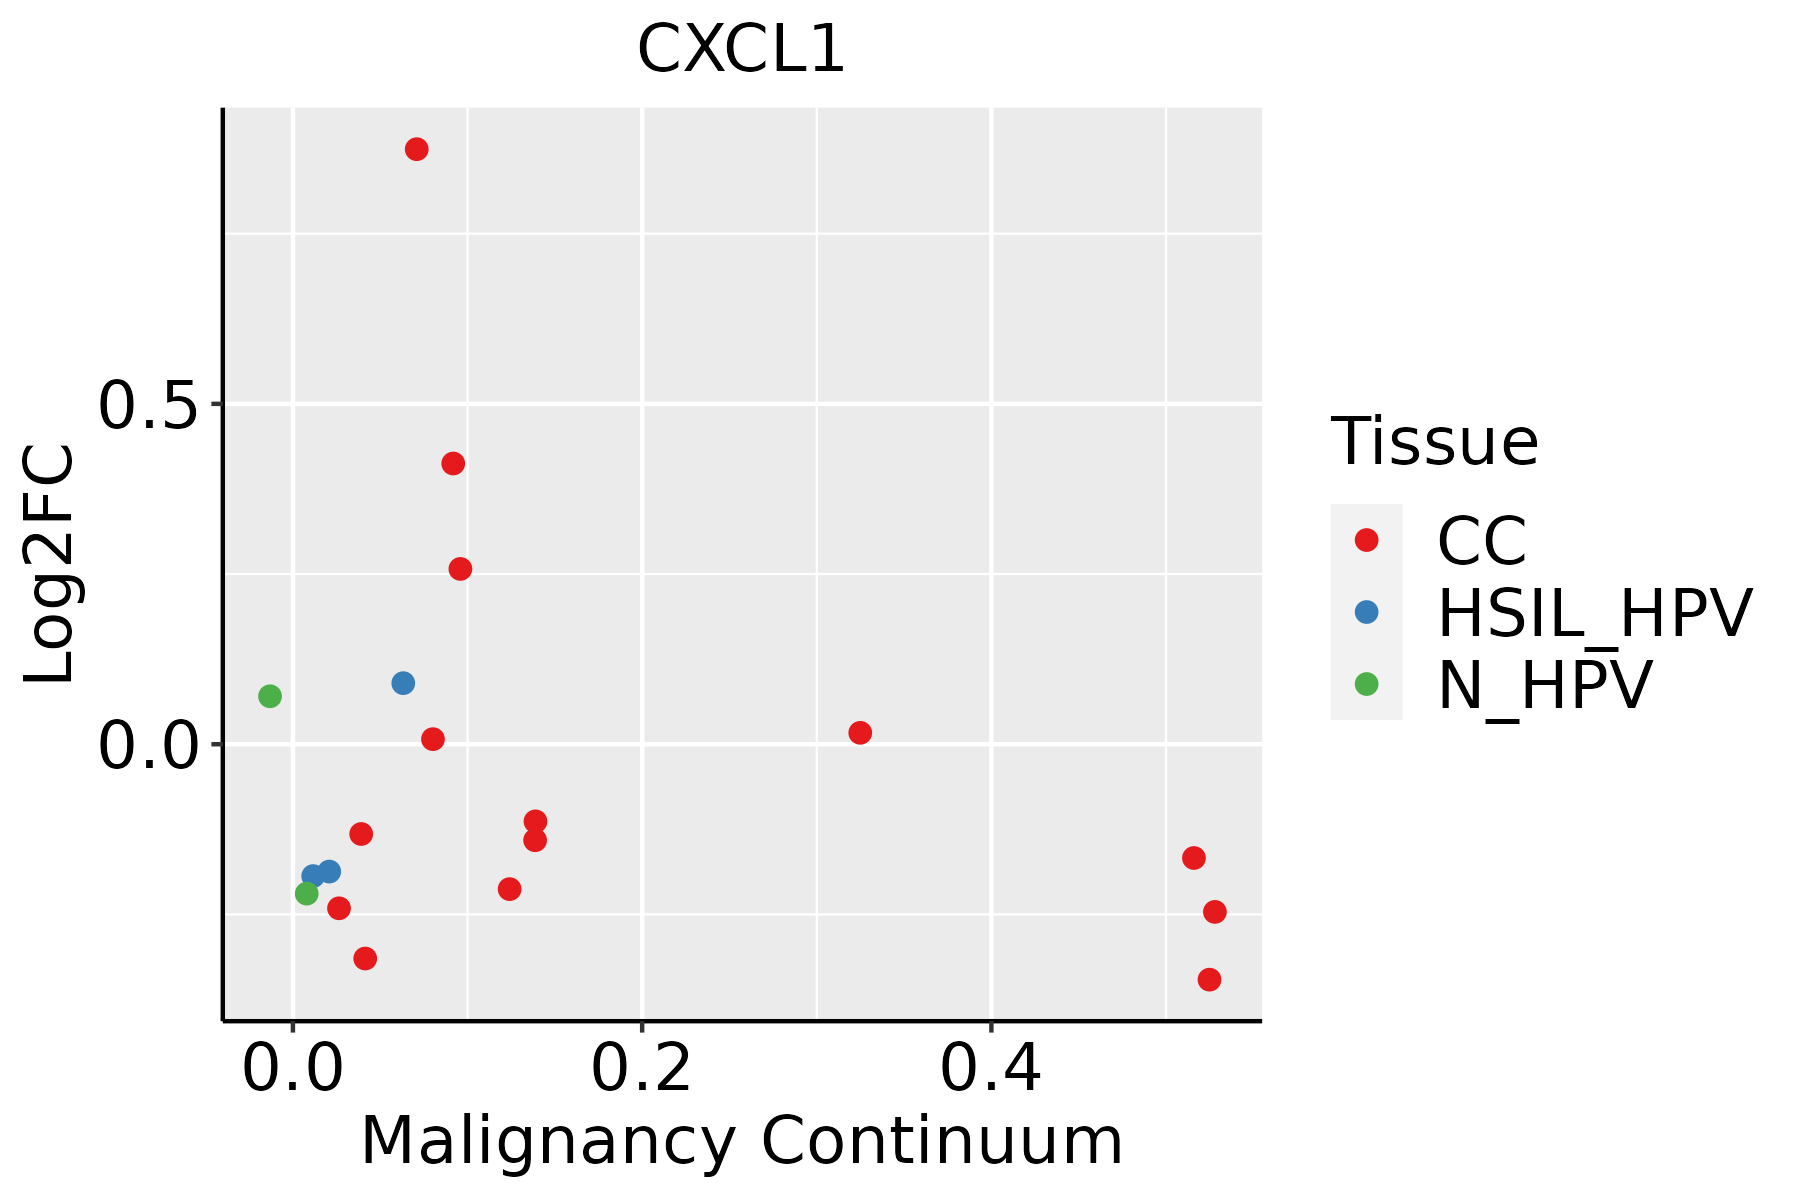 | CC: Cervix cancer |
| HSIL_HPV: HPV-infected high-grade squamous intraepithelial lesions |
| N_HPV: HPV-infected normal cervix |
| Endometrium | 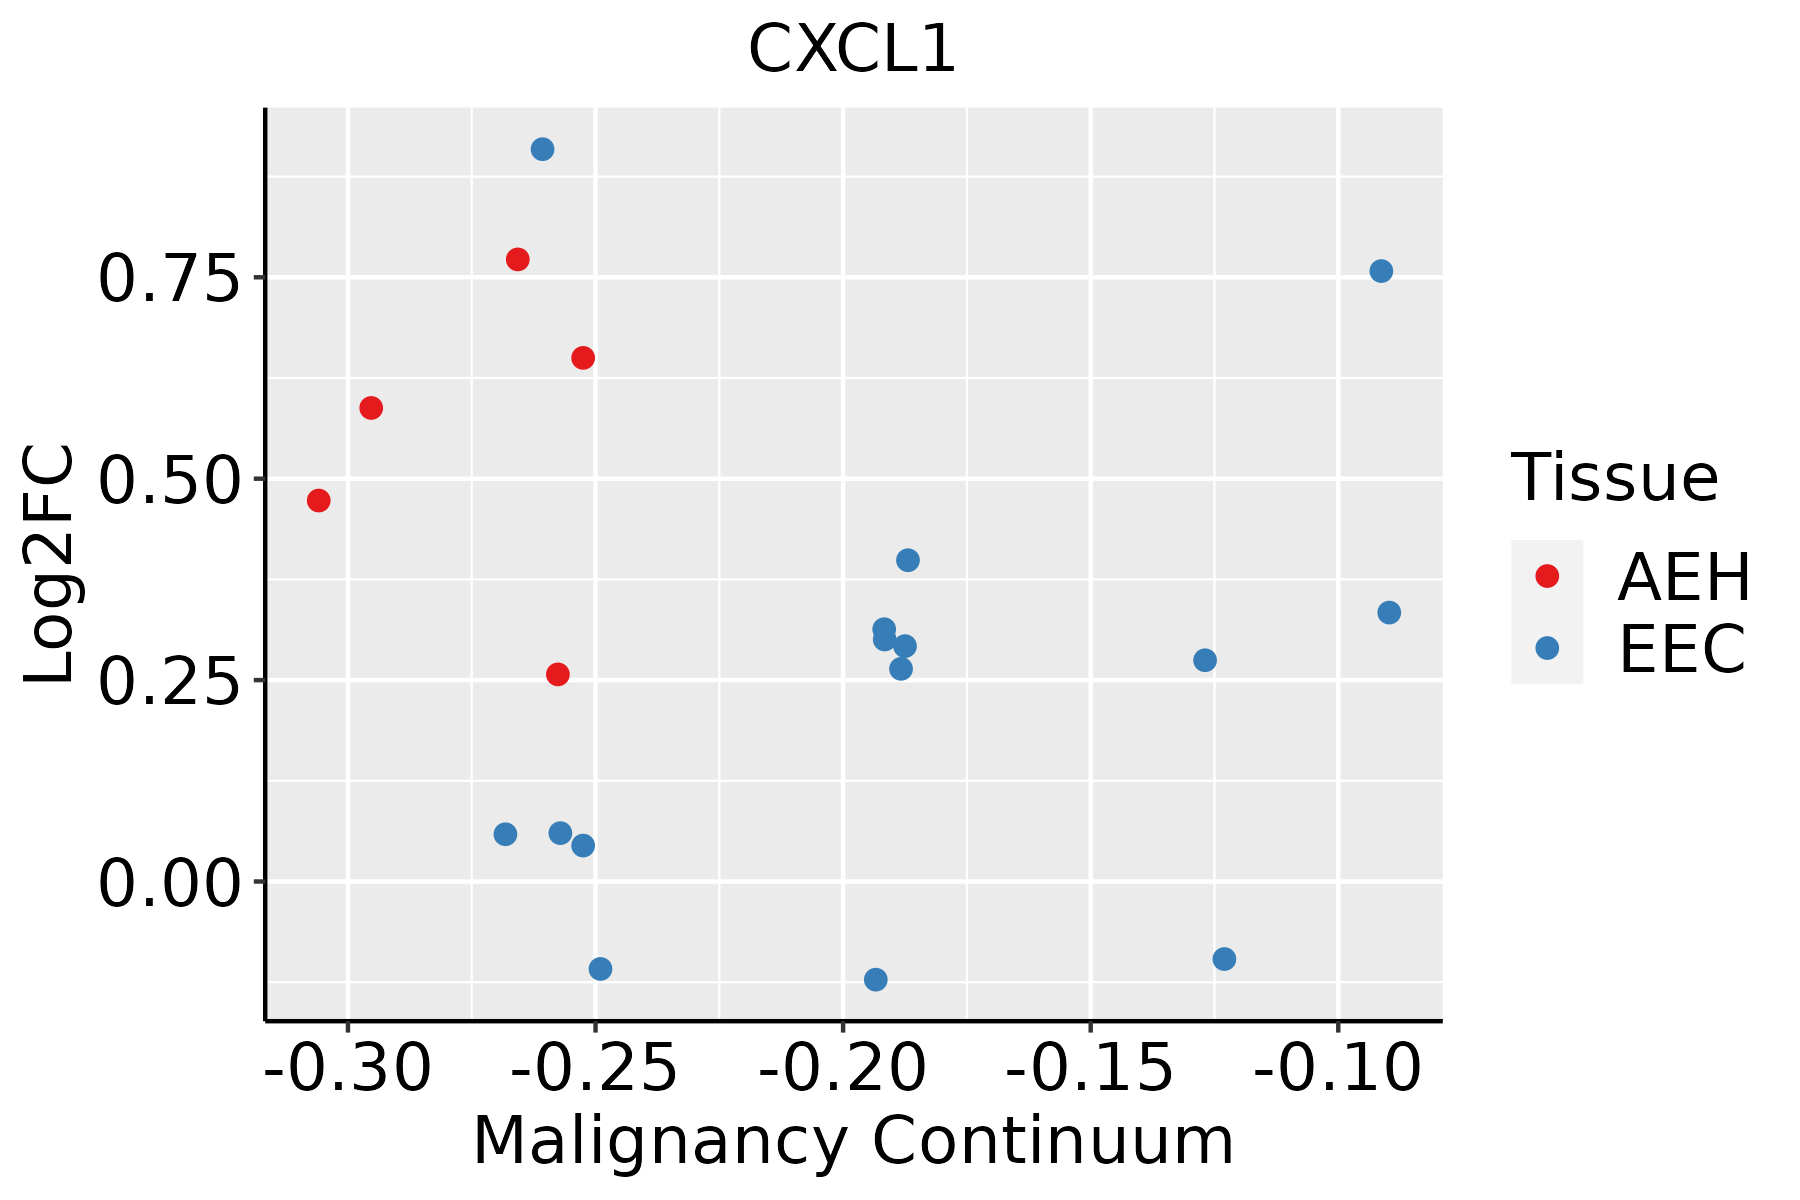 | AEH: Atypical endometrial hyperplasia |
| EEC: Endometrioid Cancer |
| Esophagus |  | ESCC: Esophageal squamous cell carcinoma |
| HGIN: High-grade intraepithelial neoplasias |
| LGIN: Low-grade intraepithelial neoplasias |
| GC | 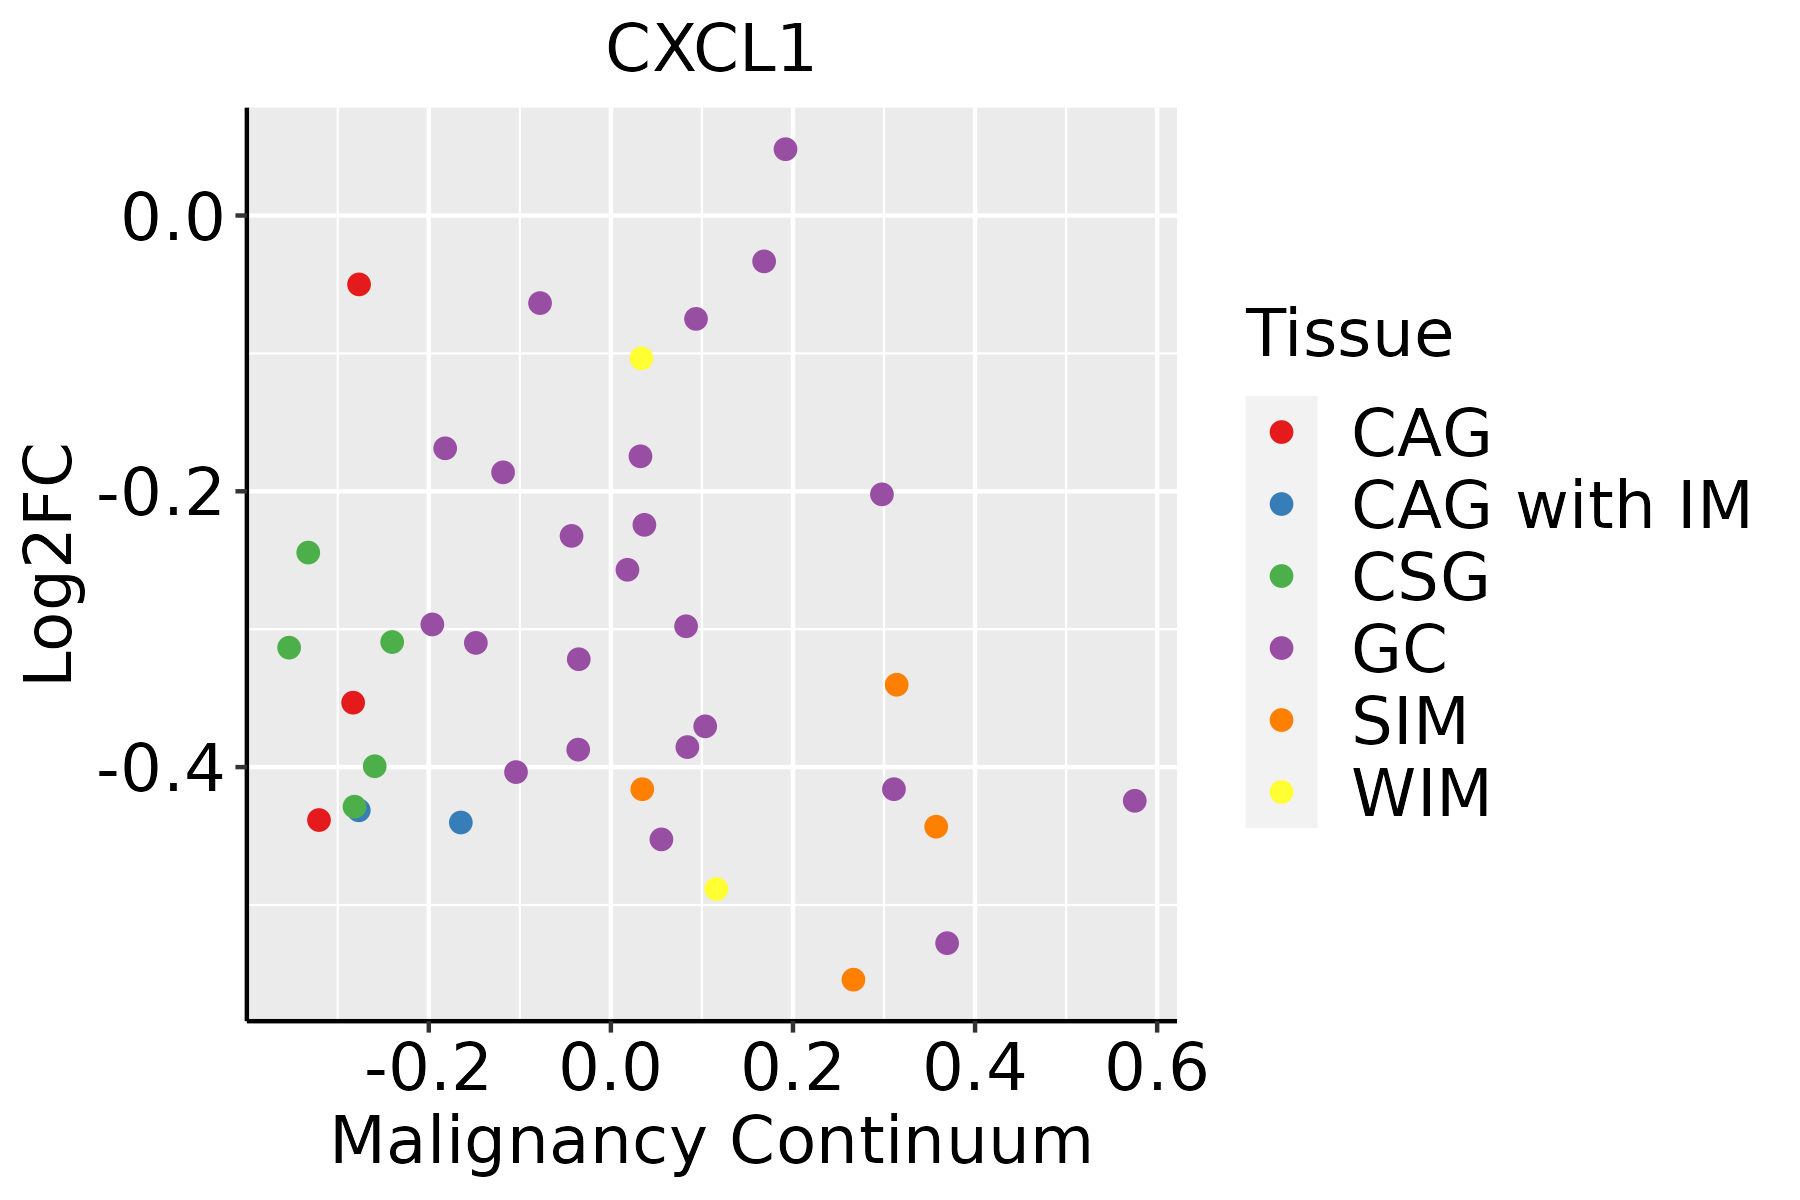 | CAG: Chronic atrophic gastritis |
| CAG with IM: Chronic atrophic gastritis with intestinal metaplasia |
| CSG: Chronic superficial gastritis |
| GC: Gastric cancer |
| SIM: Severe intestinal metaplasia |
| WIM: Wild intestinal metaplasia |
| Liver | 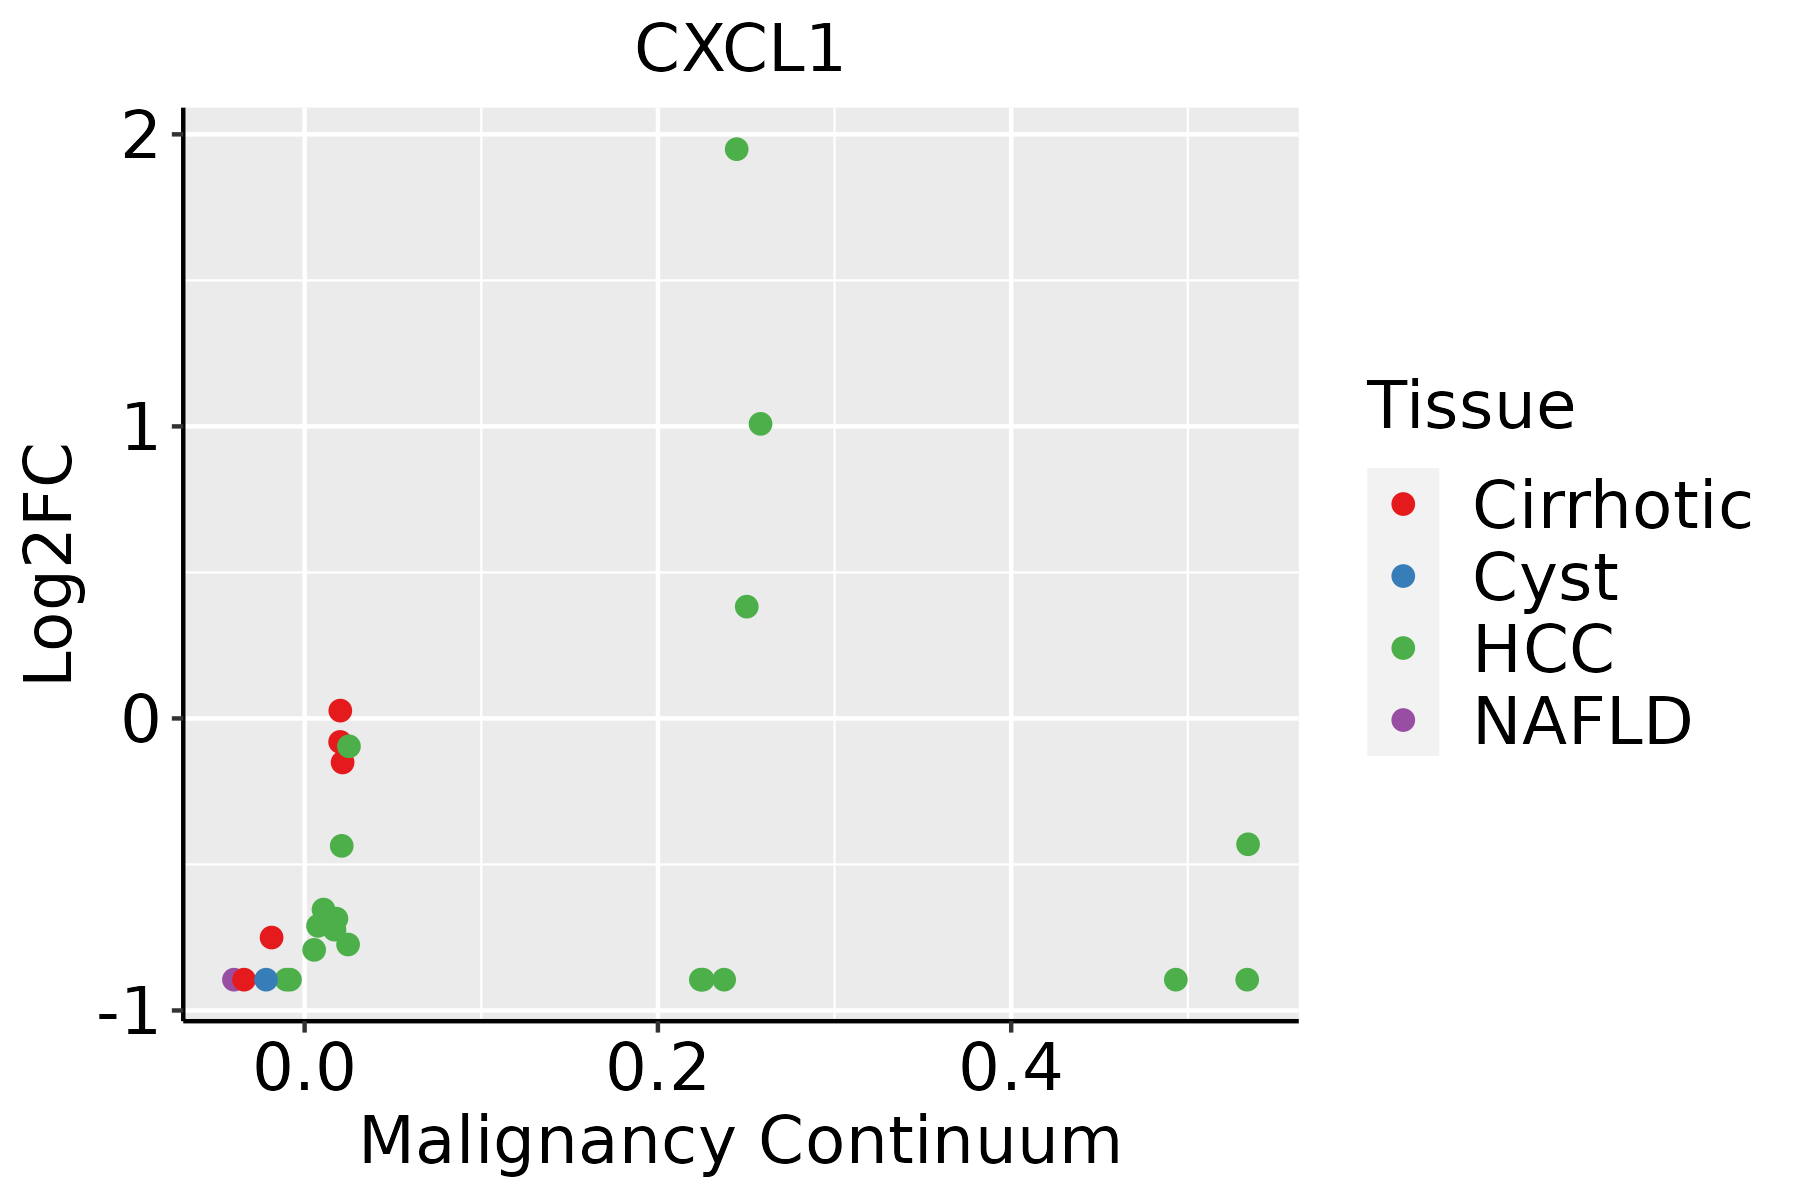 | HCC: Hepatocellular carcinoma |
| NAFLD: Non-alcoholic fatty liver disease |
| Oral Cavity | 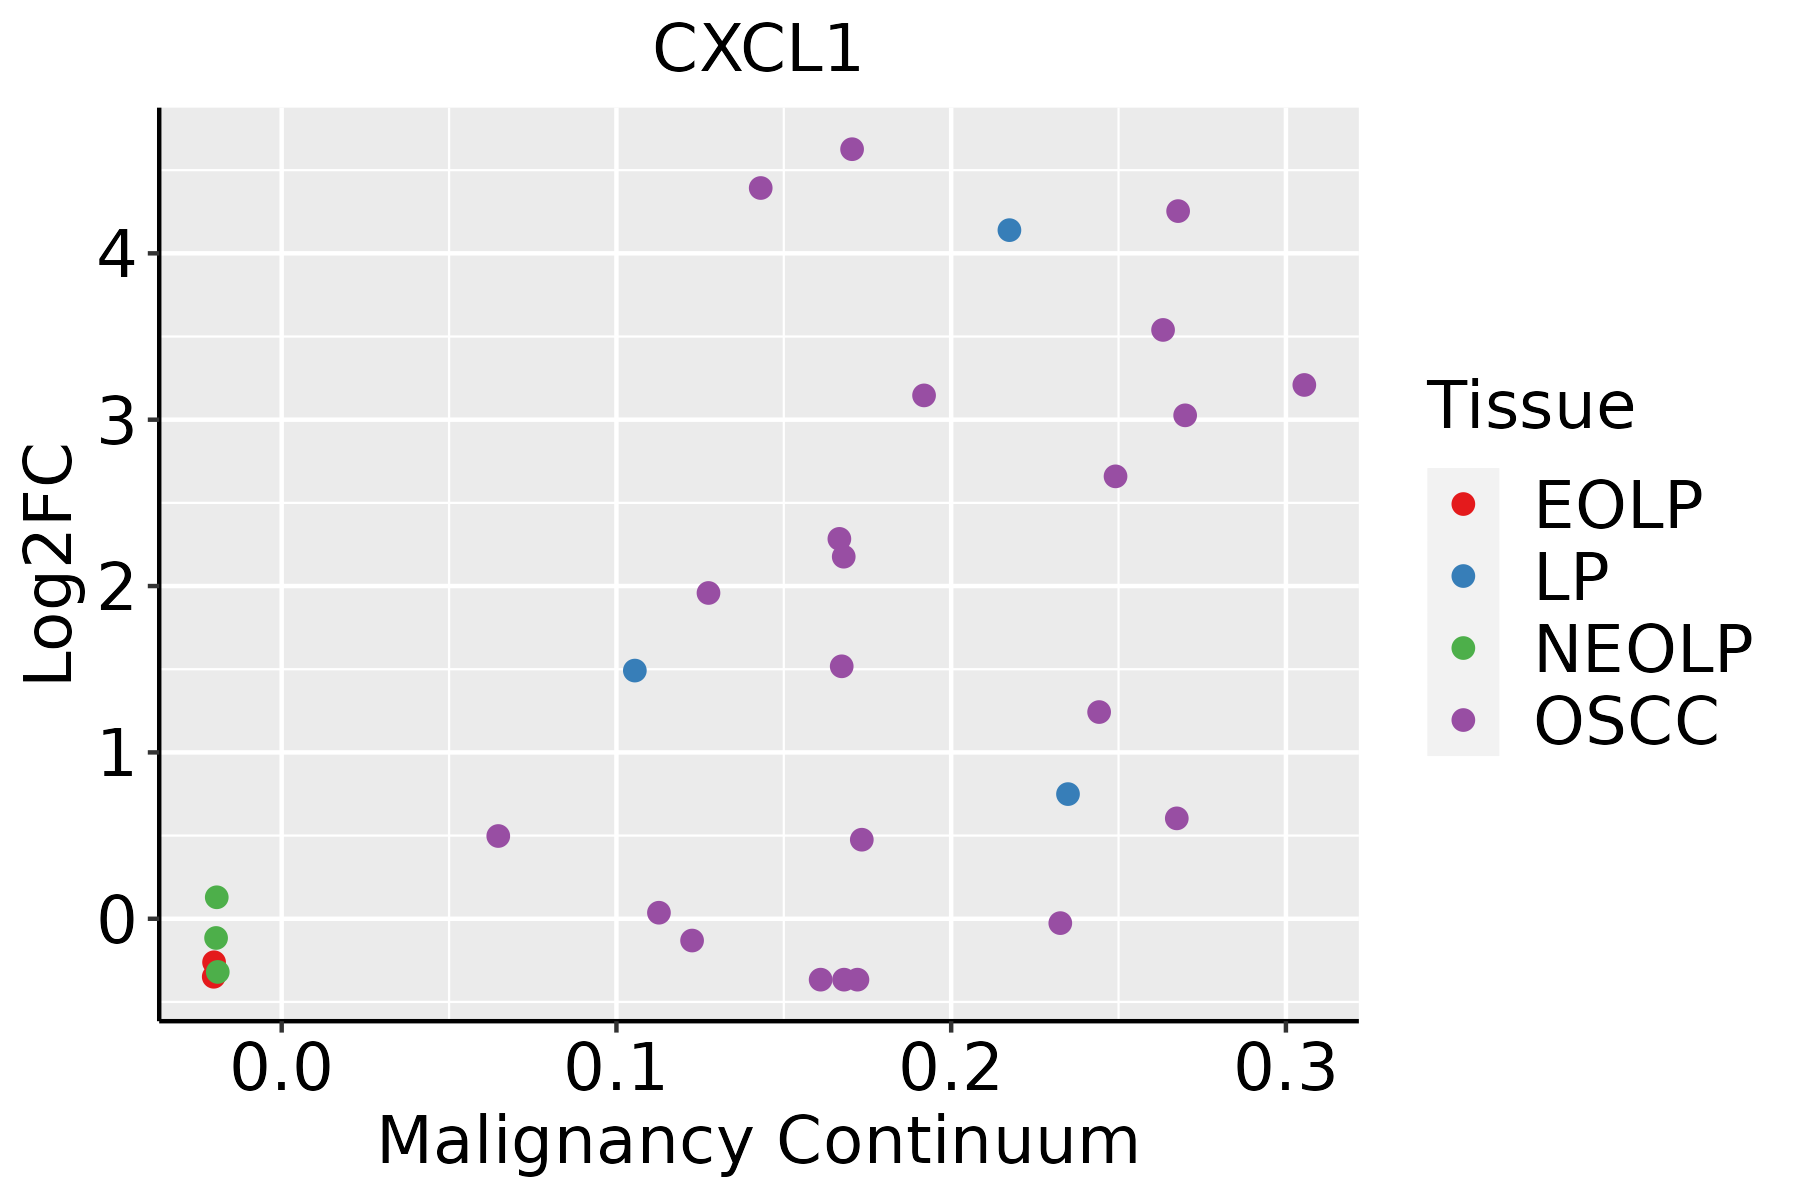 | EOLP: Erosive Oral lichen planus |
| LP: leukoplakia |
| NEOLP: Non-erosive oral lichen planus |
| OSCC: Oral squamous cell carcinoma |
| Prostate | 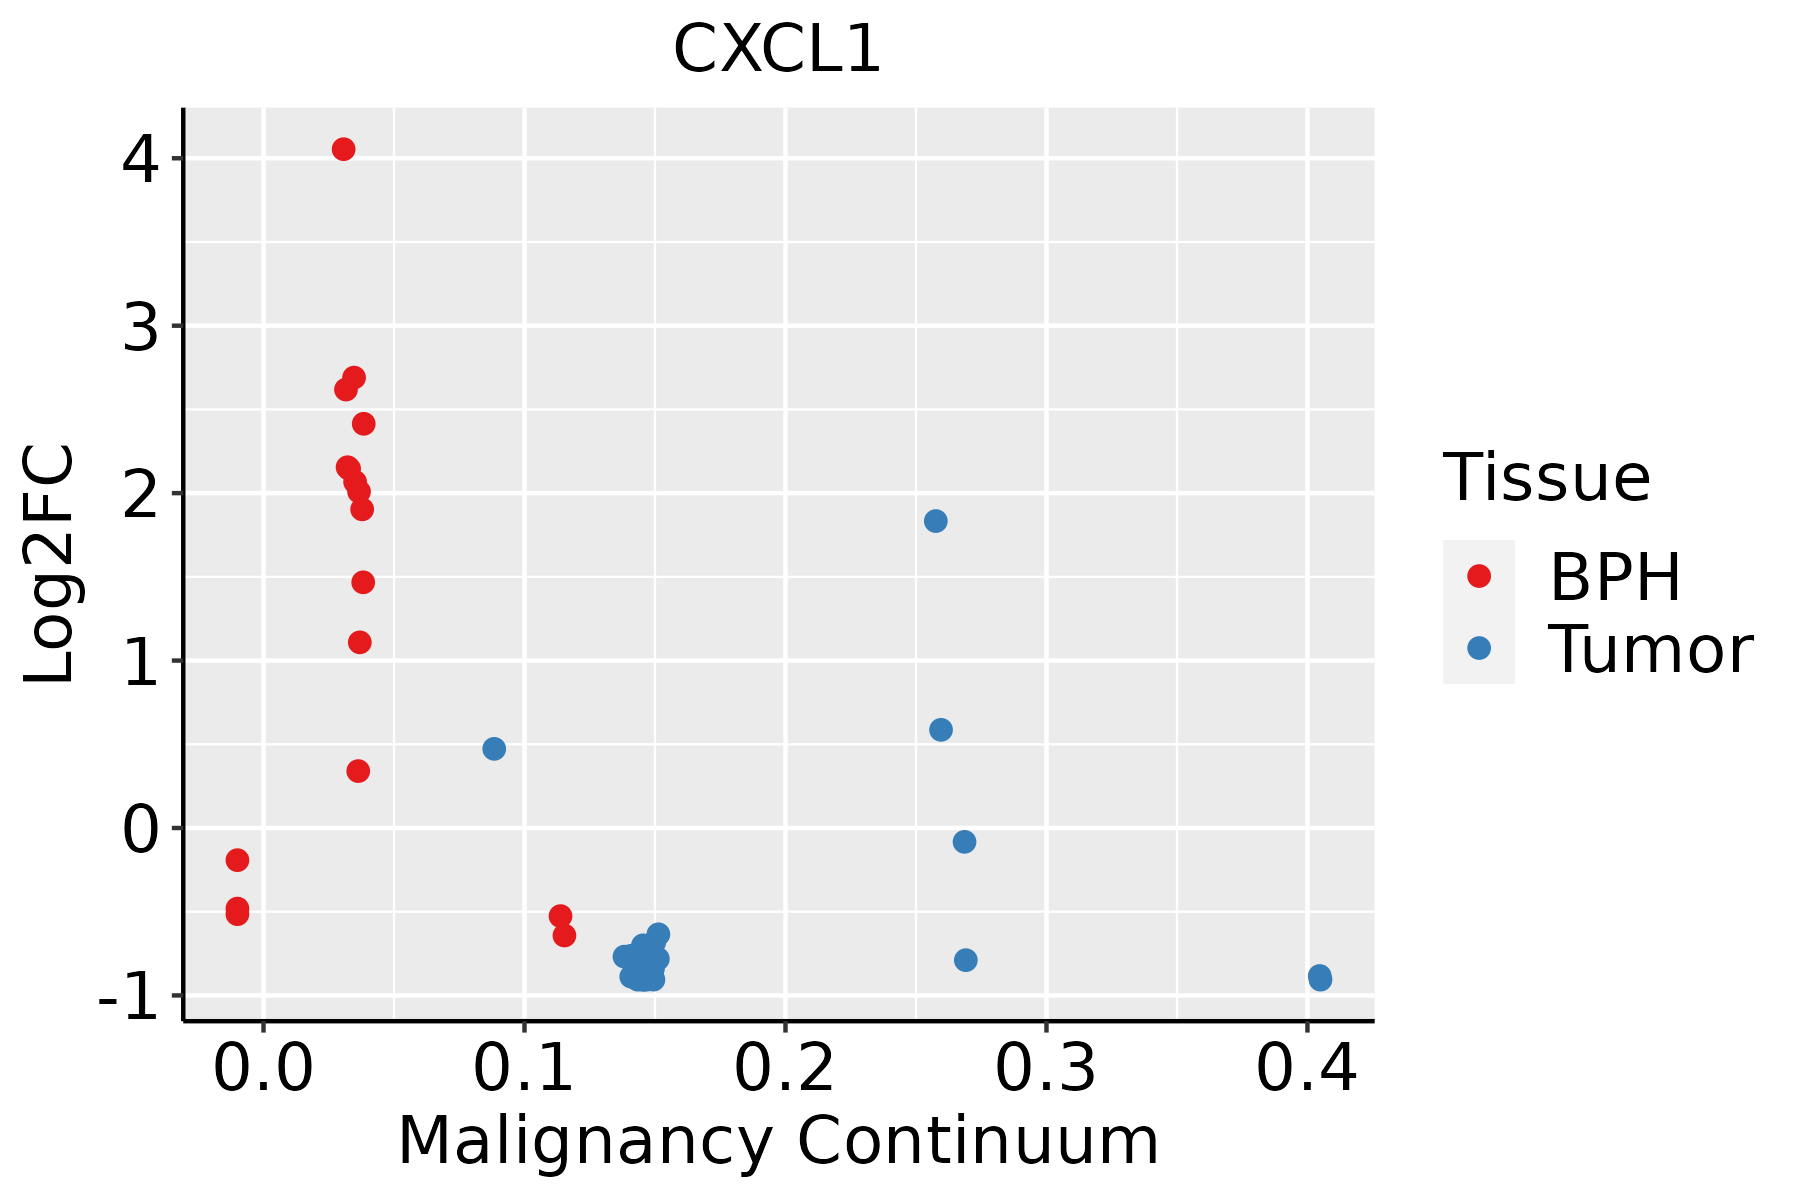 | BPH: Benign Prostatic Hyperplasia |
| Skin | 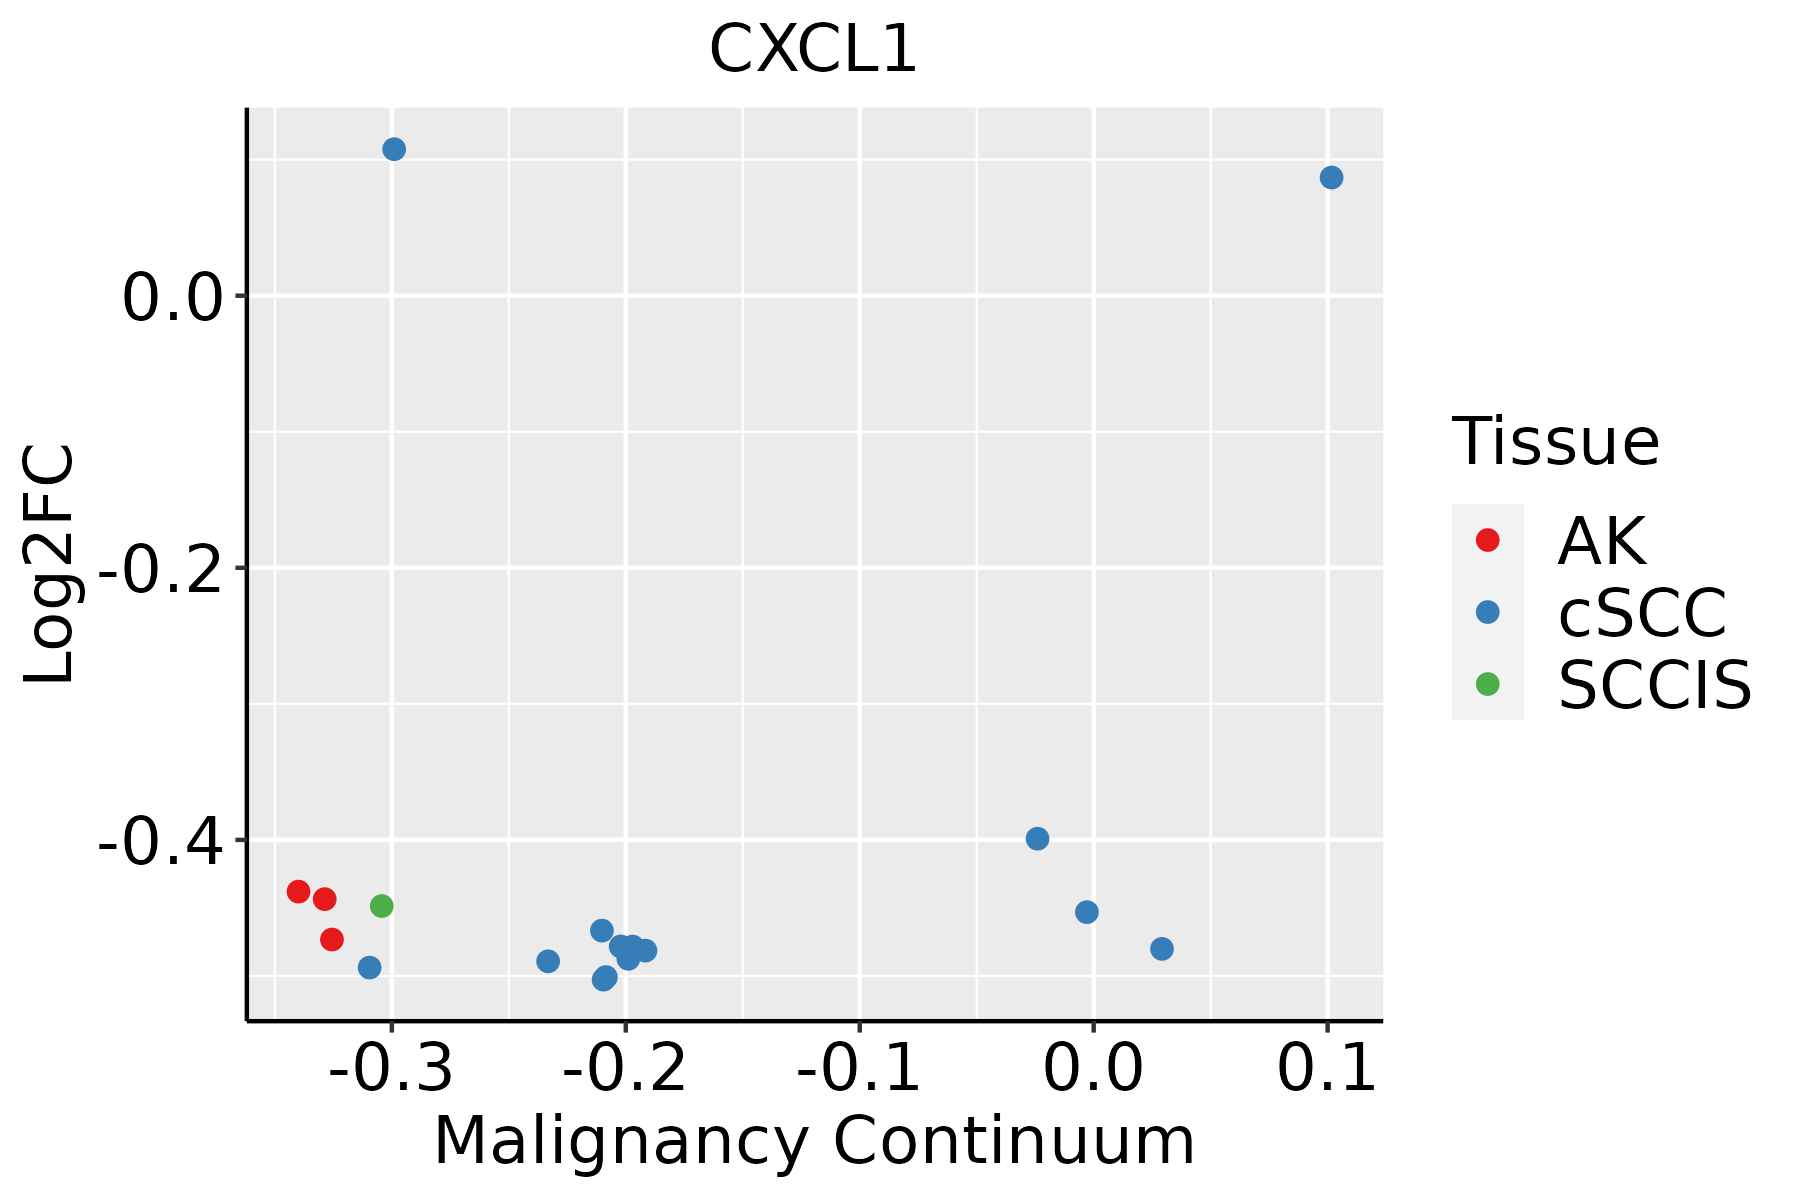 | AK: Actinic keratosis |
| cSCC: Cutaneous squamous cell carcinoma |
| SCCIS:squamous cell carcinoma in situ |
| Thyroid |  | ATC: Anaplastic thyroid cancer |
| HT: Hashimoto's thyroiditis |
| PTC: Papillary thyroid cancer |
| GO ID | Tissue | Disease Stage | Description | Gene Ratio | Bg Ratio | pvalue | p.adjust | Count |
| GO:005076722 | Skin | cSCC | regulation of neurogenesis | 118/4864 | 364/18723 | 3.32e-03 | 1.81e-02 | 118 |
| GO:004578529 | Skin | cSCC | positive regulation of cell adhesion | 139/4864 | 437/18723 | 3.39e-03 | 1.84e-02 | 139 |
| GO:001097522 | Skin | cSCC | regulation of neuron projection development | 141/4864 | 445/18723 | 3.72e-03 | 1.99e-02 | 141 |
| GO:005123527 | Skin | cSCC | maintenance of location | 106/4864 | 327/18723 | 5.17e-03 | 2.61e-02 | 106 |
| GO:006156422 | Skin | cSCC | axon development | 146/4864 | 467/18723 | 5.50e-03 | 2.73e-02 | 146 |
| GO:01403743 | Skin | cSCC | antiviral innate immune response | 9/4864 | 15/18723 | 5.52e-03 | 2.73e-02 | 9 |
| GO:000315824 | Skin | cSCC | endothelium development | 49/4864 | 136/18723 | 6.00e-03 | 2.95e-02 | 49 |
| GO:000961224 | Skin | cSCC | response to mechanical stimulus | 73/4864 | 216/18723 | 6.22e-03 | 3.04e-02 | 73 |
| GO:00507729 | Skin | cSCC | positive regulation of axonogenesis | 31/4864 | 79/18723 | 6.63e-03 | 3.23e-02 | 31 |
| GO:006056023 | Skin | cSCC | developmental growth involved in morphogenesis | 78/4864 | 234/18723 | 7.08e-03 | 3.40e-02 | 78 |
| GO:005165128 | Skin | cSCC | maintenance of location in cell | 72/4864 | 214/18723 | 7.37e-03 | 3.47e-02 | 72 |
| GO:000716224 | Skin | cSCC | negative regulation of cell adhesion | 98/4864 | 303/18723 | 7.45e-03 | 3.50e-02 | 98 |
| GO:004592719 | Skin | cSCC | positive regulation of growth | 85/4864 | 259/18723 | 8.03e-03 | 3.73e-02 | 85 |
| GO:190223021 | Skin | cSCC | negative regulation of intrinsic apoptotic signaling pathway in response to DNA damage | 14/4864 | 29/18723 | 8.08e-03 | 3.74e-02 | 14 |
| GO:199013823 | Skin | cSCC | neuron projection extension | 59/4864 | 172/18723 | 9.20e-03 | 4.20e-02 | 59 |
| GO:200102122 | Skin | cSCC | negative regulation of response to DNA damage stimulus | 31/4864 | 81/18723 | 1.00e-02 | 4.40e-02 | 31 |
| GO:005196213 | Skin | cSCC | positive regulation of nervous system development | 88/4864 | 272/18723 | 1.07e-02 | 4.66e-02 | 88 |
| GO:0019730 | Stomach | GC | antimicrobial humoral response | 25/1159 | 122/18723 | 9.62e-08 | 6.08e-06 | 25 |
| GO:0006959 | Stomach | GC | humoral immune response | 42/1159 | 317/18723 | 2.59e-06 | 1.10e-04 | 42 |
| GO:0002237 | Stomach | GC | response to molecule of bacterial origin | 45/1159 | 363/18723 | 6.89e-06 | 2.57e-04 | 45 |
| Pathway ID | Tissue | Disease Stage | Description | Gene Ratio | Bg Ratio | pvalue | p.adjust | qvalue | Count |
| hsa0513414 | Breast | Precancer | Legionellosis | 19/684 | 57/8465 | 4.62e-08 | 9.12e-07 | 6.98e-07 | 19 |
| hsa0516718 | Breast | Precancer | Kaposi sarcoma-associated herpesvirus infection | 36/684 | 194/8465 | 1.68e-06 | 2.53e-05 | 1.94e-05 | 36 |
| hsa0541718 | Breast | Precancer | Lipid and atherosclerosis | 37/684 | 215/8465 | 7.64e-06 | 9.29e-05 | 7.12e-05 | 37 |
| hsa0465716 | Breast | Precancer | IL-17 signaling pathway | 20/684 | 94/8465 | 4.74e-05 | 4.54e-04 | 3.48e-04 | 20 |
| hsa0532312 | Breast | Precancer | Rheumatoid arthritis | 19/684 | 93/8465 | 1.30e-04 | 1.14e-03 | 8.73e-04 | 19 |
| hsa051206 | Breast | Precancer | Epithelial cell signaling in Helicobacter pylori infection | 14/684 | 70/8465 | 1.21e-03 | 7.99e-03 | 6.12e-03 | 14 |
| hsa0513415 | Breast | Precancer | Legionellosis | 19/684 | 57/8465 | 4.62e-08 | 9.12e-07 | 6.98e-07 | 19 |
| hsa0516719 | Breast | Precancer | Kaposi sarcoma-associated herpesvirus infection | 36/684 | 194/8465 | 1.68e-06 | 2.53e-05 | 1.94e-05 | 36 |
| hsa0541719 | Breast | Precancer | Lipid and atherosclerosis | 37/684 | 215/8465 | 7.64e-06 | 9.29e-05 | 7.12e-05 | 37 |
| hsa0465717 | Breast | Precancer | IL-17 signaling pathway | 20/684 | 94/8465 | 4.74e-05 | 4.54e-04 | 3.48e-04 | 20 |
| hsa0532313 | Breast | Precancer | Rheumatoid arthritis | 19/684 | 93/8465 | 1.30e-04 | 1.14e-03 | 8.73e-04 | 19 |
| hsa0512013 | Breast | Precancer | Epithelial cell signaling in Helicobacter pylori infection | 14/684 | 70/8465 | 1.21e-03 | 7.99e-03 | 6.12e-03 | 14 |
| hsa0513422 | Breast | IDC | Legionellosis | 19/867 | 57/8465 | 1.89e-06 | 3.07e-05 | 2.29e-05 | 19 |
| hsa0516723 | Breast | IDC | Kaposi sarcoma-associated herpesvirus infection | 38/867 | 194/8465 | 5.87e-05 | 5.96e-04 | 4.46e-04 | 38 |
| hsa0532321 | Breast | IDC | Rheumatoid arthritis | 21/867 | 93/8465 | 3.69e-04 | 3.15e-03 | 2.36e-03 | 21 |
| hsa0541724 | Breast | IDC | Lipid and atherosclerosis | 35/867 | 215/8465 | 3.67e-03 | 2.29e-02 | 1.71e-02 | 35 |
| hsa0465721 | Breast | IDC | IL-17 signaling pathway | 18/867 | 94/8465 | 6.39e-03 | 3.30e-02 | 2.47e-02 | 18 |
| hsa0513432 | Breast | IDC | Legionellosis | 19/867 | 57/8465 | 1.89e-06 | 3.07e-05 | 2.29e-05 | 19 |
| hsa0516733 | Breast | IDC | Kaposi sarcoma-associated herpesvirus infection | 38/867 | 194/8465 | 5.87e-05 | 5.96e-04 | 4.46e-04 | 38 |
| hsa0532331 | Breast | IDC | Rheumatoid arthritis | 21/867 | 93/8465 | 3.69e-04 | 3.15e-03 | 2.36e-03 | 21 |
| Hugo Symbol | Variant Class | Variant Classification | dbSNP RS | HGVSc | HGVSp | HGVSp Short | SWISSPROT | BIOTYPE | SIFT | PolyPhen | Tumor Sample Barcode | Tissue | Histology | Sex | Age | Stage | Therapy Types | Drugs | Outcome |
| CXCL1 | SNV | Missense_Mutation | novel | c.125G>A | p.Arg42His | p.R42H | P09341 | protein_coding | deleterious(0) | probably_damaging(1) | TCGA-A8-A09A-01 | Breast | breast invasive carcinoma | Female | <65 | I/II | Hormone Therapy | tamoxiphen | SD |
| CXCL1 | SNV | Missense_Mutation | | c.217G>A | p.Glu73Lys | p.E73K | P09341 | protein_coding | deleterious(0) | probably_damaging(1) | TCGA-2W-A8YY-01 | Cervix | cervical & endocervical cancer | Female | <65 | I/II | Chemotherapy | cisplatin | CR |
| CXCL1 | SNV | Missense_Mutation | novel | c.190N>C | p.Ser64Pro | p.S64P | P09341 | protein_coding | tolerated(1) | benign(0.001) | TCGA-AA-3492-01 | Colorectum | colon adenocarcinoma | Female | >=65 | I/II | Unknown | Unknown | SD |
| CXCL1 | SNV | Missense_Mutation | novel | c.293A>G | p.Glu98Gly | p.E98G | P09341 | protein_coding | tolerated(0.05) | benign(0.007) | TCGA-EI-6917-01 | Colorectum | rectum adenocarcinoma | Male | <65 | III/IV | Chemotherapy | 5fluorouracil+oxaciplatina+l-folinian | SD |
| CXCL1 | SNV | Missense_Mutation | | c.217G>A | p.Glu73Lys | p.E73K | P09341 | protein_coding | deleterious(0) | probably_damaging(1) | TCGA-A5-A0GP-01 | Endometrium | uterine corpus endometrioid carcinoma | Female | <65 | I/II | Unknown | Unknown | SD |
| CXCL1 | SNV | Missense_Mutation | novel | c.260N>G | p.Asn87Ser | p.N87S | P09341 | protein_coding | deleterious(0.02) | probably_damaging(0.963) | TCGA-A5-A1OF-01 | Endometrium | uterine corpus endometrioid carcinoma | Female | <65 | I/II | Unknown | Unknown | SD |
| CXCL1 | SNV | Missense_Mutation | rs773534431 | c.245G>A | p.Arg82Gln | p.R82Q | P09341 | protein_coding | tolerated(1) | benign(0) | TCGA-AJ-A23O-01 | Endometrium | uterine corpus endometrioid carcinoma | Female | >=65 | I/II | Unknown | Unknown | SD |
| CXCL1 | SNV | Missense_Mutation | | c.217G>A | p.Glu73Lys | p.E73K | P09341 | protein_coding | deleterious(0) | probably_damaging(1) | TCGA-AP-A1E0-01 | Endometrium | uterine corpus endometrioid carcinoma | Female | <65 | III/IV | Chemotherapy | paclitaxel | SD |
| CXCL1 | SNV | Missense_Mutation | | c.152N>A | p.Gly51Glu | p.G51E | P09341 | protein_coding | deleterious(0) | probably_damaging(0.998) | TCGA-B5-A11N-01 | Endometrium | uterine corpus endometrioid carcinoma | Female | >=65 | I/II | Unknown | Unknown | SD |
| CXCL1 | SNV | Missense_Mutation | | c.297G>T | p.Lys99Asn | p.K99N | P09341 | protein_coding | deleterious(0) | probably_damaging(0.996) | TCGA-B5-A1MR-01 | Endometrium | uterine corpus endometrioid carcinoma | Female | >=65 | III/IV | Unknown | Unknown | SD |


