
|
|||||
|
 | |
| |
| |
| |
| |
| |
|
Gene: ZFP36L2 |
Gene summary for ZFP36L2 |
| Gene information | Species | Human | Gene symbol | ZFP36L2 | Gene ID | 678 |
| Gene name | ZFP36 ring finger protein like 2 | |
| Gene Alias | BRF2 | |
| Cytomap | 2p21 | |
| Gene Type | protein-coding | GO ID | GO:0000165 | UniProtAcc | P47974 |
Top |
Malignant transformation analysis |
| Identification of the aberrant gene expression in precancerous and cancerous lesions by comparing the gene expression of stem-like cells in diseased tissues with normal stem cells |
| Entrez ID | Symbol | Replicates | Species | Organ | Tissue | Adj P-value | Log2FC | Malignancy |
| 678 | ZFP36L2 | GSM4909281 | Human | Breast | IDC | 4.01e-02 | -2.68e-01 | 0.21 |
| 678 | ZFP36L2 | GSM4909282 | Human | Breast | IDC | 2.61e-16 | 5.70e-01 | -0.0288 |
| 678 | ZFP36L2 | GSM4909285 | Human | Breast | IDC | 6.31e-10 | -3.03e-01 | 0.21 |
| 678 | ZFP36L2 | GSM4909286 | Human | Breast | IDC | 3.52e-14 | -5.12e-01 | 0.1081 |
| 678 | ZFP36L2 | GSM4909290 | Human | Breast | IDC | 1.50e-04 | -5.10e-01 | 0.2096 |
| 678 | ZFP36L2 | GSM4909291 | Human | Breast | IDC | 4.35e-03 | -4.76e-01 | 0.1753 |
| 678 | ZFP36L2 | GSM4909293 | Human | Breast | IDC | 2.71e-05 | -4.26e-01 | 0.1581 |
| 678 | ZFP36L2 | GSM4909294 | Human | Breast | IDC | 1.33e-03 | -3.12e-01 | 0.2022 |
| 678 | ZFP36L2 | GSM4909296 | Human | Breast | IDC | 2.43e-17 | -5.86e-01 | 0.1524 |
| 678 | ZFP36L2 | GSM4909297 | Human | Breast | IDC | 1.81e-11 | -4.31e-01 | 0.1517 |
| 678 | ZFP36L2 | GSM4909301 | Human | Breast | IDC | 2.45e-11 | -5.42e-01 | 0.1577 |
| 678 | ZFP36L2 | GSM4909302 | Human | Breast | IDC | 1.39e-02 | -3.62e-01 | 0.1545 |
| 678 | ZFP36L2 | GSM4909304 | Human | Breast | IDC | 9.90e-11 | -5.62e-01 | 0.1636 |
| 678 | ZFP36L2 | GSM4909305 | Human | Breast | IDC | 1.42e-06 | 3.73e-01 | 0.0436 |
| 678 | ZFP36L2 | GSM4909307 | Human | Breast | IDC | 4.40e-14 | -6.04e-01 | 0.1569 |
| 678 | ZFP36L2 | GSM4909308 | Human | Breast | IDC | 6.80e-13 | -6.41e-01 | 0.158 |
| 678 | ZFP36L2 | GSM4909311 | Human | Breast | IDC | 9.12e-35 | -7.03e-01 | 0.1534 |
| 678 | ZFP36L2 | GSM4909312 | Human | Breast | IDC | 2.70e-07 | -4.58e-01 | 0.1552 |
| 678 | ZFP36L2 | GSM4909315 | Human | Breast | IDC | 1.62e-19 | -6.40e-01 | 0.21 |
| 678 | ZFP36L2 | GSM4909316 | Human | Breast | IDC | 6.23e-03 | -5.78e-01 | 0.21 |
| Page: 1 2 3 4 5 6 7 8 9 10 11 12 13 14 15 |
| Tissue | Expression Dynamics | Abbreviation |
| Breast | 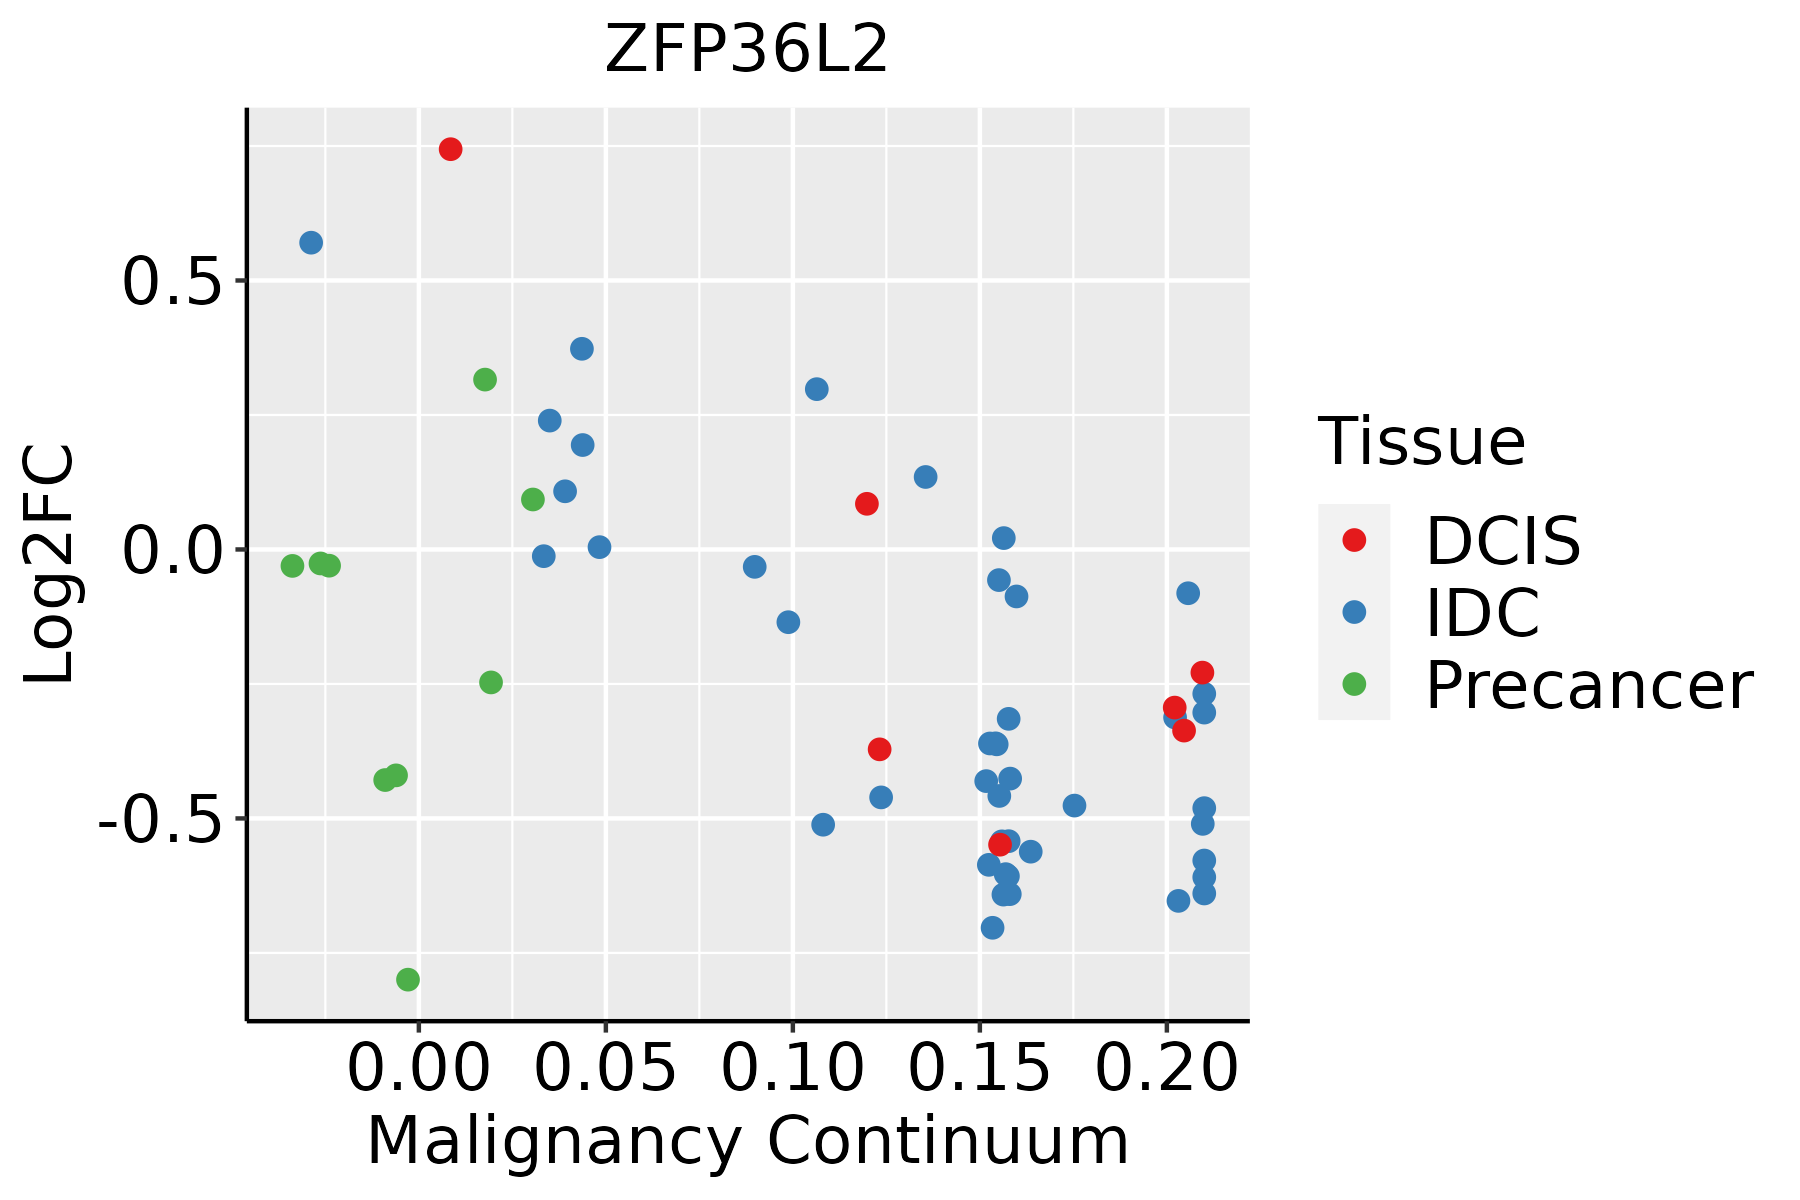 | IDC: Invasive ductal carcinoma |
| DCIS: Ductal carcinoma in situ | ||
| Precancer(BRCA1-mut): Precancerous lesion from BRCA1 mutation carriers | ||
| Cervix | 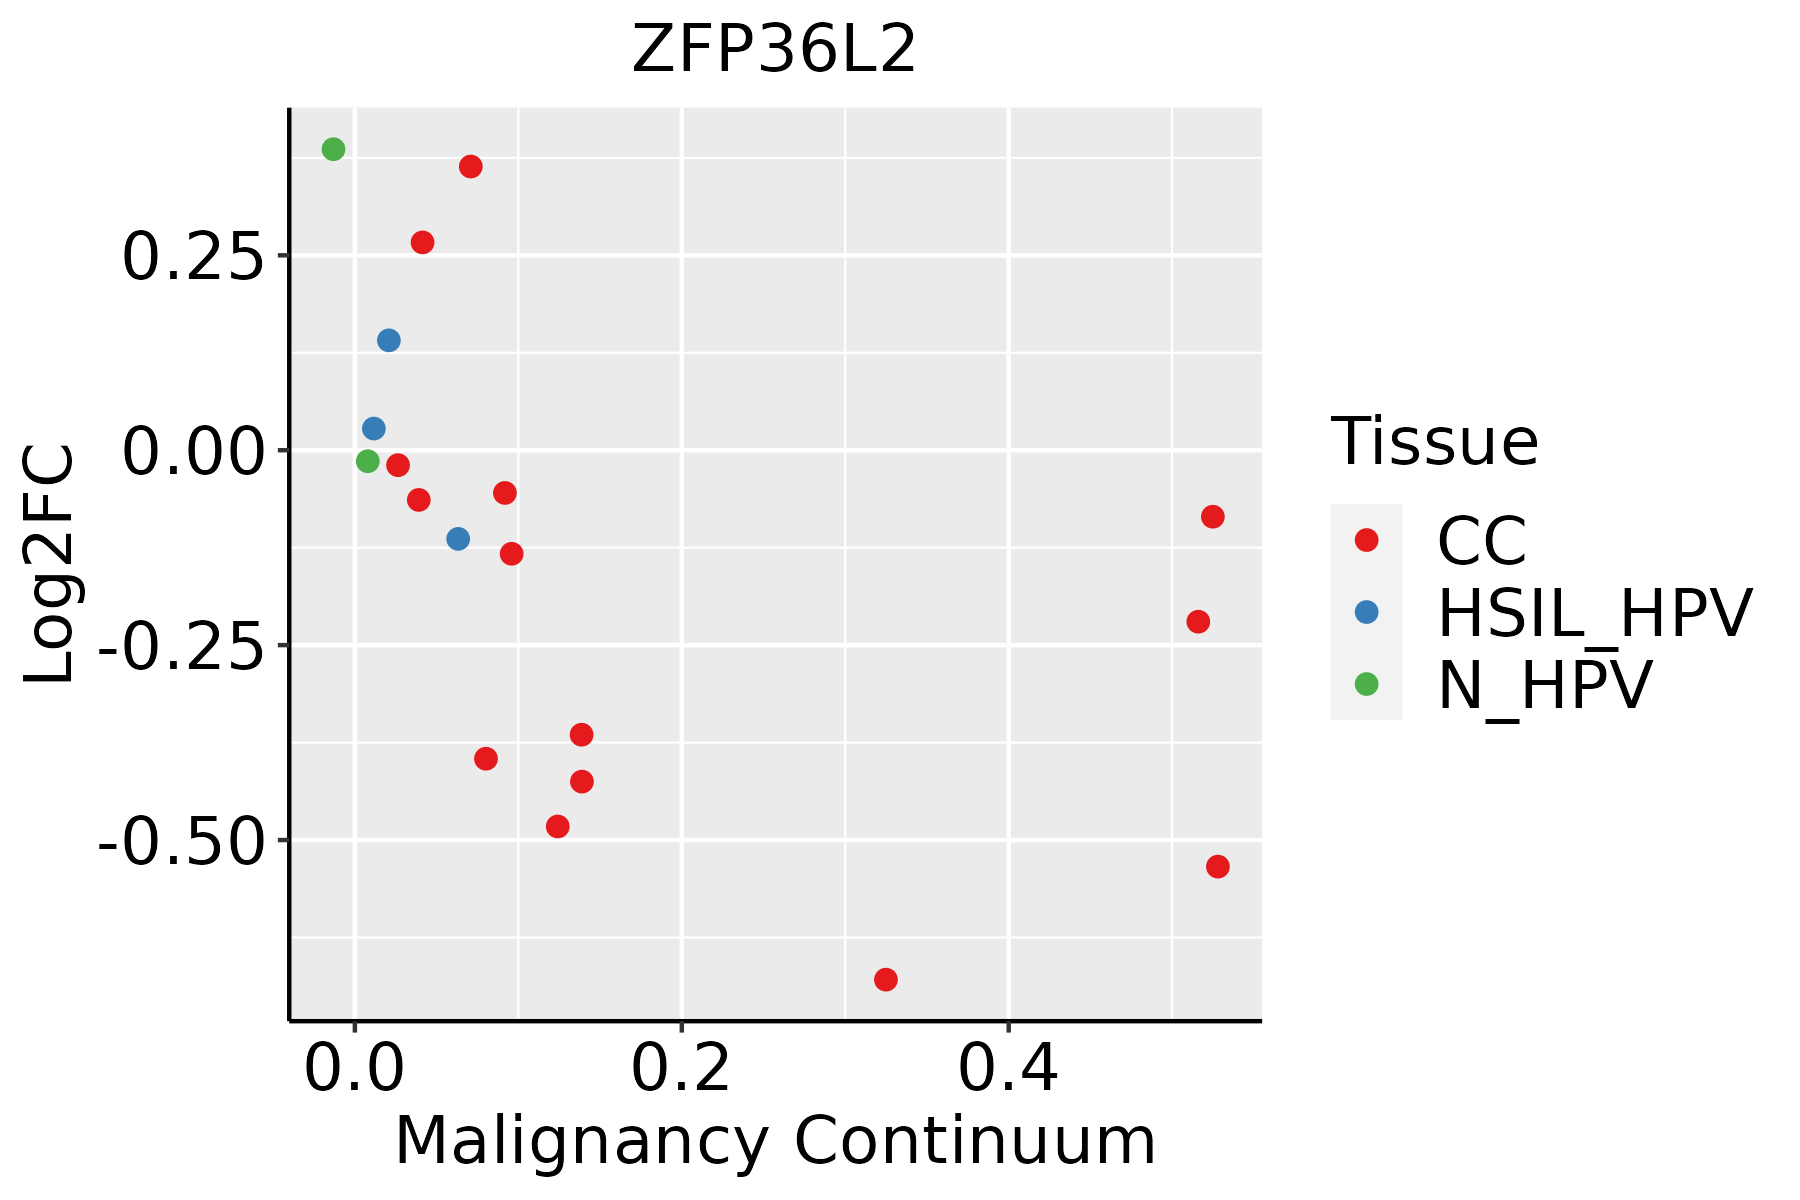 | CC: Cervix cancer |
| HSIL_HPV: HPV-infected high-grade squamous intraepithelial lesions | ||
| N_HPV: HPV-infected normal cervix | ||
| Colorectum (GSE201348) |  | FAP: Familial adenomatous polyposis |
| CRC: Colorectal cancer | ||
| Colorectum (HTA11) |  | AD: Adenomas |
| SER: Sessile serrated lesions | ||
| MSI-H: Microsatellite-high colorectal cancer | ||
| MSS: Microsatellite stable colorectal cancer | ||
| Endometrium | 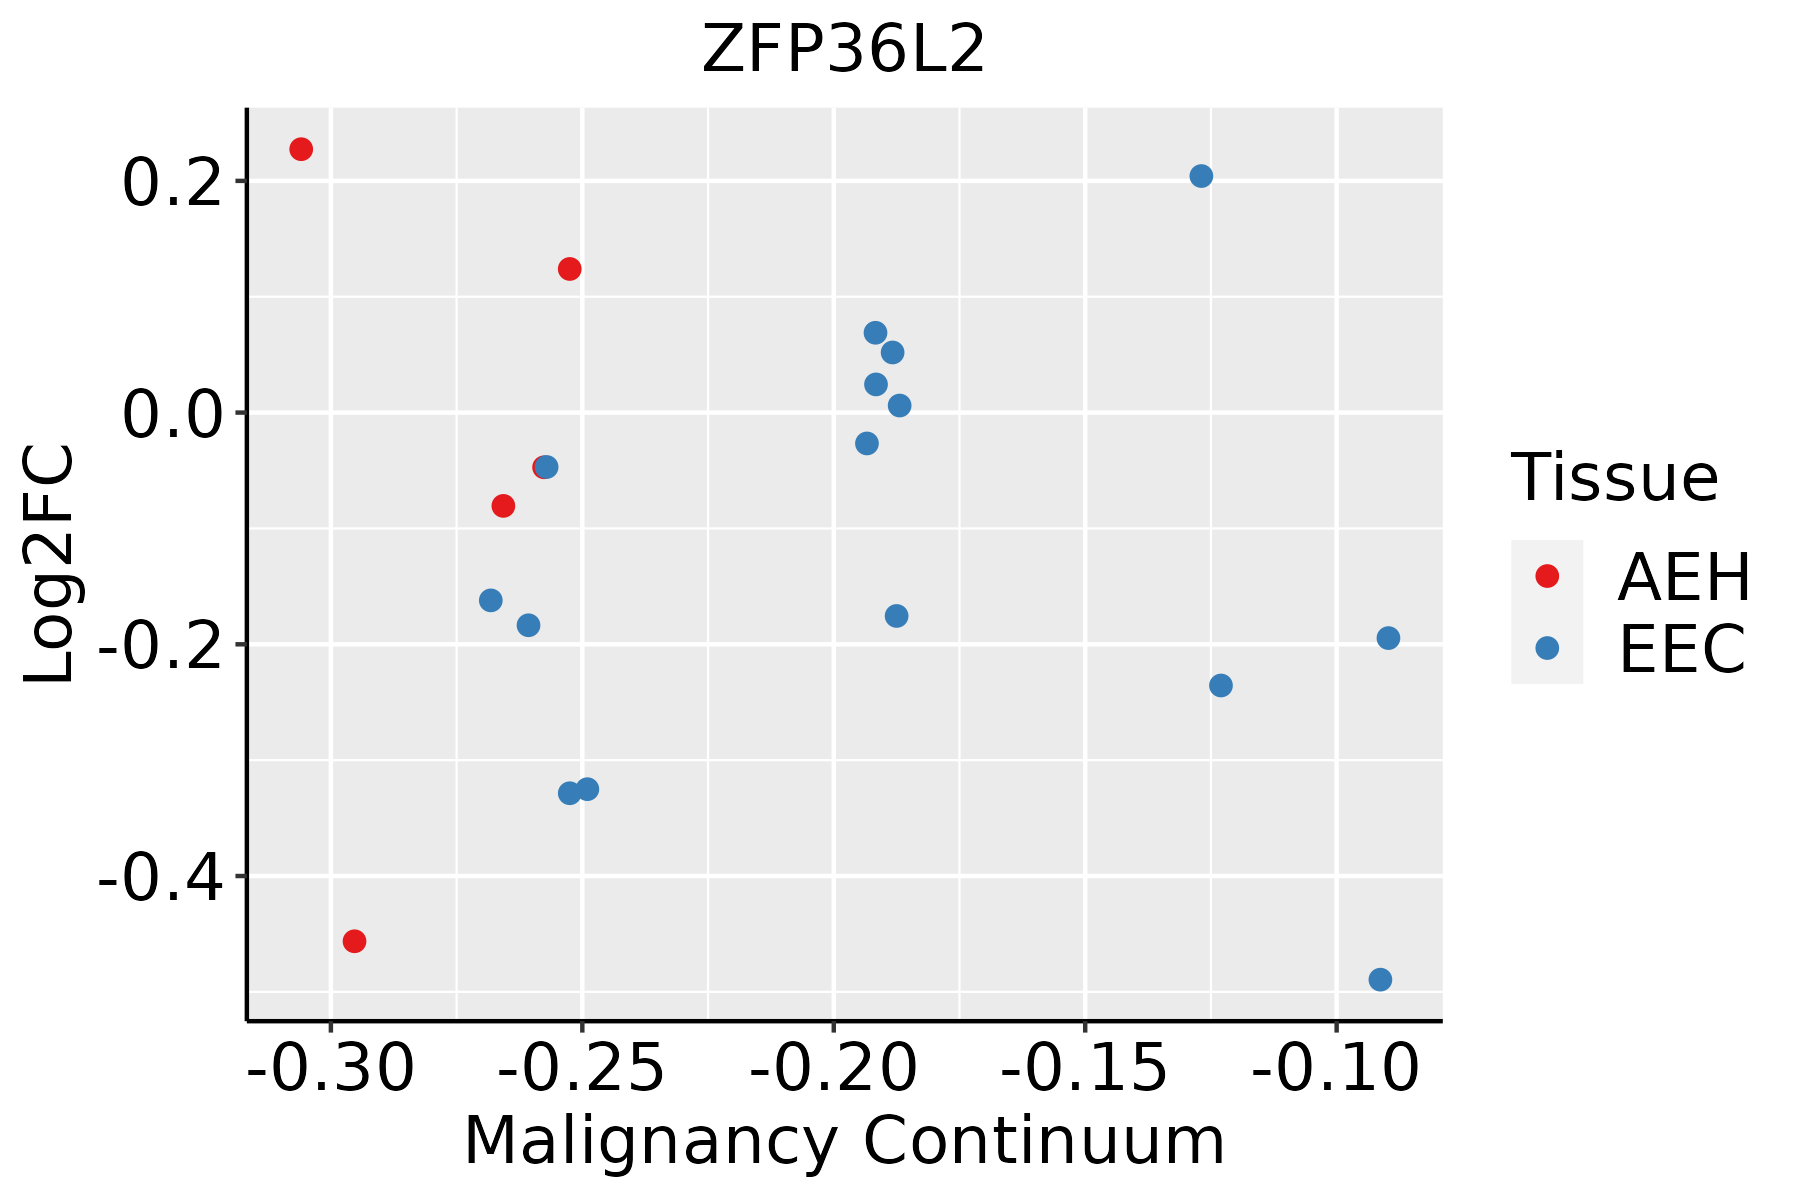 | AEH: Atypical endometrial hyperplasia |
| EEC: Endometrioid Cancer | ||
| Esophagus | 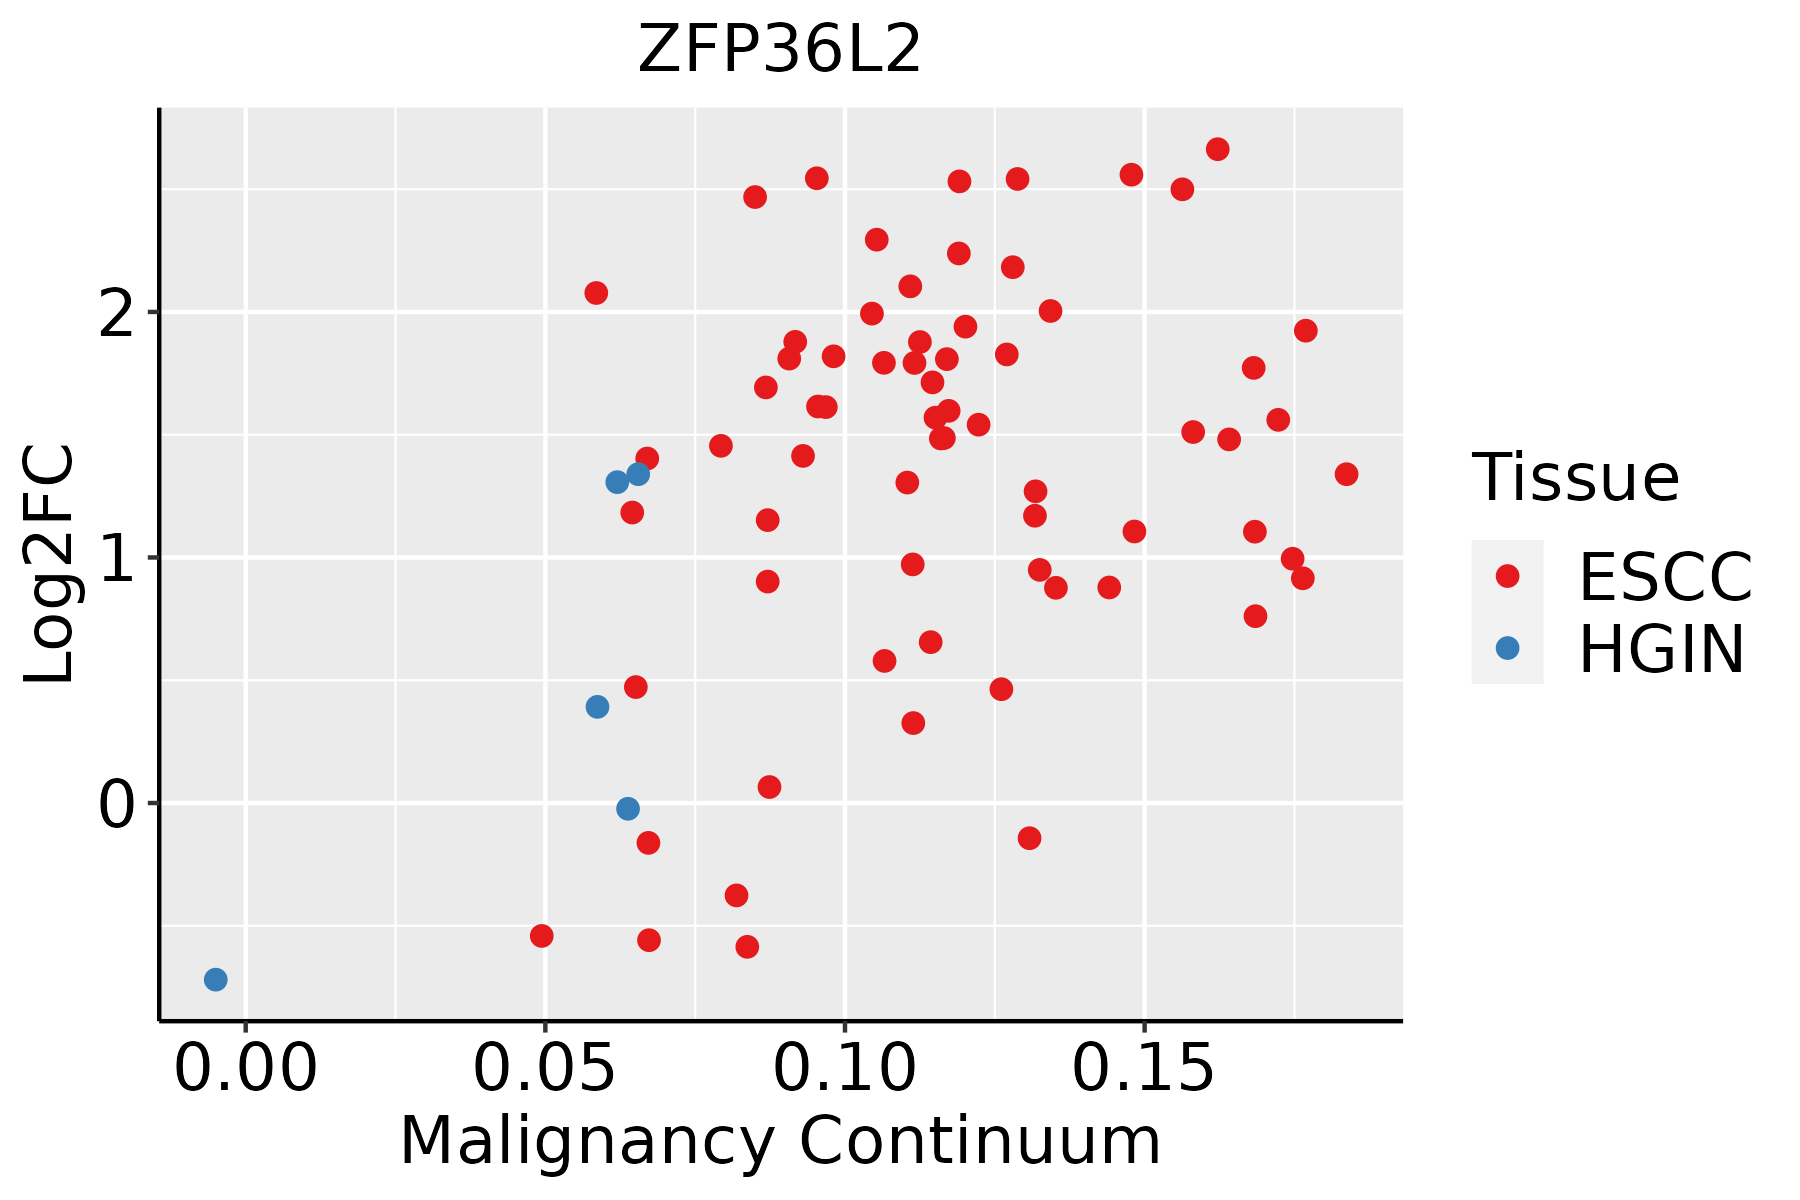 | ESCC: Esophageal squamous cell carcinoma |
| HGIN: High-grade intraepithelial neoplasias | ||
| LGIN: Low-grade intraepithelial neoplasias | ||
| GC |  | CAG: Chronic atrophic gastritis |
| CAG with IM: Chronic atrophic gastritis with intestinal metaplasia | ||
| CSG: Chronic superficial gastritis | ||
| GC: Gastric cancer | ||
| SIM: Severe intestinal metaplasia | ||
| WIM: Wild intestinal metaplasia | ||
| Liver |  | HCC: Hepatocellular carcinoma |
| NAFLD: Non-alcoholic fatty liver disease | ||
| Oral Cavity |  | EOLP: Erosive Oral lichen planus |
| LP: leukoplakia | ||
| NEOLP: Non-erosive oral lichen planus | ||
| OSCC: Oral squamous cell carcinoma | ||
| Prostate | 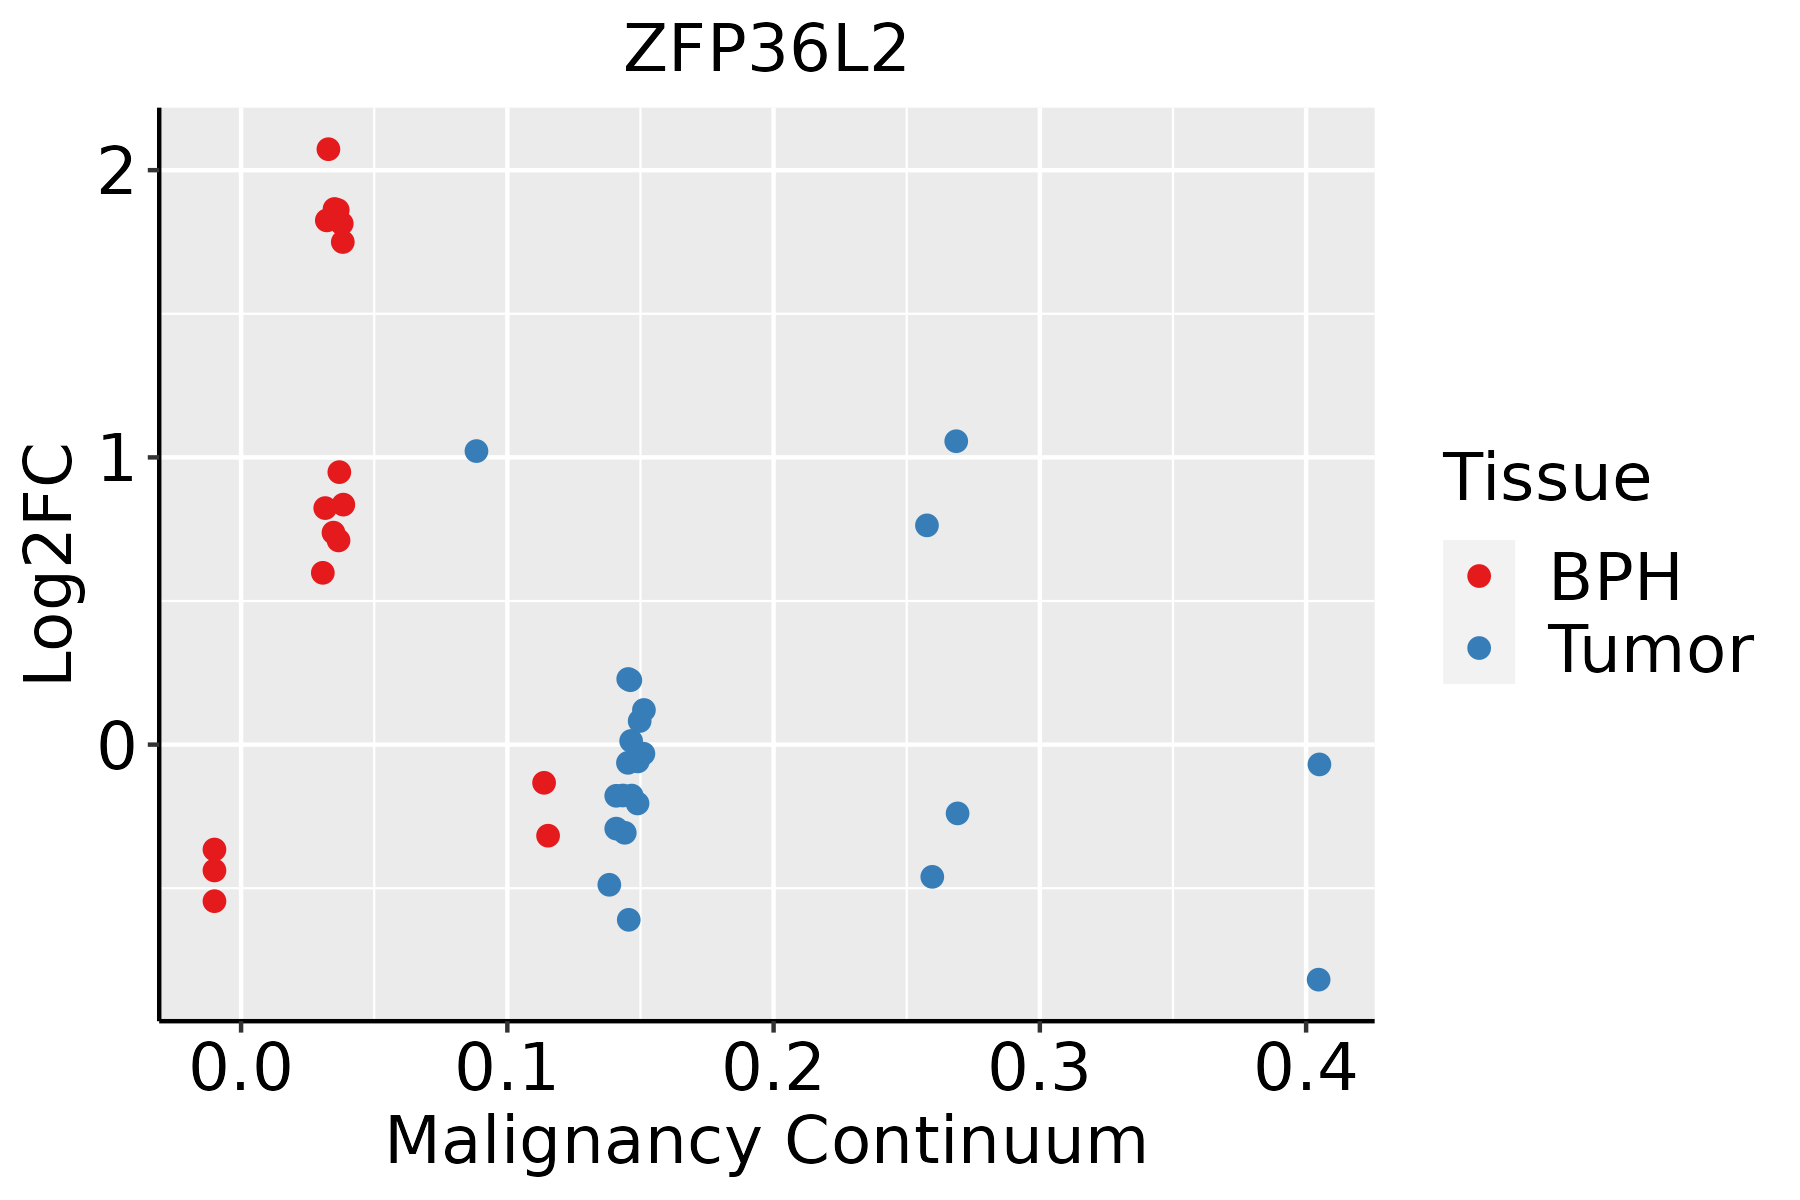 | BPH: Benign Prostatic Hyperplasia |
| Skin | 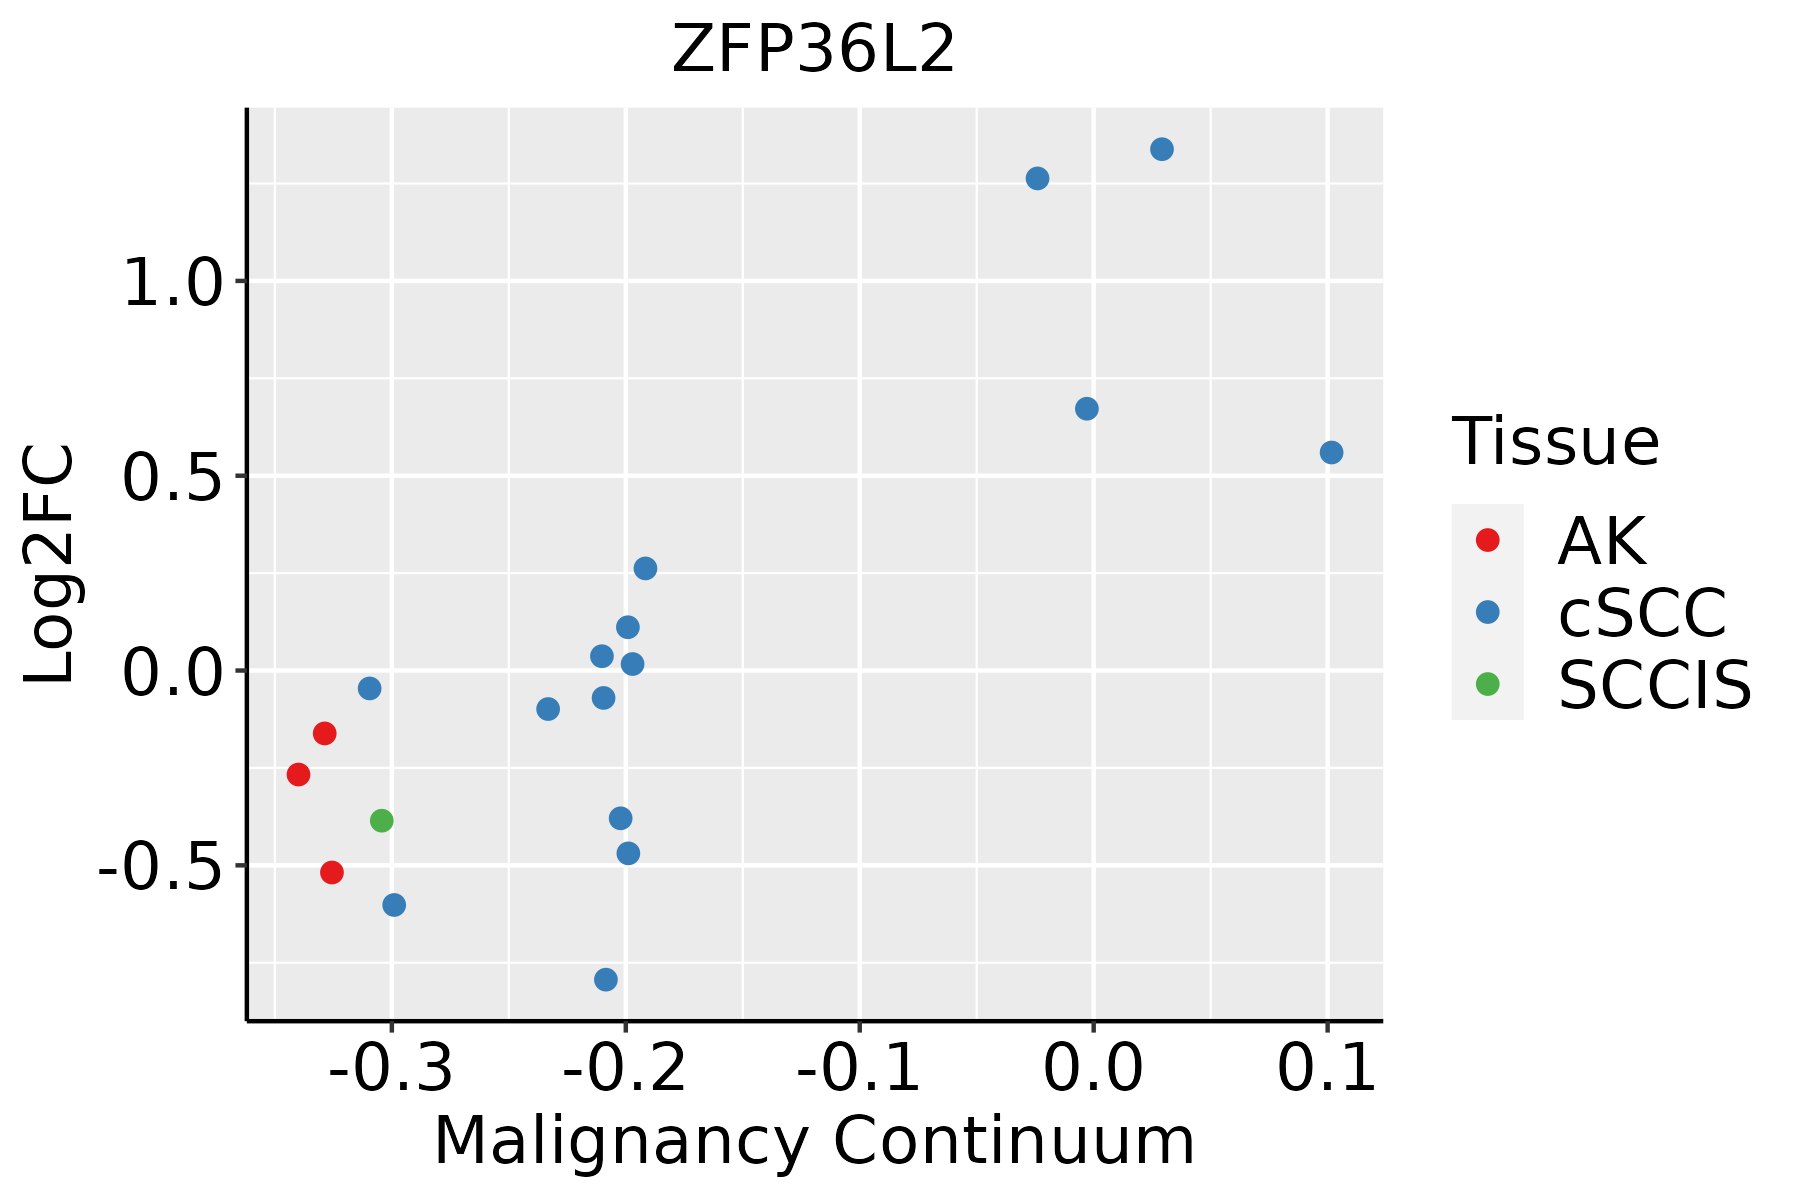 | AK: Actinic keratosis |
| cSCC: Cutaneous squamous cell carcinoma | ||
| SCCIS:squamous cell carcinoma in situ | ||
| Thyroid | 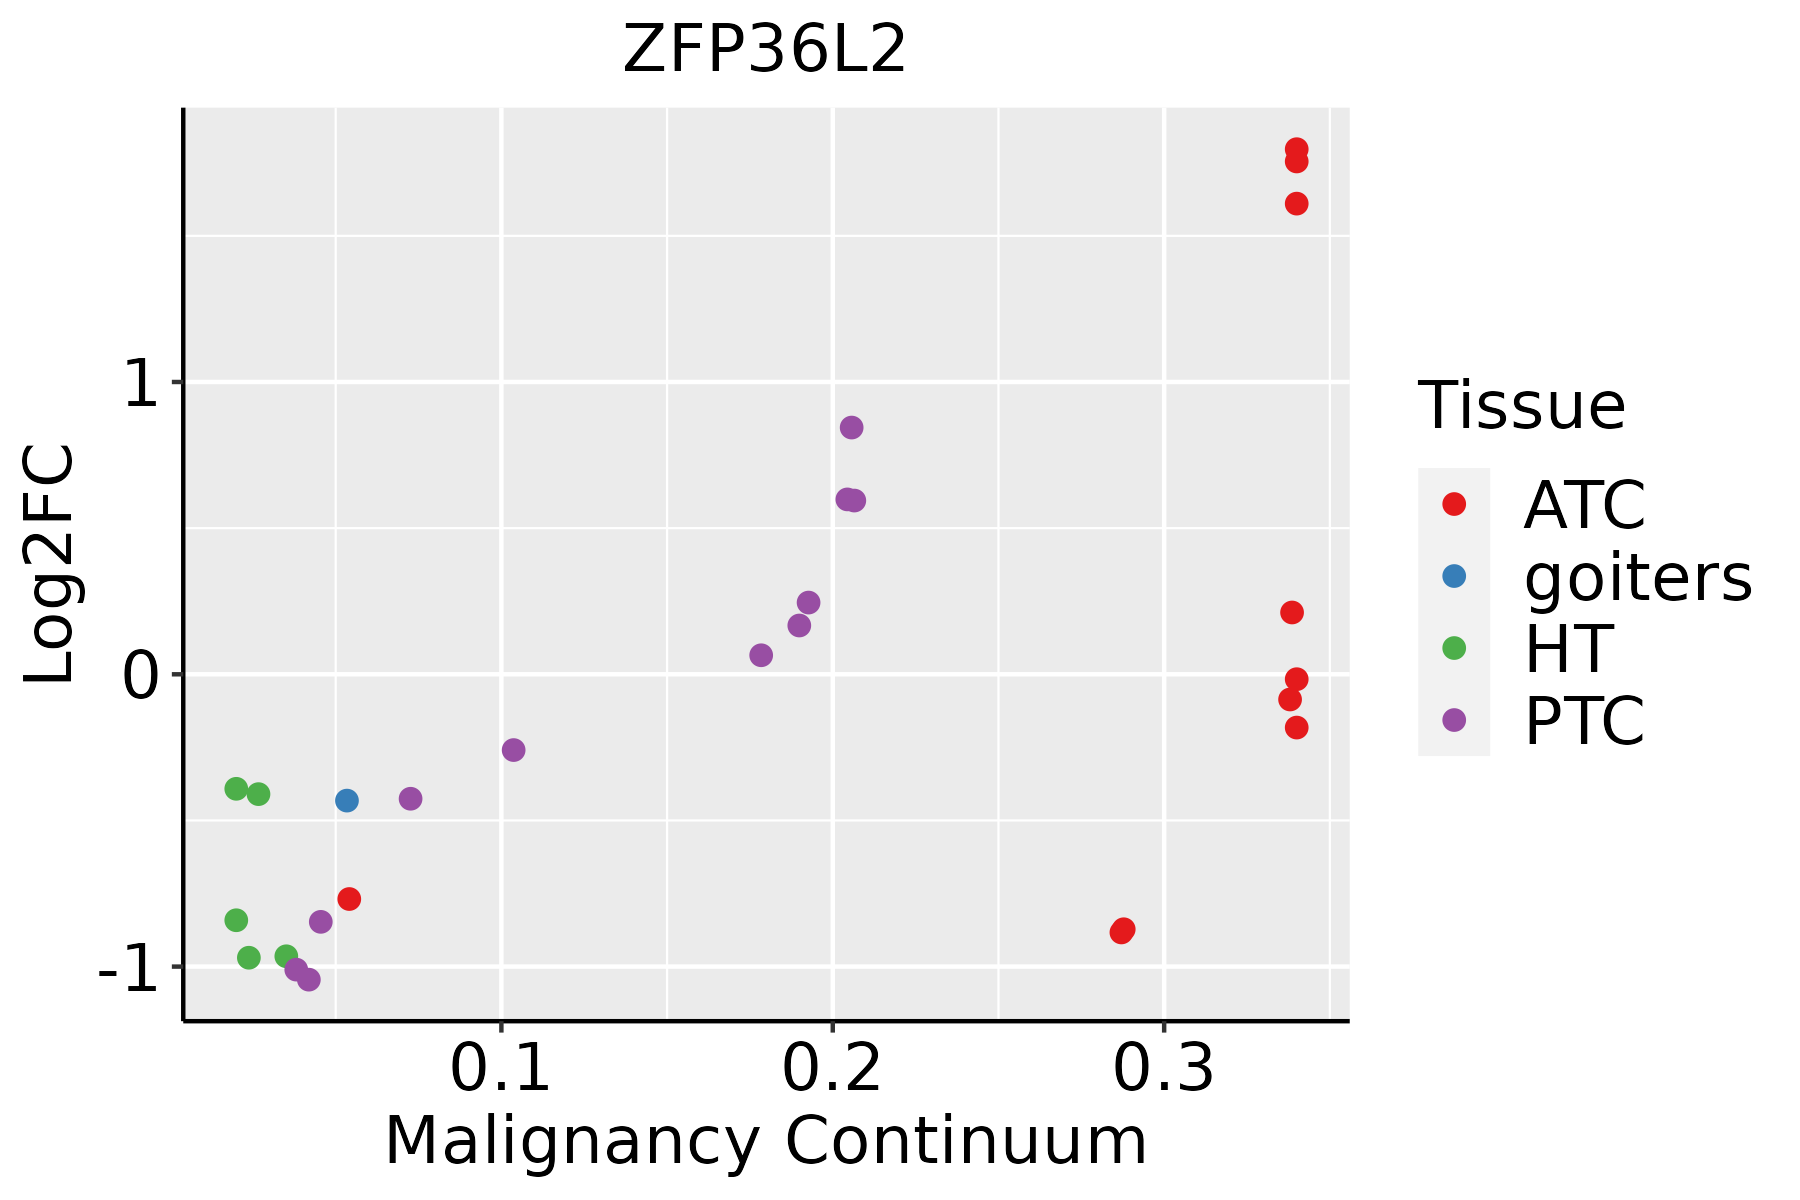 | ATC: Anaplastic thyroid cancer |
| HT: Hashimoto's thyroiditis | ||
| PTC: Papillary thyroid cancer |
| ∗log2FC in expression of this searched gene in stem-like cells from each diseased tissue sample relative to stem-like cells in normal samples in each tissue plotted against the malignancy continuum. Samples are colored based on if they are from different disease stage. |
Top |
Malignant transformation related pathway analysis |
| Find out the enriched GO biological processes and KEGG pathways involved in transition from healthy to precancer to cancer |
| Tissue | Disease Stage | Enriched GO biological Processes |
| Colorectum | AD |  |
| Colorectum | SER |  |
| Colorectum | MSS |  |
| Colorectum | MSI-H |  |
| Colorectum | FAP |  |
| ∗Top 15 enriched GO BP terms are showed in the bar plot of each disease state in each tissue. Each row represents a significant GO biological process which is colored according to the -log10(p.adjust). |
| Page: 1 2 3 4 5 6 7 8 9 |
| GO ID | Tissue | Disease Stage | Description | Gene Ratio | Bg Ratio | pvalue | p.adjust | Count |
| GO:007135624 | Skin | AK | cellular response to tumor necrosis factor | 40/1910 | 229/18723 | 4.98e-04 | 4.58e-03 | 40 |
| GO:19019916 | Skin | AK | negative regulation of mitotic cell cycle phase transition | 33/1910 | 179/18723 | 5.67e-04 | 5.06e-03 | 33 |
| GO:19031318 | Skin | AK | mononuclear cell differentiation | 65/1910 | 426/18723 | 6.24e-04 | 5.45e-03 | 65 |
| GO:00456195 | Skin | AK | regulation of lymphocyte differentiation | 32/1910 | 174/18723 | 7.11e-04 | 6.04e-03 | 32 |
| GO:00455985 | Skin | AK | regulation of fat cell differentiation | 27/1910 | 139/18723 | 7.62e-04 | 6.39e-03 | 27 |
| GO:19019884 | Skin | AK | negative regulation of cell cycle phase transition | 42/1910 | 249/18723 | 7.65e-04 | 6.39e-03 | 42 |
| GO:00330772 | Skin | AK | T cell differentiation in thymus | 17/1910 | 75/18723 | 1.22e-03 | 9.32e-03 | 17 |
| GO:190015115 | Skin | AK | regulation of nuclear-transcribed mRNA catabolic process, deadenylation-dependent decay | 7/1910 | 18/18723 | 1.31e-03 | 9.86e-03 | 7 |
| GO:00300985 | Skin | AK | lymphocyte differentiation | 57/1910 | 374/18723 | 1.34e-03 | 1.00e-02 | 57 |
| GO:003461225 | Skin | AK | response to tumor necrosis factor | 41/1910 | 253/18723 | 1.92e-03 | 1.31e-02 | 41 |
| GO:00350191 | Skin | AK | somatic stem cell population maintenance | 11/1910 | 42/18723 | 2.61e-03 | 1.68e-02 | 11 |
| GO:004670019 | Skin | AK | heterocycle catabolic process | 64/1910 | 445/18723 | 3.01e-03 | 1.88e-02 | 64 |
| GO:00109485 | Skin | AK | negative regulation of cell cycle process | 45/1910 | 294/18723 | 3.73e-03 | 2.22e-02 | 45 |
| GO:004427020 | Skin | AK | cellular nitrogen compound catabolic process | 64/1910 | 451/18723 | 4.11e-03 | 2.41e-02 | 64 |
| GO:00611585 | Skin | AK | 3'-UTR-mediated mRNA destabilization | 6/1910 | 17/18723 | 5.13e-03 | 2.87e-02 | 6 |
| GO:001943919 | Skin | AK | aromatic compound catabolic process | 65/1910 | 467/18723 | 5.99e-03 | 3.24e-02 | 65 |
| GO:00703717 | Skin | AK | ERK1 and ERK2 cascade | 48/1910 | 330/18723 | 7.52e-03 | 3.83e-02 | 48 |
| GO:000028817 | Skin | AK | nuclear-transcribed mRNA catabolic process, deadenylation-dependent decay | 12/1910 | 56/18723 | 9.73e-03 | 4.72e-02 | 12 |
| GO:190136119 | Skin | AK | organic cyclic compound catabolic process | 67/1910 | 495/18723 | 9.91e-03 | 4.80e-02 | 67 |
| GO:0042110110 | Skin | SCCIS | T cell activation | 53/919 | 487/18723 | 4.77e-08 | 8.19e-06 | 53 |
| Page: 1 2 3 4 5 6 7 8 9 10 11 12 13 14 15 16 17 18 19 20 21 22 23 24 25 26 27 28 29 30 31 32 33 34 35 36 37 38 39 40 41 42 43 44 45 46 47 48 49 50 51 52 53 54 55 56 57 58 59 60 61 |
| Pathway ID | Tissue | Disease Stage | Description | Gene Ratio | Bg Ratio | pvalue | p.adjust | qvalue | Count |
| hsa042189 | Breast | Precancer | Cellular senescence | 29/684 | 156/8465 | 1.66e-05 | 1.69e-04 | 1.30e-04 | 29 |
| hsa0421814 | Breast | Precancer | Cellular senescence | 29/684 | 156/8465 | 1.66e-05 | 1.69e-04 | 1.30e-04 | 29 |
| hsa0421824 | Breast | IDC | Cellular senescence | 35/867 | 156/8465 | 5.49e-06 | 7.43e-05 | 5.56e-05 | 35 |
| hsa0421834 | Breast | IDC | Cellular senescence | 35/867 | 156/8465 | 5.49e-06 | 7.43e-05 | 5.56e-05 | 35 |
| hsa0421844 | Breast | DCIS | Cellular senescence | 34/846 | 156/8465 | 8.53e-06 | 1.06e-04 | 7.80e-05 | 34 |
| hsa0421854 | Breast | DCIS | Cellular senescence | 34/846 | 156/8465 | 8.53e-06 | 1.06e-04 | 7.80e-05 | 34 |
| hsa0421810 | Cervix | CC | Cellular senescence | 49/1267 | 156/8465 | 1.30e-07 | 1.63e-06 | 9.61e-07 | 49 |
| hsa0421815 | Cervix | CC | Cellular senescence | 49/1267 | 156/8465 | 1.30e-07 | 1.63e-06 | 9.61e-07 | 49 |
| hsa04218 | Colorectum | AD | Cellular senescence | 53/2092 | 156/8465 | 5.55e-03 | 2.48e-02 | 1.58e-02 | 53 |
| hsa042181 | Colorectum | AD | Cellular senescence | 53/2092 | 156/8465 | 5.55e-03 | 2.48e-02 | 1.58e-02 | 53 |
| hsa042182 | Colorectum | MSS | Cellular senescence | 52/1875 | 156/8465 | 7.87e-04 | 5.07e-03 | 3.11e-03 | 52 |
| hsa042183 | Colorectum | MSS | Cellular senescence | 52/1875 | 156/8465 | 7.87e-04 | 5.07e-03 | 3.11e-03 | 52 |
| hsa042184 | Colorectum | FAP | Cellular senescence | 42/1404 | 156/8465 | 6.79e-04 | 4.63e-03 | 2.82e-03 | 42 |
| hsa042185 | Colorectum | FAP | Cellular senescence | 42/1404 | 156/8465 | 6.79e-04 | 4.63e-03 | 2.82e-03 | 42 |
| hsa0421816 | Endometrium | AEH | Cellular senescence | 37/1197 | 156/8465 | 8.49e-04 | 5.52e-03 | 4.04e-03 | 37 |
| hsa0421817 | Endometrium | AEH | Cellular senescence | 37/1197 | 156/8465 | 8.49e-04 | 5.52e-03 | 4.04e-03 | 37 |
| hsa0421825 | Endometrium | EEC | Cellular senescence | 40/1237 | 156/8465 | 1.89e-04 | 1.68e-03 | 1.25e-03 | 40 |
| hsa0421835 | Endometrium | EEC | Cellular senescence | 40/1237 | 156/8465 | 1.89e-04 | 1.68e-03 | 1.25e-03 | 40 |
| hsa0421829 | Esophagus | ESCC | Cellular senescence | 119/4205 | 156/8465 | 5.89e-12 | 9.40e-11 | 4.81e-11 | 119 |
| hsa0421838 | Esophagus | ESCC | Cellular senescence | 119/4205 | 156/8465 | 5.89e-12 | 9.40e-11 | 4.81e-11 | 119 |
| Page: 1 2 |
Top |
Cell-cell communication analysis |
| Identification of potential cell-cell interactions between two cell types and their ligand-receptor pairs for different disease states |
| Ligand | Receptor | LRpair | Pathway | Tissue | Disease Stage |
| Page: 1 |
Top |
Single-cell gene regulatory network inference analysis |
| Find out the significant the regulons (TFs) and the target genes of each regulon across cell types for different disease states |
| TF | Cell Type | Tissue | Disease Stage | Target Gene | RSS | Regulon Activity |
| ∗The dot plots of a searched regulon are shown for all cell subpopulations in each disease state of each tissue based on the regulon specific score inferred using pySCENIC and by calculating the average expression. |
| Page: 1 |
Top |
Somatic mutation of malignant transformation related genes |
| Annotation of somatic variants for genes involved in malignant transformation |
| Hugo Symbol | Variant Class | Variant Classification | dbSNP RS | HGVSc | HGVSp | HGVSp Short | SWISSPROT | BIOTYPE | SIFT | PolyPhen | Tumor Sample Barcode | Tissue | Histology | Sex | Age | Stage | Therapy Types | Drugs | Outcome |
| ZFP36L2 | SNV | Missense_Mutation | c.376G>C | p.Glu126Gln | p.E126Q | P47974 | protein_coding | deleterious(0) | possibly_damaging(0.86) | TCGA-BH-A0W7-01 | Breast | breast invasive carcinoma | Female | <65 | I/II | Chemotherapy | taxotere | CR | |
| ZFP36L2 | SNV | Missense_Mutation | c.5N>G | p.Ser2Trp | p.S2W | P47974 | protein_coding | deleterious(0) | probably_damaging(1) | TCGA-E2-A10C-01 | Breast | breast invasive carcinoma | Female | <65 | I/II | Chemotherapy | cytoxan | SD | |
| ZFP36L2 | SNV | Missense_Mutation | c.469N>A | p.Glu157Lys | p.E157K | P47974 | protein_coding | deleterious(0) | probably_damaging(0.998) | TCGA-EW-A1PA-01 | Breast | breast invasive carcinoma | Female | <65 | I/II | Chemotherapy | cyclophosphamide | SD | |
| ZFP36L2 | SNV | Missense_Mutation | novel | c.73N>T | p.Leu25Phe | p.L25F | P47974 | protein_coding | tolerated(0.61) | possibly_damaging(0.875) | TCGA-JL-A3YX-01 | Breast | breast invasive carcinoma | Female | <65 | I/II | Unknown | Unknown | SD |
| ZFP36L2 | insertion | Frame_Shift_Ins | novel | c.111_112insG | p.Thr38AspfsTer46 | p.T38Dfs*46 | P47974 | protein_coding | TCGA-AR-A1AQ-01 | Breast | breast invasive carcinoma | Female | <65 | I/II | Chemotherapy | doxorubicin | SD | ||
| ZFP36L2 | SNV | Missense_Mutation | c.57G>C | p.Glu19Asp | p.E19D | P47974 | protein_coding | tolerated(0.21) | benign(0.027) | TCGA-C5-A3HE-01 | Cervix | cervical & endocervical cancer | Female | <65 | I/II | Unknown | Unknown | PD | |
| ZFP36L2 | SNV | Missense_Mutation | c.137N>T | p.Ser46Leu | p.S46L | P47974 | protein_coding | deleterious(0) | benign(0.203) | TCGA-C5-A7CO-01 | Cervix | cervical & endocervical cancer | Female | >=65 | I/II | Chemotherapy | cisplatin | SD | |
| ZFP36L2 | SNV | Missense_Mutation | novel | c.635N>A | p.Cys212Tyr | p.C212Y | P47974 | protein_coding | deleterious(0) | probably_damaging(0.947) | TCGA-C5-A8XH-01 | Cervix | cervical & endocervical cancer | Female | <65 | I/II | Unknown | Unknown | SD |
| ZFP36L2 | SNV | Missense_Mutation | rs761179005 | c.401N>A | p.Leu134His | p.L134H | P47974 | protein_coding | tolerated(0.1) | probably_damaging(0.937) | TCGA-DS-A7WH-01 | Cervix | cervical & endocervical cancer | Female | <65 | I/II | Chemotherapy | cisplatin | CR |
| ZFP36L2 | SNV | Missense_Mutation | novel | c.423G>C | p.Gln141His | p.Q141H | P47974 | protein_coding | tolerated(0.11) | possibly_damaging(0.694) | TCGA-EK-A2PG-01 | Cervix | cervical & endocervical cancer | Female | >=65 | I/II | Unknown | Unknown | SD |
| Page: 1 2 3 4 5 6 7 |
Top |
Related drugs of malignant transformation related genes |
| Identification of chemicals and drugs interact with genes involved in malignant transfromation |
| (DGIdb 4.0) |
| Entrez ID | Symbol | Category | Interaction Types | Drug Claim Name | Drug Name | PMIDs |
| 678 | ZFP36L2 | TRANSCRIPTION FACTOR | BUTYRATE | 10367403 |
| Page: 1 |

Copyright 2023-Present -The University of Texas Health Science Center at Houston |