Schematic overview of the cellular and molecular mechanisms involved in the cancer progression, including the proposed cellular and molecular mechanisms in cancer cells trajectory. AT1: alveolar type 1 cells; AT2: alveolar type 2 cells; AAH: atypical adenomatous hyperplasia; AIS: adenocarcinoma in situ; MIA: minimally invasive adenocarcinoma; IA: invasive adenocarcinoma; EMT: epithelial-mesenchymal transition

Home

Download

Statistics

Help

Contact

Center for Computational Systems Medicine
leaf

Gene summary

leaf

Malignant transformation analysis

leaf

Malignant transformation related pathway analysis

leaf

Cell-cell communication analysis

leaf

Single-cell gene regulatory network inference analysis

leaf

Somatic mutation of malignant transformation related genes

leaf

Related drugs of malignant transformation related genes

Gene: SDCBP

Gene summary for SDCBP

check button Gene summary.

Gene informationSpeciesHuman
Gene symbol

SDCBP

Gene ID

6386

Gene namesyndecan binding protein
Gene AliasMDA-9
Cytomap8q12.1
Gene Typeprotein-coding
GO ID

GO:0000122

UniProtAcc

A0A024R7Z5


Top

Malignant transformation analysis

check button Identification of the aberrant gene expression in precancerous and cancerous lesions by comparing the gene expression of stem-like cells in diseased tissues with normal stem cells
check button Malignant transformation involving gene list.
Entrez IDSymbolReplicatesSpeciesOrganTissueAdj P-valueLog2FCMalignancy
6386SDCBPGSM4909285HumanBreastIDC3.32e-05-2.56e-010.21
6386SDCBPGSM4909286HumanBreastIDC2.74e-11-4.68e-010.1081
6386SDCBPGSM4909290HumanBreastIDC8.18e-18-6.68e-010.2096
6386SDCBPGSM4909293HumanBreastIDC4.15e-12-3.04e-010.1581
6386SDCBPGSM4909294HumanBreastIDC9.47e-04-3.55e-010.2022
6386SDCBPGSM4909296HumanBreastIDC8.42e-29-6.60e-010.1524
6386SDCBPGSM4909297HumanBreastIDC4.15e-18-4.88e-010.1517
6386SDCBPGSM4909298HumanBreastIDC1.53e-29-6.69e-010.1551
6386SDCBPGSM4909301HumanBreastIDC1.82e-10-4.70e-010.1577
6386SDCBPGSM4909302HumanBreastIDC3.32e-07-4.60e-010.1545
6386SDCBPGSM4909307HumanBreastIDC6.93e-21-6.26e-010.1569
6386SDCBPGSM4909308HumanBreastIDC4.81e-09-4.96e-010.158
6386SDCBPGSM4909309HumanBreastIDC5.83e-11-5.30e-010.0483
6386SDCBPGSM4909311HumanBreastIDC2.14e-40-6.79e-010.1534
6386SDCBPGSM4909312HumanBreastIDC4.83e-06-2.38e-010.1552
6386SDCBPGSM4909313HumanBreastIDC7.88e-04-3.82e-010.0391
6386SDCBPGSM4909317HumanBreastIDC8.49e-05-4.06e-010.1355
6386SDCBPGSM4909319HumanBreastIDC6.98e-38-5.15e-010.1563
6386SDCBPGSM4909320HumanBreastIDC1.18e-12-7.27e-010.1575
6386SDCBPGSM4909321HumanBreastIDC4.38e-22-5.15e-010.1559
Page: 1 2 3 4 5 6 7 8 9 10 11 12 13 14 

check button Transcriptomic changes along malignancy continuum.
TissueExpression DynamicsAbbreviation
BreastThe image shows the transcriptomic changes along malignancy continuum.log2FC in expression of this searched gene in stem-like cells from each diseased tissue sample relative to stem-like cells in normal samples in each tissue plotted against the malignancy continuum. Samples are colored based on if they are from different disease stage.
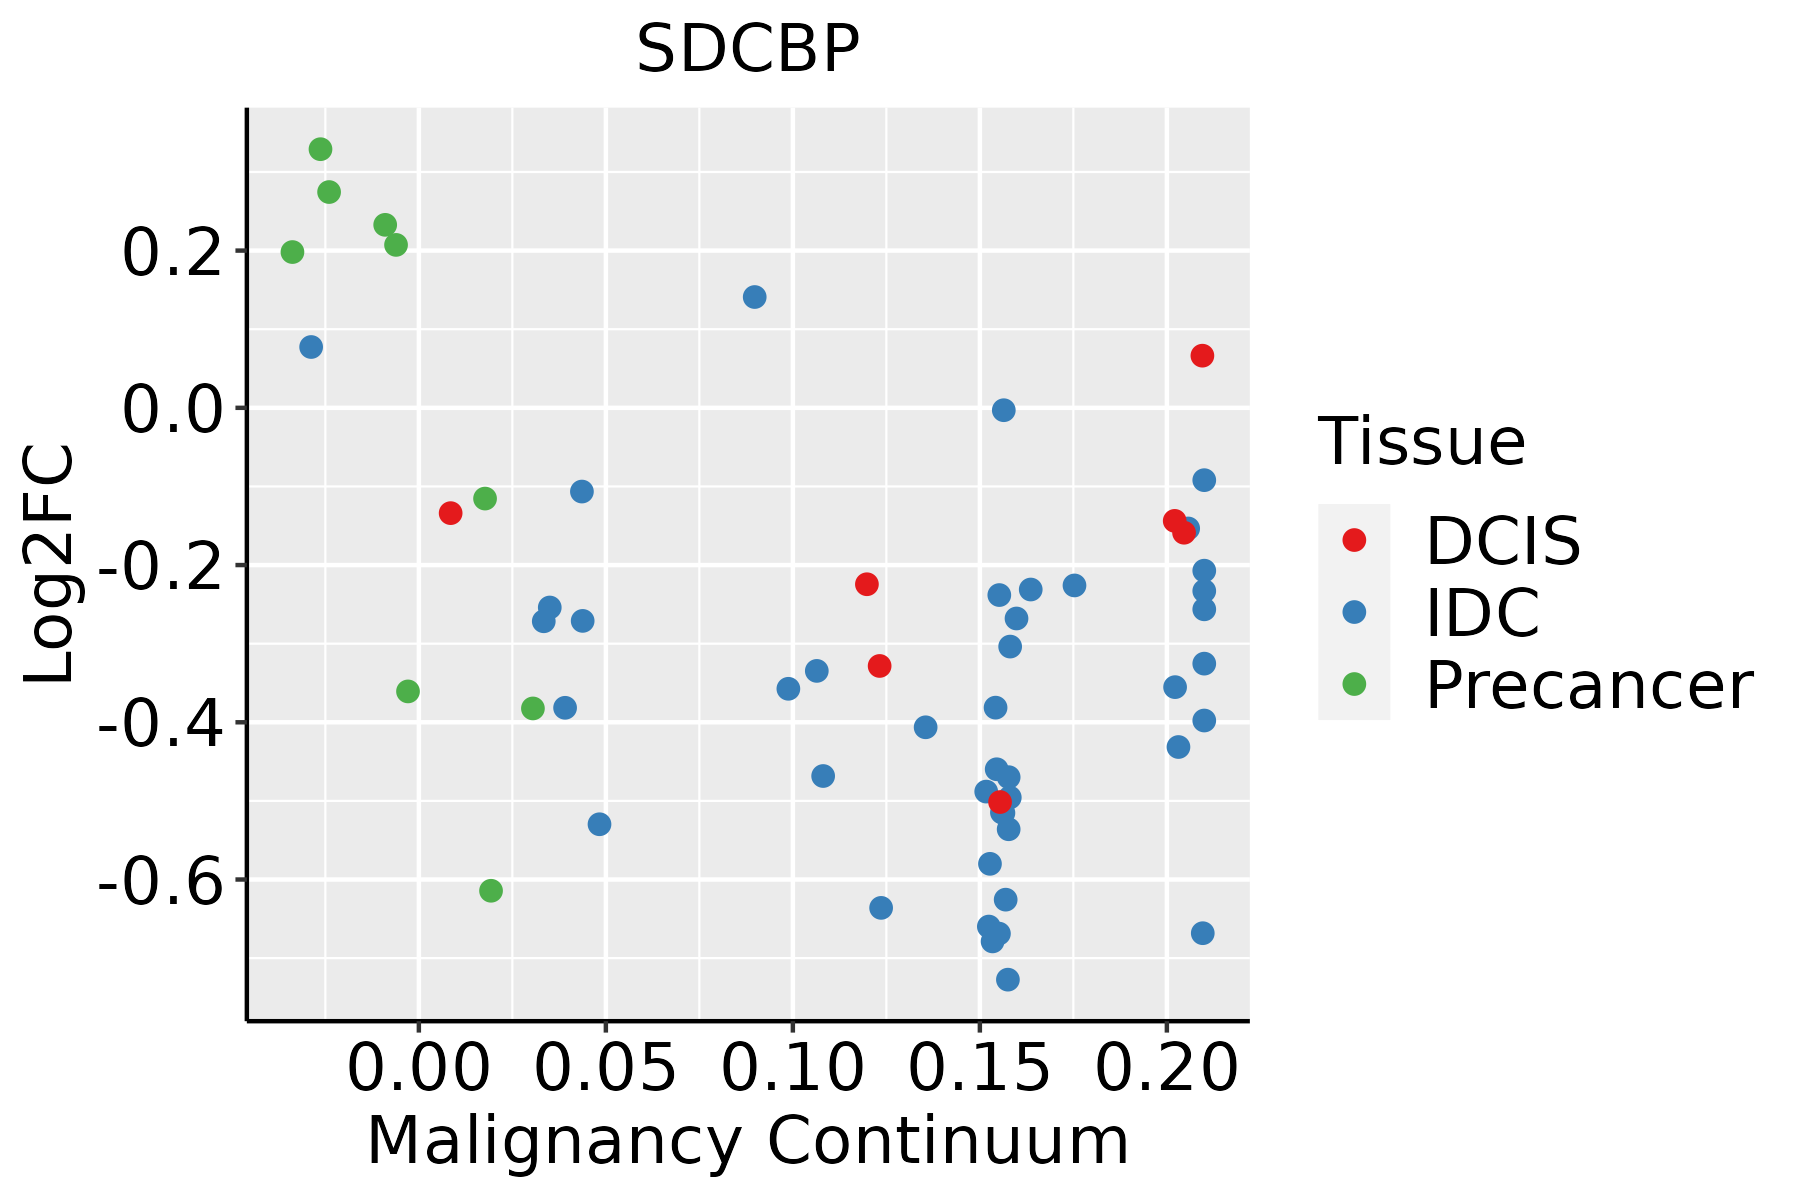
IDC: Invasive ductal carcinoma
DCIS: Ductal carcinoma in situ
Precancer(BRCA1-mut): Precancerous lesion from BRCA1 mutation carriers
CervixThe image shows the transcriptomic changes along malignancy continuum.log2FC in expression of this searched gene in stem-like cells from each diseased tissue sample relative to stem-like cells in normal samples in each tissue plotted against the malignancy continuum. Samples are colored based on if they are from different disease stage.CC: Cervix cancer
HSIL_HPV: HPV-infected high-grade squamous intraepithelial lesions
N_HPV: HPV-infected normal cervix
Colorectum (GSE201348)The image shows the transcriptomic changes along malignancy continuum.log2FC in expression of this searched gene in stem-like cells from each diseased tissue sample relative to stem-like cells in normal samples in each tissue plotted against the malignancy continuum. Samples are colored based on if they are from different disease stage.FAP: Familial adenomatous polyposis
CRC: Colorectal cancer
Colorectum (HTA11)The image shows the transcriptomic changes along malignancy continuum.log2FC in expression of this searched gene in stem-like cells from each diseased tissue sample relative to stem-like cells in normal samples in each tissue plotted against the malignancy continuum. Samples are colored based on if they are from different disease stage.AD: Adenomas
SER: Sessile serrated lesions
MSI-H: Microsatellite-high colorectal cancer
MSS: Microsatellite stable colorectal cancer
EndometriumThe image shows the transcriptomic changes along malignancy continuum.log2FC in expression of this searched gene in stem-like cells from each diseased tissue sample relative to stem-like cells in normal samples in each tissue plotted against the malignancy continuum. Samples are colored based on if they are from different disease stage.
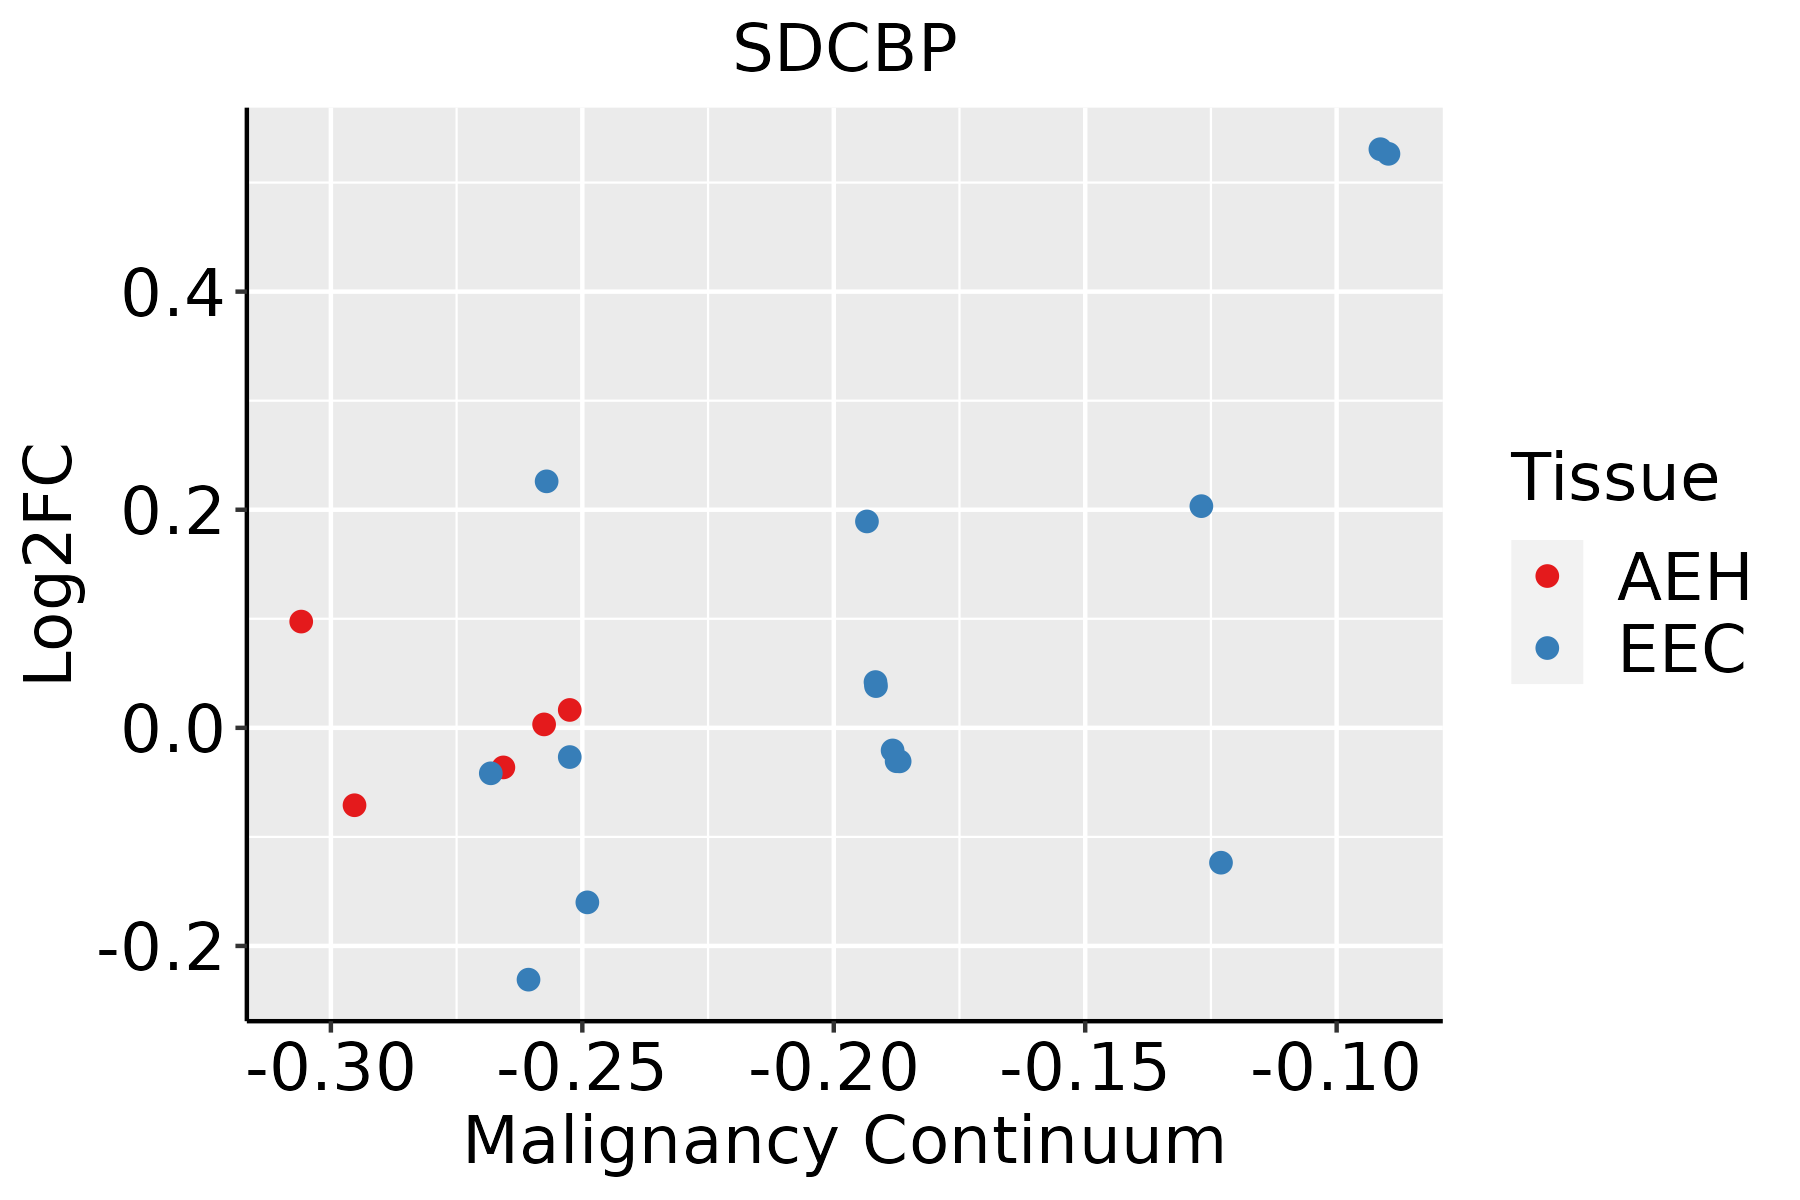
AEH: Atypical endometrial hyperplasia
EEC: Endometrioid Cancer
EsophagusThe image shows the transcriptomic changes along malignancy continuum.log2FC in expression of this searched gene in stem-like cells from each diseased tissue sample relative to stem-like cells in normal samples in each tissue plotted against the malignancy continuum. Samples are colored based on if they are from different disease stage.
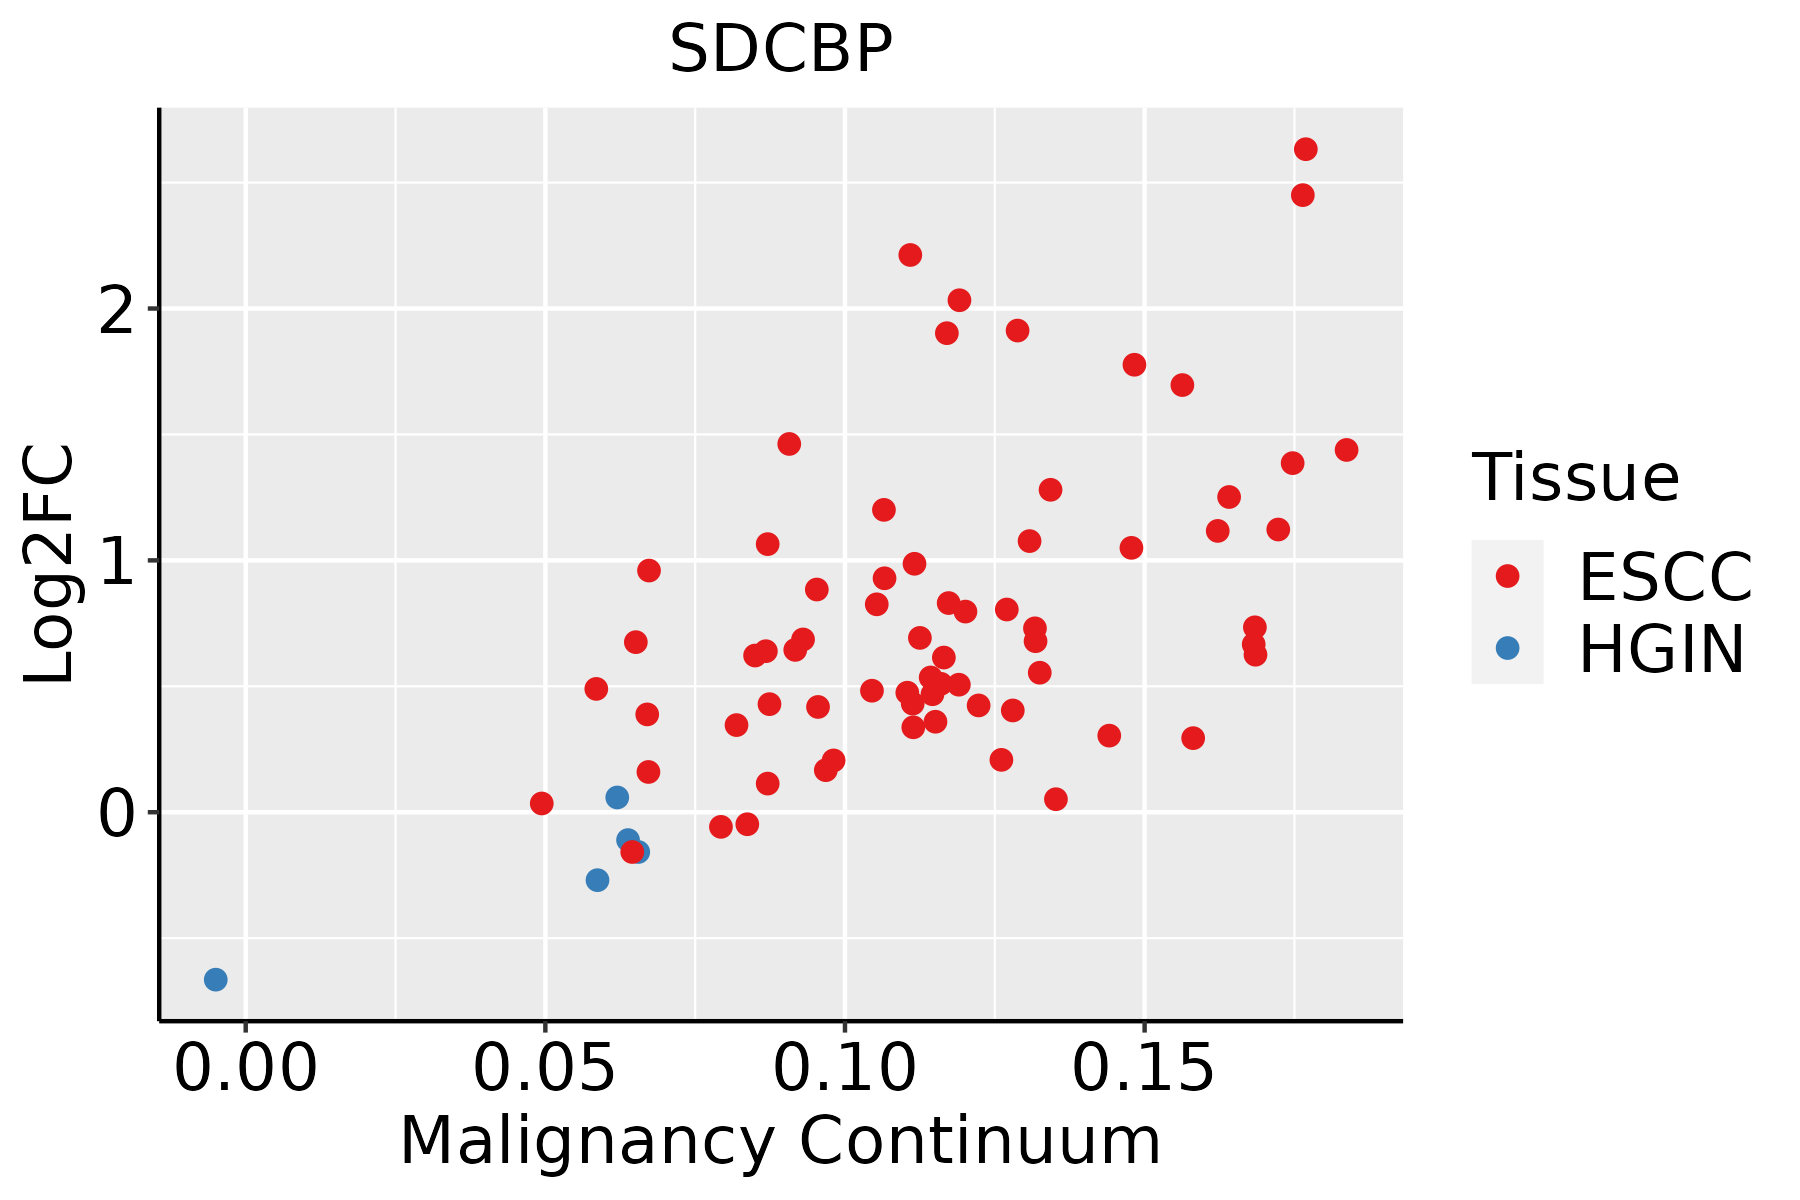
ESCC: Esophageal squamous cell carcinoma
HGIN: High-grade intraepithelial neoplasias
LGIN: Low-grade intraepithelial neoplasias
GCThe image shows the transcriptomic changes along malignancy continuum.log2FC in expression of this searched gene in stem-like cells from each diseased tissue sample relative to stem-like cells in normal samples in each tissue plotted against the malignancy continuum. Samples are colored based on if they are from different disease stage.
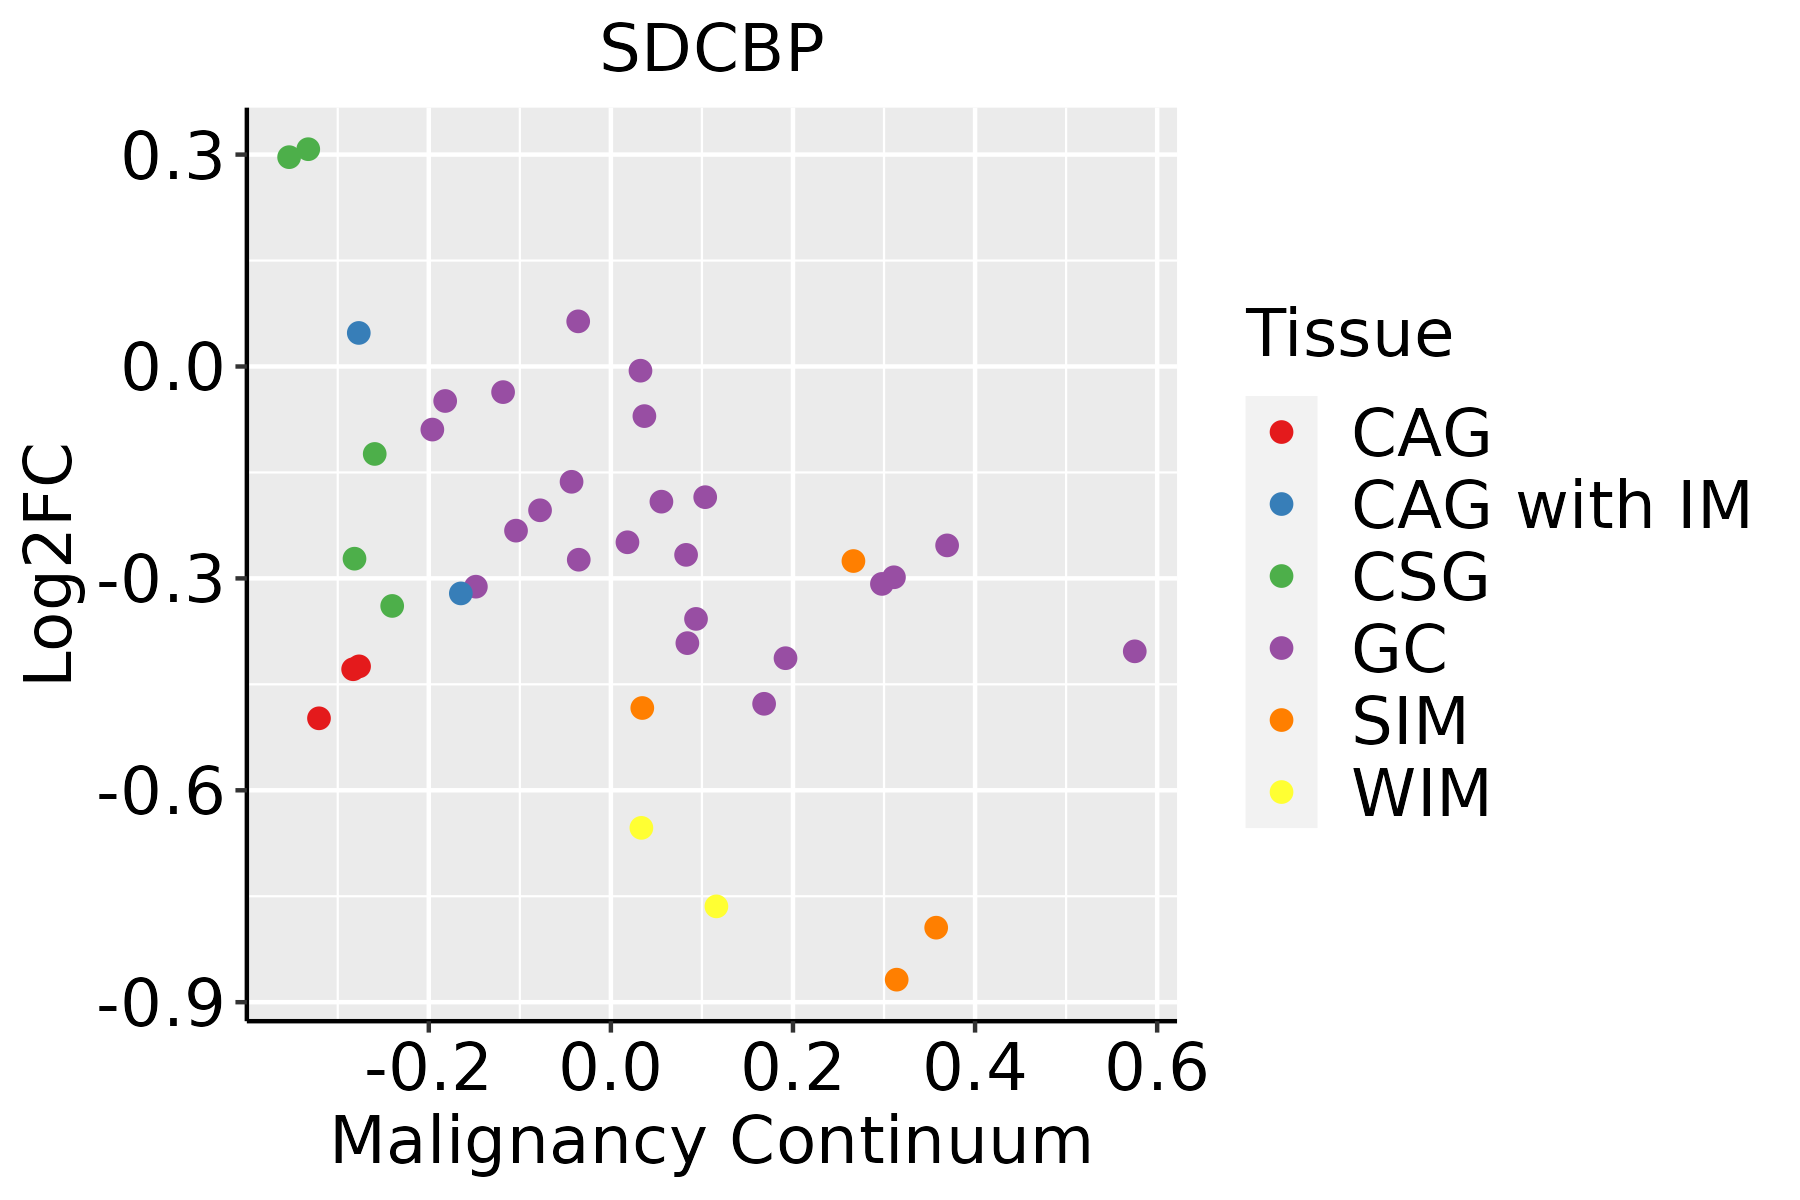
CAG: Chronic atrophic gastritis
CAG with IM: Chronic atrophic gastritis with intestinal metaplasia
CSG: Chronic superficial gastritis
GC: Gastric cancer
SIM: Severe intestinal metaplasia
WIM: Wild intestinal metaplasia
LiverThe image shows the transcriptomic changes along malignancy continuum.log2FC in expression of this searched gene in stem-like cells from each diseased tissue sample relative to stem-like cells in normal samples in each tissue plotted against the malignancy continuum. Samples are colored based on if they are from different disease stage.
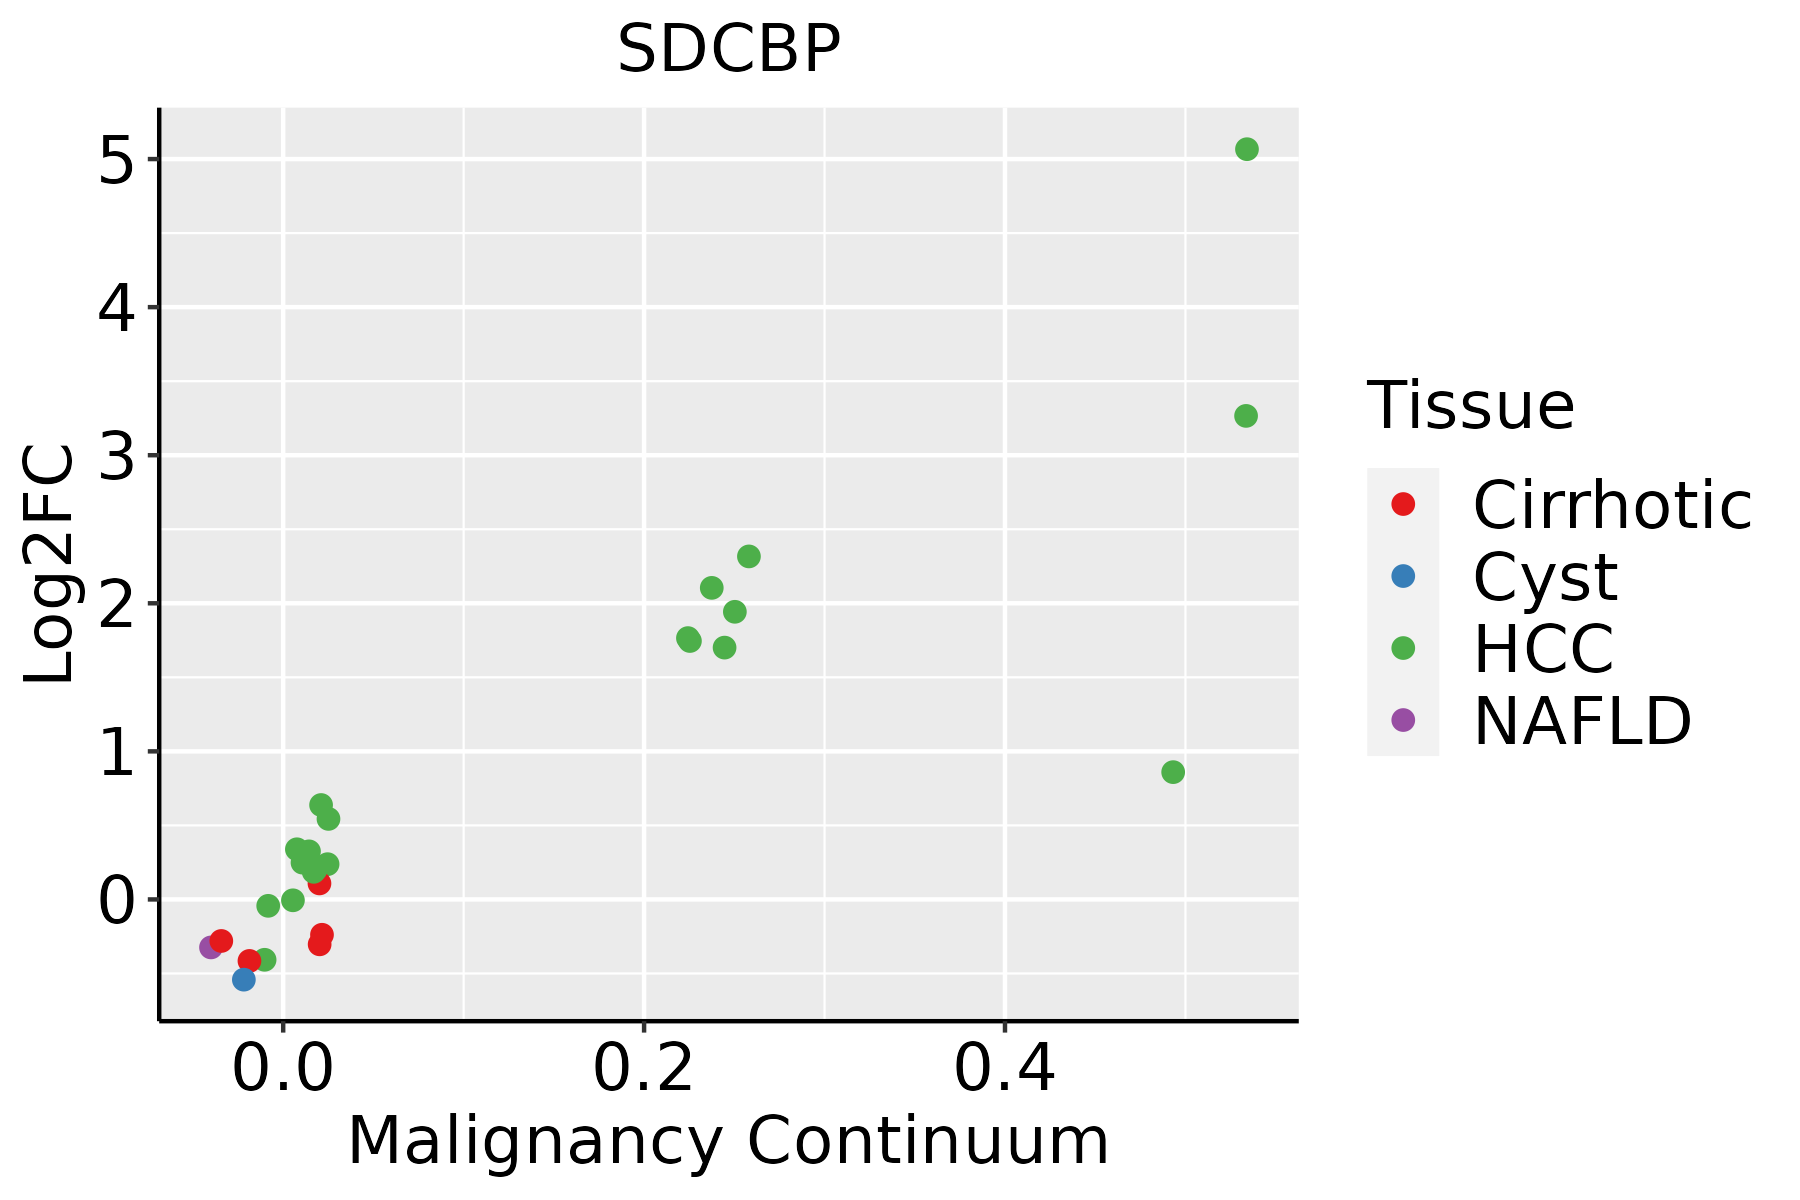
HCC: Hepatocellular carcinoma
NAFLD: Non-alcoholic fatty liver disease
Oral CavityThe image shows the transcriptomic changes along malignancy continuum.log2FC in expression of this searched gene in stem-like cells from each diseased tissue sample relative to stem-like cells in normal samples in each tissue plotted against the malignancy continuum. Samples are colored based on if they are from different disease stage.EOLP: Erosive Oral lichen planus
LP: leukoplakia
NEOLP: Non-erosive oral lichen planus
OSCC: Oral squamous cell carcinoma
ProstateThe image shows the transcriptomic changes along malignancy continuum.log2FC in expression of this searched gene in stem-like cells from each diseased tissue sample relative to stem-like cells in normal samples in each tissue plotted against the malignancy continuum. Samples are colored based on if they are from different disease stage.
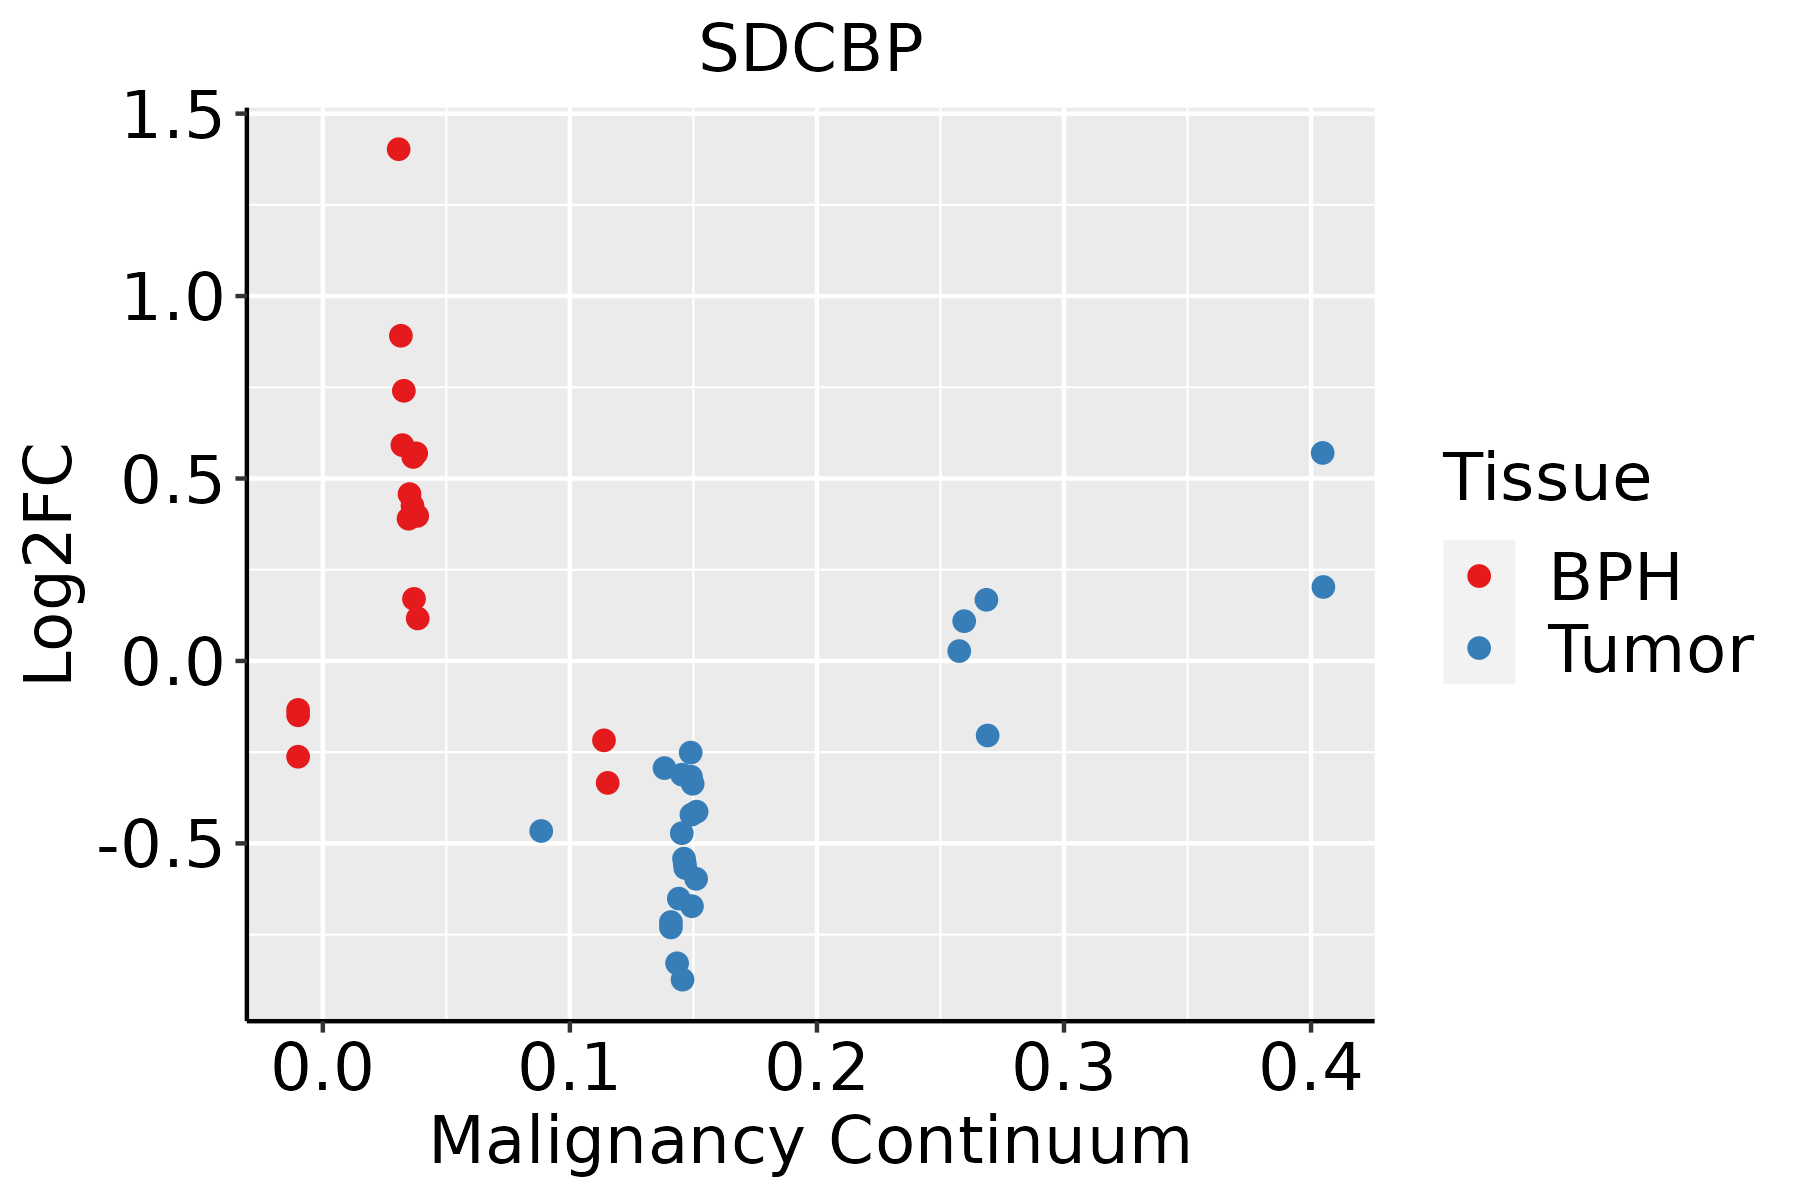
BPH: Benign Prostatic Hyperplasia
SkinThe image shows the transcriptomic changes along malignancy continuum.log2FC in expression of this searched gene in stem-like cells from each diseased tissue sample relative to stem-like cells in normal samples in each tissue plotted against the malignancy continuum. Samples are colored based on if they are from different disease stage.
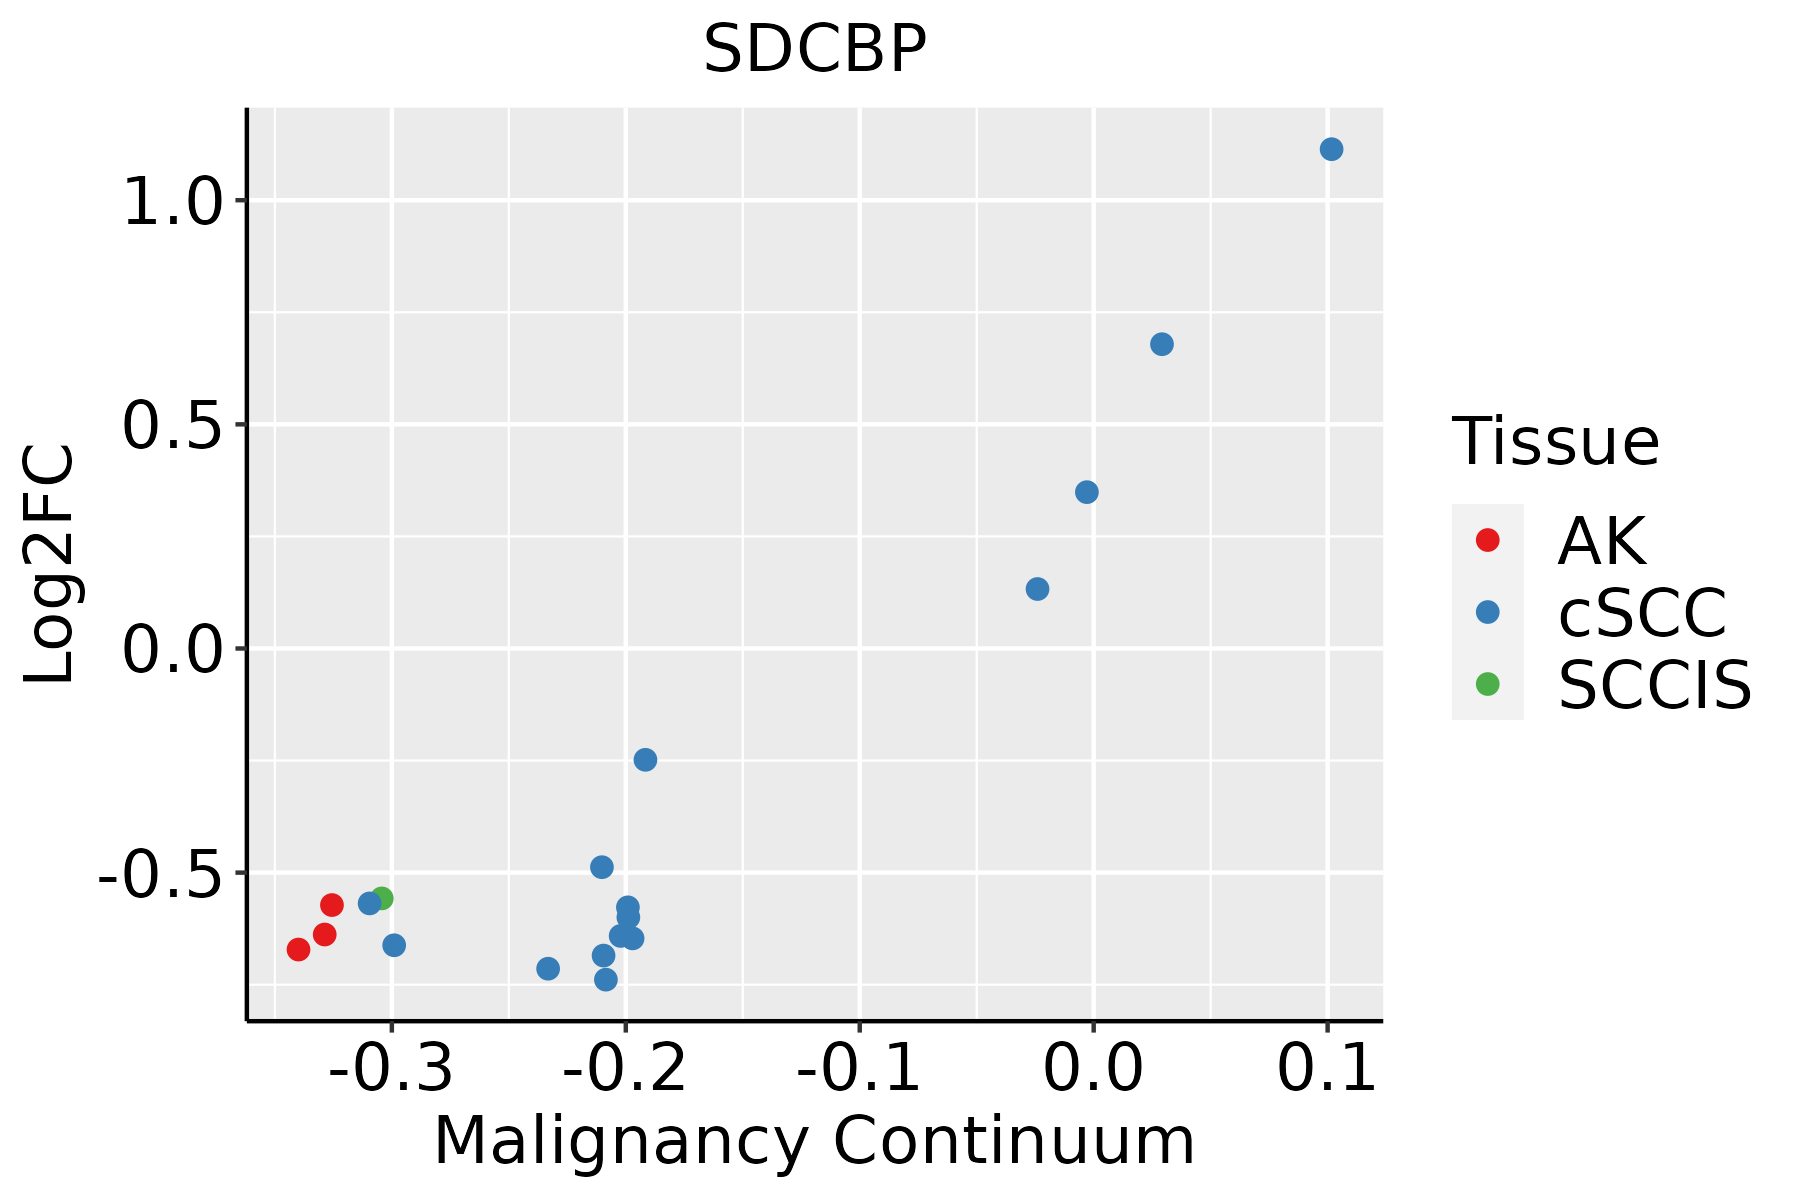
AK: Actinic keratosis
cSCC: Cutaneous squamous cell carcinoma
SCCIS:squamous cell carcinoma in situ
ThyroidThe image shows the transcriptomic changes along malignancy continuum.log2FC in expression of this searched gene in stem-like cells from each diseased tissue sample relative to stem-like cells in normal samples in each tissue plotted against the malignancy continuum. Samples are colored based on if they are from different disease stage.
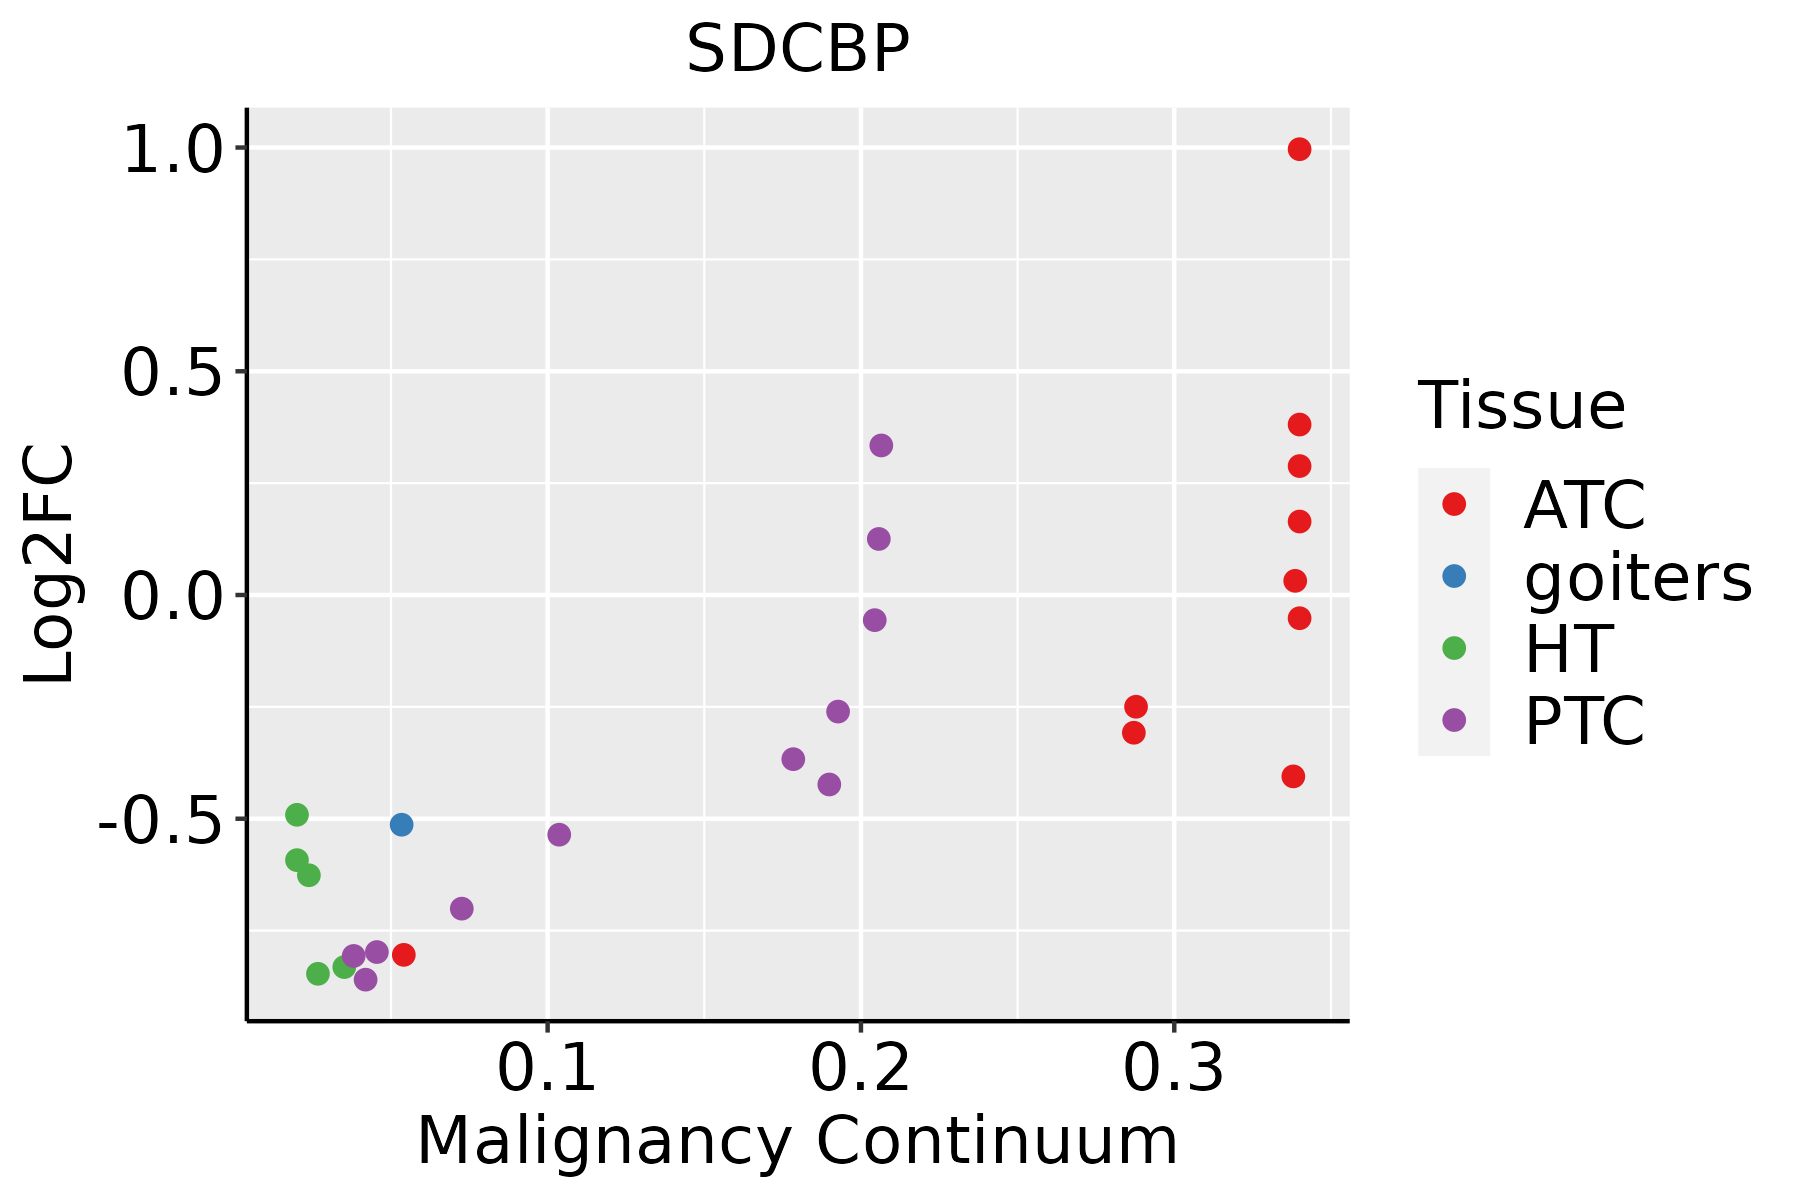
ATC: Anaplastic thyroid cancer
HT: Hashimoto's thyroiditis
PTC: Papillary thyroid cancer
∗log2FC in expression of this searched gene in stem-like cells from each diseased tissue sample relative to stem-like cells in normal samples in each tissue plotted against the malignancy continuum. Samples are colored based on if they are from different disease stage.

Top

Malignant transformation related pathway analysis

check buttonFind out the enriched GO biological processes and KEGG pathways involved in transition from healthy to precancer to cancer
check button Figure of enriched GO biological processes.
TissueDisease StageEnriched GO biological Processes
ColorectumADGO analysis - Figure of enriched GO biological processes: Top 15 enriched GO BP terms are showed in the bar plot of each disease state in each tissue. Each row represents a significant GO biological process which is colored according to the -log10(p.adjust).
ColorectumSERGO analysis - Figure of enriched GO biological processes: Top 15 enriched GO BP terms are showed in the bar plot of each disease state in each tissue. Each row represents a significant GO biological process which is colored according to the -log10(p.adjust).
ColorectumMSSGO analysis - Figure of enriched GO biological processes: Top 15 enriched GO BP terms are showed in the bar plot of each disease state in each tissue. Each row represents a significant GO biological process which is colored according to the -log10(p.adjust).
ColorectumMSI-HGO analysis - Figure of enriched GO biological processes: Top 15 enriched GO BP terms are showed in the bar plot of each disease state in each tissue. Each row represents a significant GO biological process which is colored according to the -log10(p.adjust).
ColorectumFAPGO analysis - Figure of enriched GO biological processes: Top 15 enriched GO BP terms are showed in the bar plot of each disease state in each tissue. Each row represents a significant GO biological process which is colored according to the -log10(p.adjust).
∗Top 15 enriched GO BP terms are showed in the bar plot of each disease state in each tissue. Each row represents a significant GO biological process which is colored according to the -log10(p.adjust).
Page: 1 2 3 4 5 6 7 8 9 

check button Enriched GO biological processes.
GO IDTissueDisease StageDescriptionGene RatioBg Ratiopvaluep.adjustCount
GO:00098956StomachGCnegative regulation of catabolic process32/1159320/187235.15e-034.06e-0232
GO:004586111StomachCAG with IMnegative regulation of proteolysis45/1050351/187231.90e-071.24e-0545
GO:004217611StomachCAG with IMregulation of protein catabolic process44/1050391/187238.71e-062.99e-0444
GO:190336211StomachCAG with IMregulation of cellular protein catabolic process32/1050255/187231.69e-055.30e-0432
GO:003287211StomachCAG with IMregulation of stress-activated MAPK cascade25/1050192/187237.51e-051.78e-0325
GO:007030211StomachCAG with IMregulation of stress-activated protein kinase signaling cascade25/1050195/187239.68e-052.19e-0325
GO:200005811StomachCAG with IMregulation of ubiquitin-dependent protein catabolic process22/1050164/187231.28e-042.64e-0322
GO:003109811StomachCAG with IMstress-activated protein kinase signaling cascade29/1050247/187231.37e-042.79e-0329
GO:003243411StomachCAG with IMregulation of proteasomal ubiquitin-dependent protein catabolic process19/1050134/187231.74e-043.33e-0319
GO:005140311StomachCAG with IMstress-activated MAPK cascade28/1050239/187231.84e-043.49e-0328
GO:190305011StomachCAG with IMregulation of proteolysis involved in cellular protein catabolic process26/1050221/187232.88e-044.99e-0326
GO:003133011StomachCAG with IMnegative regulation of cellular catabolic process29/1050262/187233.76e-046.04e-0329
GO:000660511StomachCAG with IMprotein targeting33/1050314/187233.98e-046.38e-0333
GO:006113611StomachCAG with IMregulation of proteasomal protein catabolic process22/1050187/187238.18e-041.08e-0222
GO:200005911StomachCAG with IMnegative regulation of ubiquitin-dependent protein catabolic process9/105048/187231.23e-031.48e-029
GO:00104986StomachCAG with IMproteasomal protein catabolic process44/1050490/187231.43e-031.64e-0244
GO:000989511StomachCAG with IMnegative regulation of catabolic process31/1050320/187232.20e-032.24e-0231
GO:003432911StomachCAG with IMcell junction assembly38/1050420/187232.56e-032.50e-0238
GO:00421776StomachCAG with IMnegative regulation of protein catabolic process15/1050121/187233.17e-032.95e-0215
GO:00463282StomachCAG with IMregulation of JNK cascade16/1050133/187233.19e-032.96e-0216
Page: 1 2 3 4 5 6 7 8 9 10 11 12 13 14 15 16 17 18 19 20 21 22 23 24 25 26 27 28 29 30 31 32 33 34 35 36 37 38 39 40 41 42 43 44 45 46 47 48 49 50 51 52 53 54 55 56 57 58 59 60 

check button Enriched KEGG pathways.
Pathway IDTissueDisease StageDescriptionGene RatioBg Ratiopvaluep.adjustqvalueCount
Page: 1 

Top

Cell-cell communication analysis

check buttonIdentification of potential cell-cell interactions between two cell types and their ligand-receptor pairs for different disease states
LigandReceptorLRpairPathwayTissueDisease Stage
Page: 1 

Top

Single-cell gene regulatory network inference analysis

check buttonFind out the significant the regulons (TFs) and the target genes of each regulon across cell types for different disease states
TFCell TypeTissueDisease StageTarget GeneRSSRegulon Activity
∗The dot plots of a searched regulon are shown for all cell subpopulations in each disease state of each tissue based on the regulon specific score inferred using pySCENIC and by calculating the average expression.
Page: 1 

Top

Somatic mutation of malignant transformation related genes

check buttonAnnotation of somatic variants for genes involved in malignant transformation
Hugo SymbolVariant ClassVariant ClassificationdbSNP RSHGVScHGVSpHGVSp ShortSWISSPROTBIOTYPESIFTPolyPhenTumor Sample BarcodeTissueHistologySexAgeStageTherapy TypesDrugsOutcome
SDCBPSNVMissense_Mutationc.263N>Tp.Arg88Leup.R88Lprotein_codingtolerated(0.11)benign(0.246)TCGA-GM-A2DD-01Breastbreast invasive carcinomaFemale<65I/IIChemotherapyfluorouracilCR
SDCBPSNVMissense_Mutationc.574N>Cp.Asp192Hisp.D192Hprotein_codingdeleterious(0.03)possibly_damaging(0.845)TCGA-DR-A0ZM-01Cervixcervical & endocervical cancerFemale<65III/IVUnspecificCisplatinSD
SDCBPSNVMissense_Mutationrs769061064c.893N>Cp.Ile298Thrp.I298Tprotein_codingdeleterious(0)benign(0.197)TCGA-DS-A0VN-01Cervixcervical & endocervical cancerFemale<65I/IIChemotherapycisplatinSD
SDCBPSNVMissense_Mutationc.274N>Tp.Ala92Serp.A92Sprotein_codingtolerated(0.54)benign(0.042)TCGA-JW-A69B-01Cervixcervical & endocervical cancerFemale<65I/IIUnknownUnknownSD
SDCBPSNVMissense_Mutationnovelc.128N>Gp.Phe43Cysp.F43Cprotein_codingtolerated(0.15)possibly_damaging(0.831)TCGA-F5-6814-01Colorectumrectum adenocarcinomaMale<65I/IIUnknownUnknownSD
SDCBPSNVMissense_Mutationnovelc.68C>Ap.Ser23Tyrp.S23Yprotein_codingdeleterious(0)probably_damaging(0.998)TCGA-A5-A0G2-01Endometriumuterine corpus endometrioid carcinomaFemale<65III/IVUnknownUnknownSD
SDCBPSNVMissense_Mutationnovelc.125C>Ap.Ala42Aspp.A42Dprotein_codingtolerated(0.22)benign(0.287)TCGA-A5-A0G2-01Endometriumuterine corpus endometrioid carcinomaFemale<65III/IVUnknownUnknownSD
SDCBPSNVMissense_Mutationnovelc.16A>Gp.Thr6Alap.T6Aprotein_codingtolerated_low_confidence(1)unknown(0)TCGA-A5-A1OF-01Endometriumuterine corpus endometrioid carcinomaFemale<65I/IIUnknownUnknownSD
SDCBPSNVMissense_Mutationnovelc.220C>Tp.Leu74Phep.L74Fprotein_codingdeleterious(0)probably_damaging(0.994)TCGA-A5-A2K5-01Endometriumuterine corpus endometrioid carcinomaFemale>=65I/IIUnknownUnknownSD
SDCBPSNVMissense_Mutationnovelc.886N>Ap.Glu296Lysp.E296Kprotein_codingtolerated(0.09)benign(0.326)TCGA-AJ-A3EK-01Endometriumuterine corpus endometrioid carcinomaFemale<65I/IIChemotherapycarboplatinCR
Page: 1 2 3 4 

Top

Related drugs of malignant transformation related genes

check buttonIdentification of chemicals and drugs interact with genes involved in malignant transfromation
(DGIdb 4.0)
Entrez IDSymbolCategoryInteraction TypesDrug Claim NameDrug NamePMIDs
Page: 1