
|
|||||
|
 | |
| |
| |
| |
| |
| |
|
Gene: PHB2 |
Gene summary for PHB2 |
| Gene information | Species | Human | Gene symbol | PHB2 | Gene ID | 11331 |
| Gene name | prohibitin 2 | |
| Gene Alias | BAP | |
| Cytomap | 12p13.31 | |
| Gene Type | protein-coding | GO ID | GO:0000003 | UniProtAcc | Q99623 |
Top |
Malignant transformation analysis |
| Identification of the aberrant gene expression in precancerous and cancerous lesions by comparing the gene expression of stem-like cells in diseased tissues with normal stem cells |
| Entrez ID | Symbol | Replicates | Species | Organ | Tissue | Adj P-value | Log2FC | Malignancy |
| 11331 | PHB2 | HTA11_3410_2000001011 | Human | Colorectum | AD | 1.13e-08 | 3.65e-01 | 0.0155 |
| 11331 | PHB2 | HTA11_2487_2000001011 | Human | Colorectum | SER | 1.54e-11 | 6.33e-01 | -0.1808 |
| 11331 | PHB2 | HTA11_2951_2000001011 | Human | Colorectum | AD | 4.61e-03 | 6.33e-01 | 0.0216 |
| 11331 | PHB2 | HTA11_1938_2000001011 | Human | Colorectum | AD | 6.28e-11 | 5.66e-01 | -0.0811 |
| 11331 | PHB2 | HTA11_78_2000001011 | Human | Colorectum | AD | 1.15e-18 | 7.79e-01 | -0.1088 |
| 11331 | PHB2 | HTA11_347_2000001011 | Human | Colorectum | AD | 1.10e-43 | 1.03e+00 | -0.1954 |
| 11331 | PHB2 | HTA11_411_2000001011 | Human | Colorectum | SER | 2.09e-02 | 6.63e-01 | -0.2602 |
| 11331 | PHB2 | HTA11_3361_2000001011 | Human | Colorectum | AD | 8.53e-13 | 7.69e-01 | -0.1207 |
| 11331 | PHB2 | HTA11_83_2000001011 | Human | Colorectum | SER | 2.79e-07 | 5.12e-01 | -0.1526 |
| 11331 | PHB2 | HTA11_696_2000001011 | Human | Colorectum | AD | 6.95e-28 | 6.35e-01 | -0.1464 |
| 11331 | PHB2 | HTA11_866_2000001011 | Human | Colorectum | AD | 2.30e-20 | 6.06e-01 | -0.1001 |
| 11331 | PHB2 | HTA11_1391_2000001011 | Human | Colorectum | AD | 7.68e-24 | 7.81e-01 | -0.059 |
| 11331 | PHB2 | HTA11_2992_2000001011 | Human | Colorectum | SER | 8.93e-05 | 6.13e-01 | -0.1706 |
| 11331 | PHB2 | HTA11_5212_2000001011 | Human | Colorectum | AD | 3.56e-06 | 4.49e-01 | -0.2061 |
| 11331 | PHB2 | HTA11_5216_2000001011 | Human | Colorectum | SER | 2.64e-02 | 6.12e-01 | -0.1462 |
| 11331 | PHB2 | HTA11_546_2000001011 | Human | Colorectum | AD | 1.19e-10 | 7.77e-01 | -0.0842 |
| 11331 | PHB2 | HTA11_9341_2000001011 | Human | Colorectum | SER | 4.88e-03 | 5.17e-01 | -0.00410000000000005 |
| 11331 | PHB2 | HTA11_866_3004761011 | Human | Colorectum | AD | 1.11e-24 | 6.81e-01 | 0.096 |
| 11331 | PHB2 | HTA11_4255_2000001011 | Human | Colorectum | SER | 5.98e-11 | 8.28e-01 | 0.0446 |
| 11331 | PHB2 | HTA11_8622_2000001021 | Human | Colorectum | SER | 6.56e-07 | 6.04e-01 | 0.0528 |
| Page: 1 2 3 4 5 6 7 8 9 10 11 |
| Tissue | Expression Dynamics | Abbreviation |
| Colorectum (GSE201348) |  | FAP: Familial adenomatous polyposis |
| CRC: Colorectal cancer | ||
| Colorectum (HTA11) | 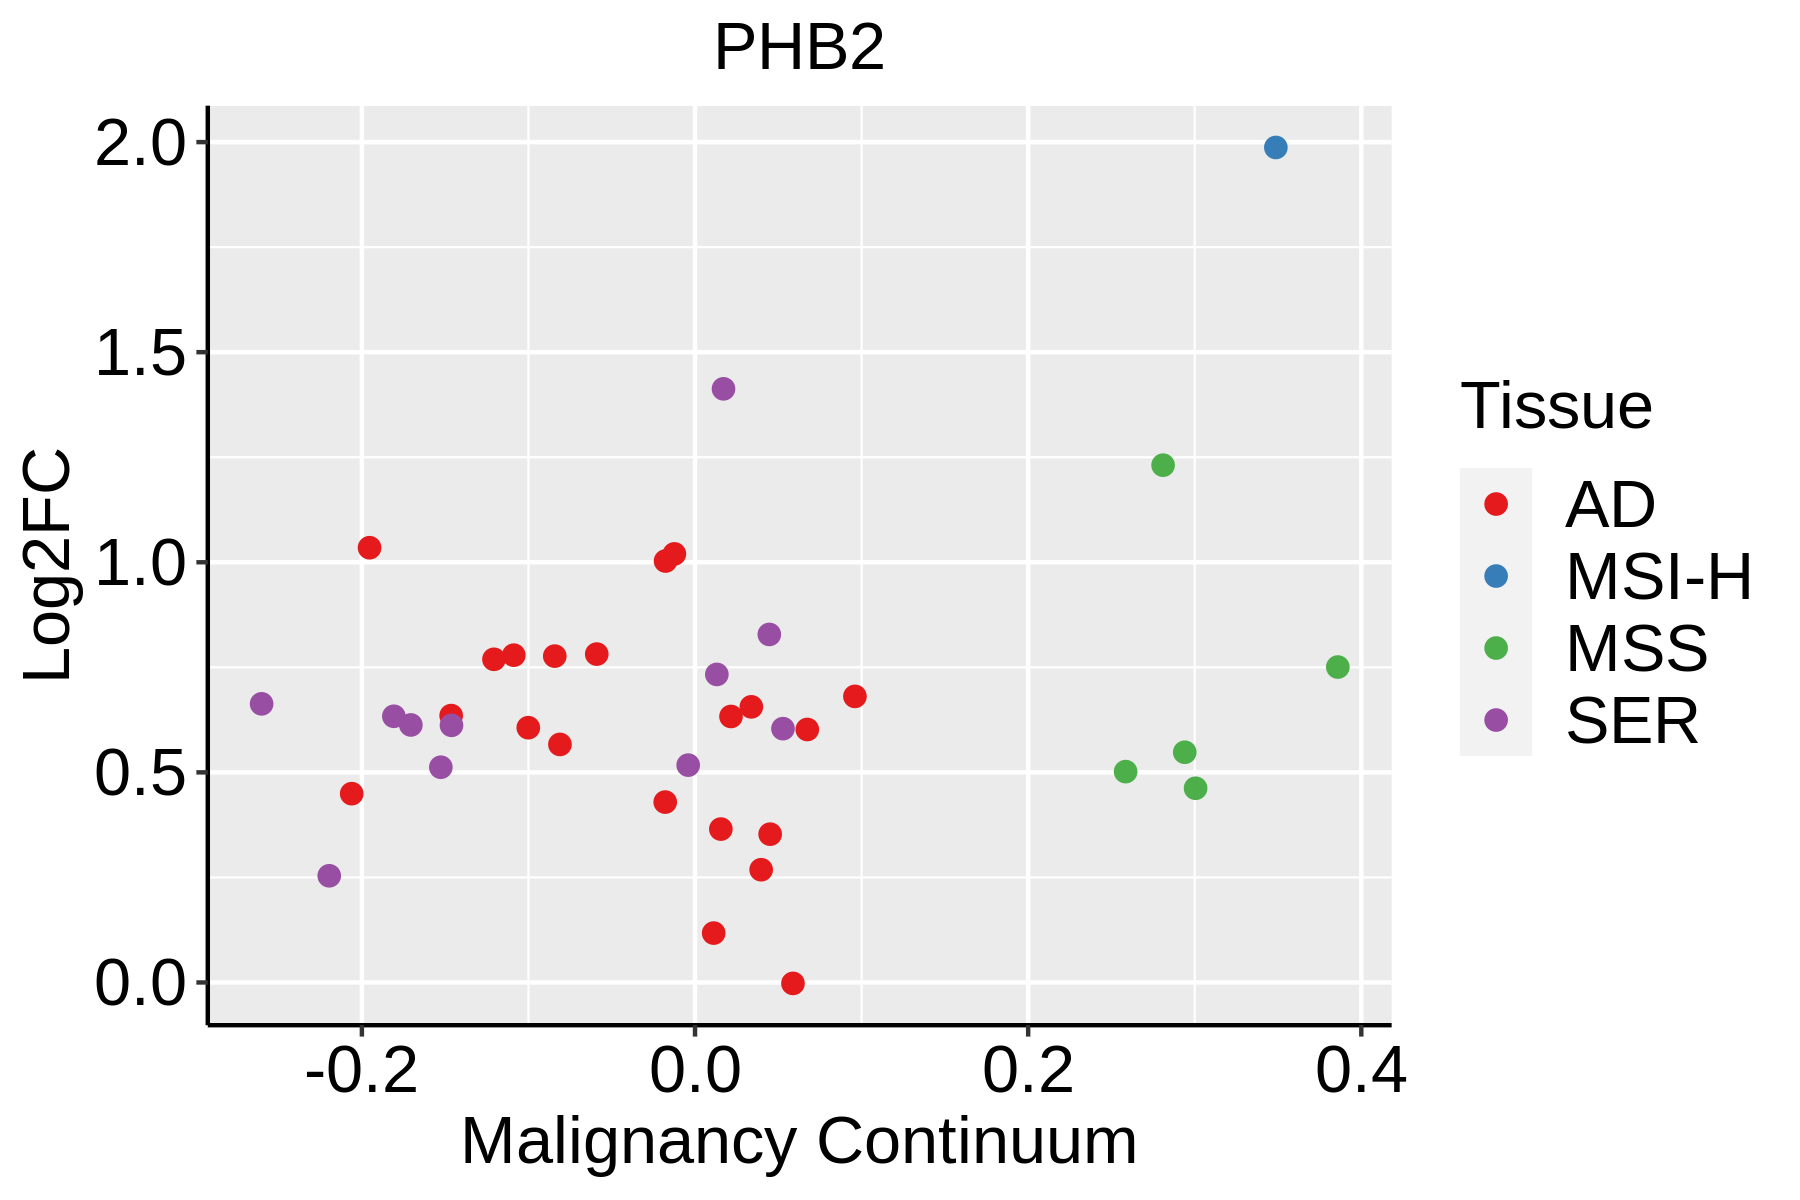 | AD: Adenomas |
| SER: Sessile serrated lesions | ||
| MSI-H: Microsatellite-high colorectal cancer | ||
| MSS: Microsatellite stable colorectal cancer | ||
| Endometrium |  | AEH: Atypical endometrial hyperplasia |
| EEC: Endometrioid Cancer | ||
| Esophagus | 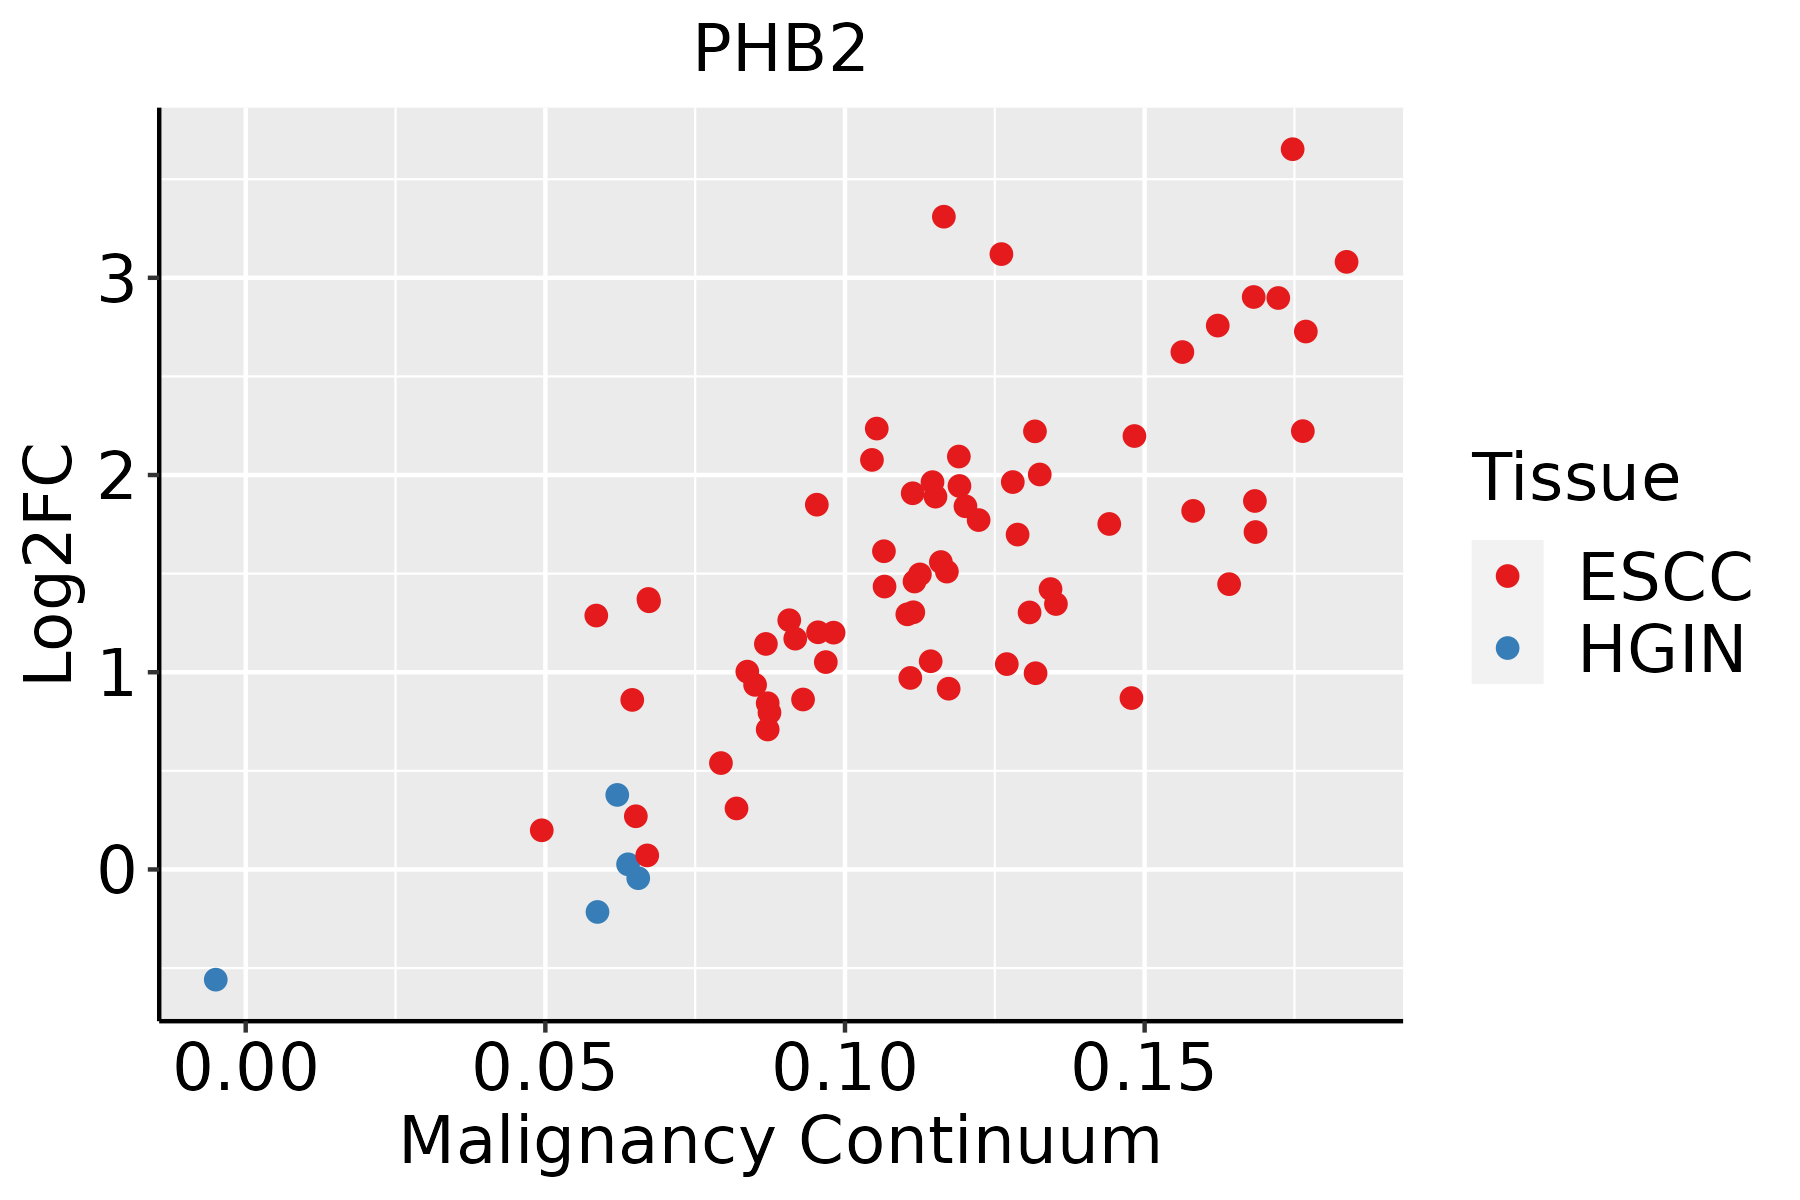 | ESCC: Esophageal squamous cell carcinoma |
| HGIN: High-grade intraepithelial neoplasias | ||
| LGIN: Low-grade intraepithelial neoplasias | ||
| Liver |  | HCC: Hepatocellular carcinoma |
| NAFLD: Non-alcoholic fatty liver disease | ||
| Oral Cavity | 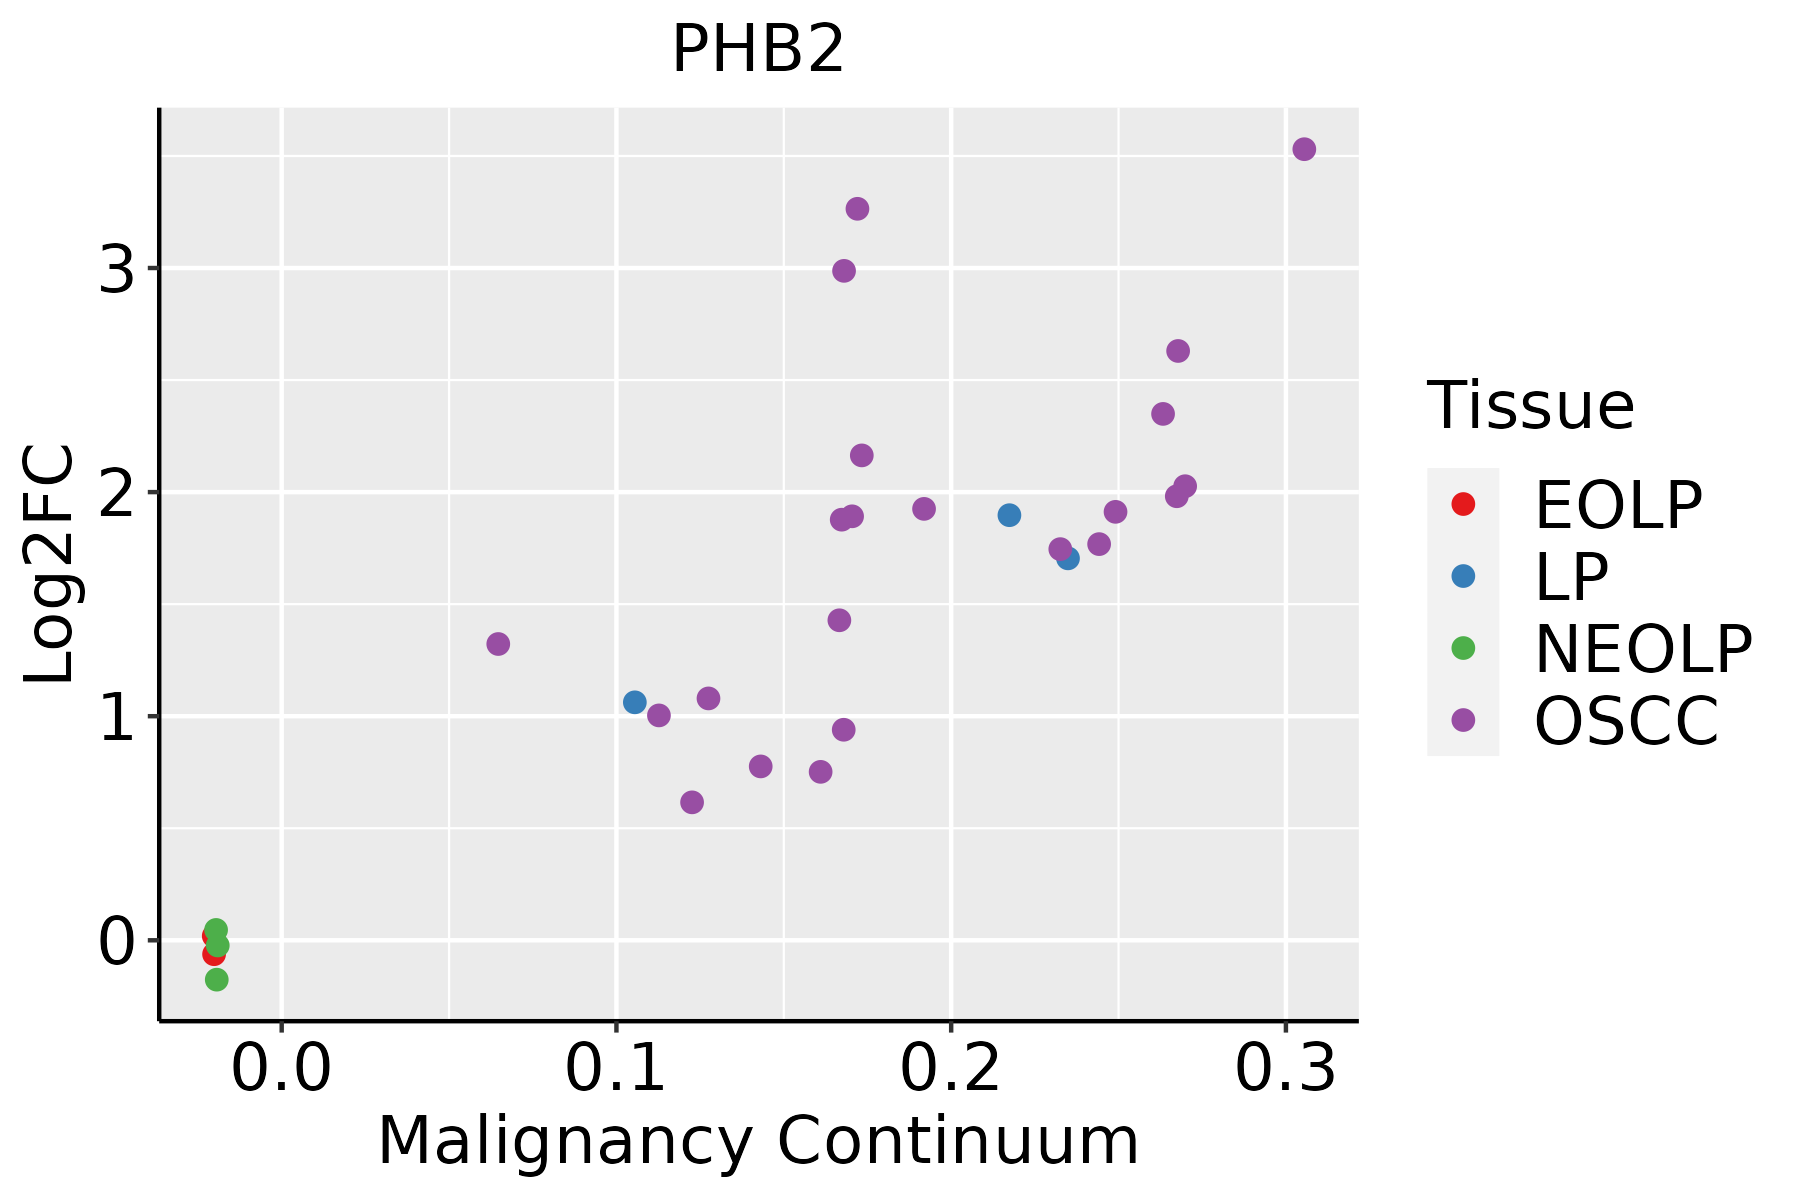 | EOLP: Erosive Oral lichen planus |
| LP: leukoplakia | ||
| NEOLP: Non-erosive oral lichen planus | ||
| OSCC: Oral squamous cell carcinoma | ||
| Prostate | 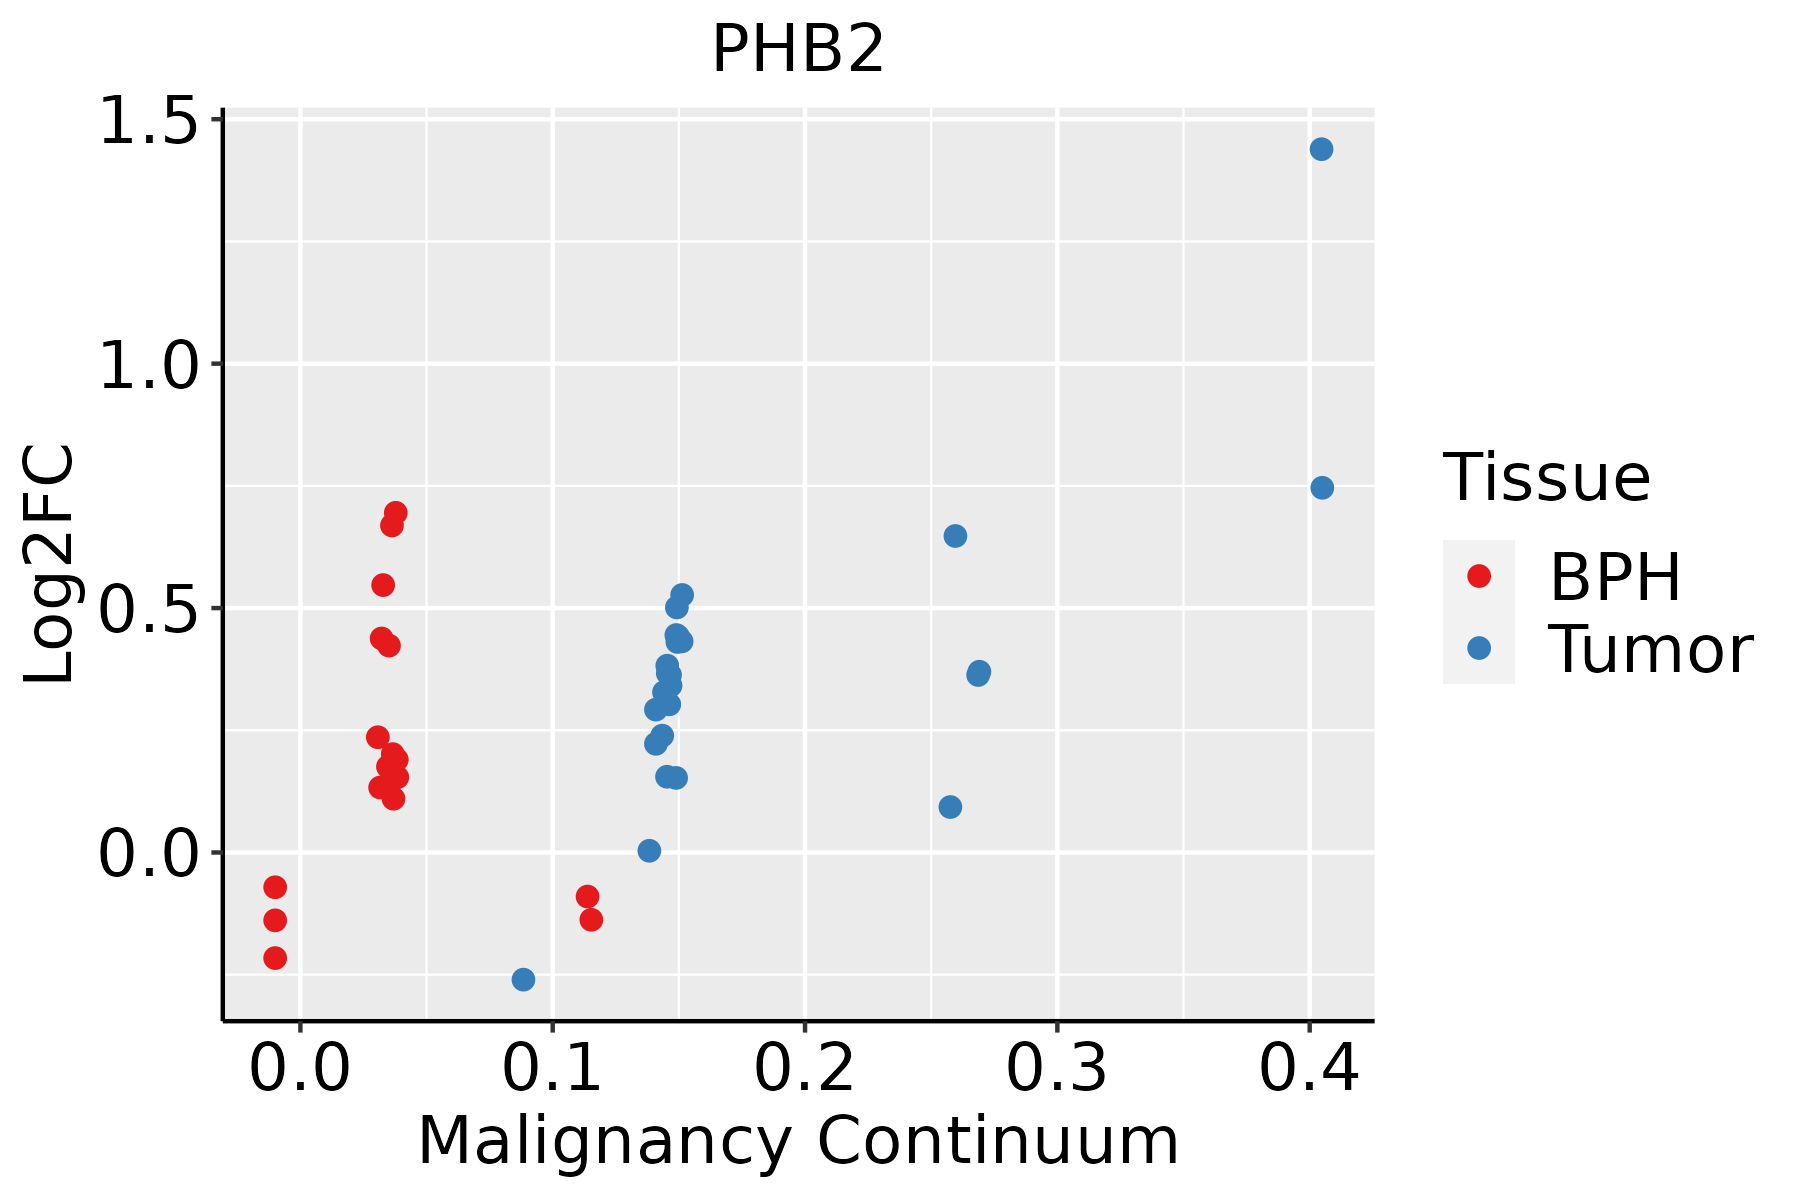 | BPH: Benign Prostatic Hyperplasia |
| Skin | 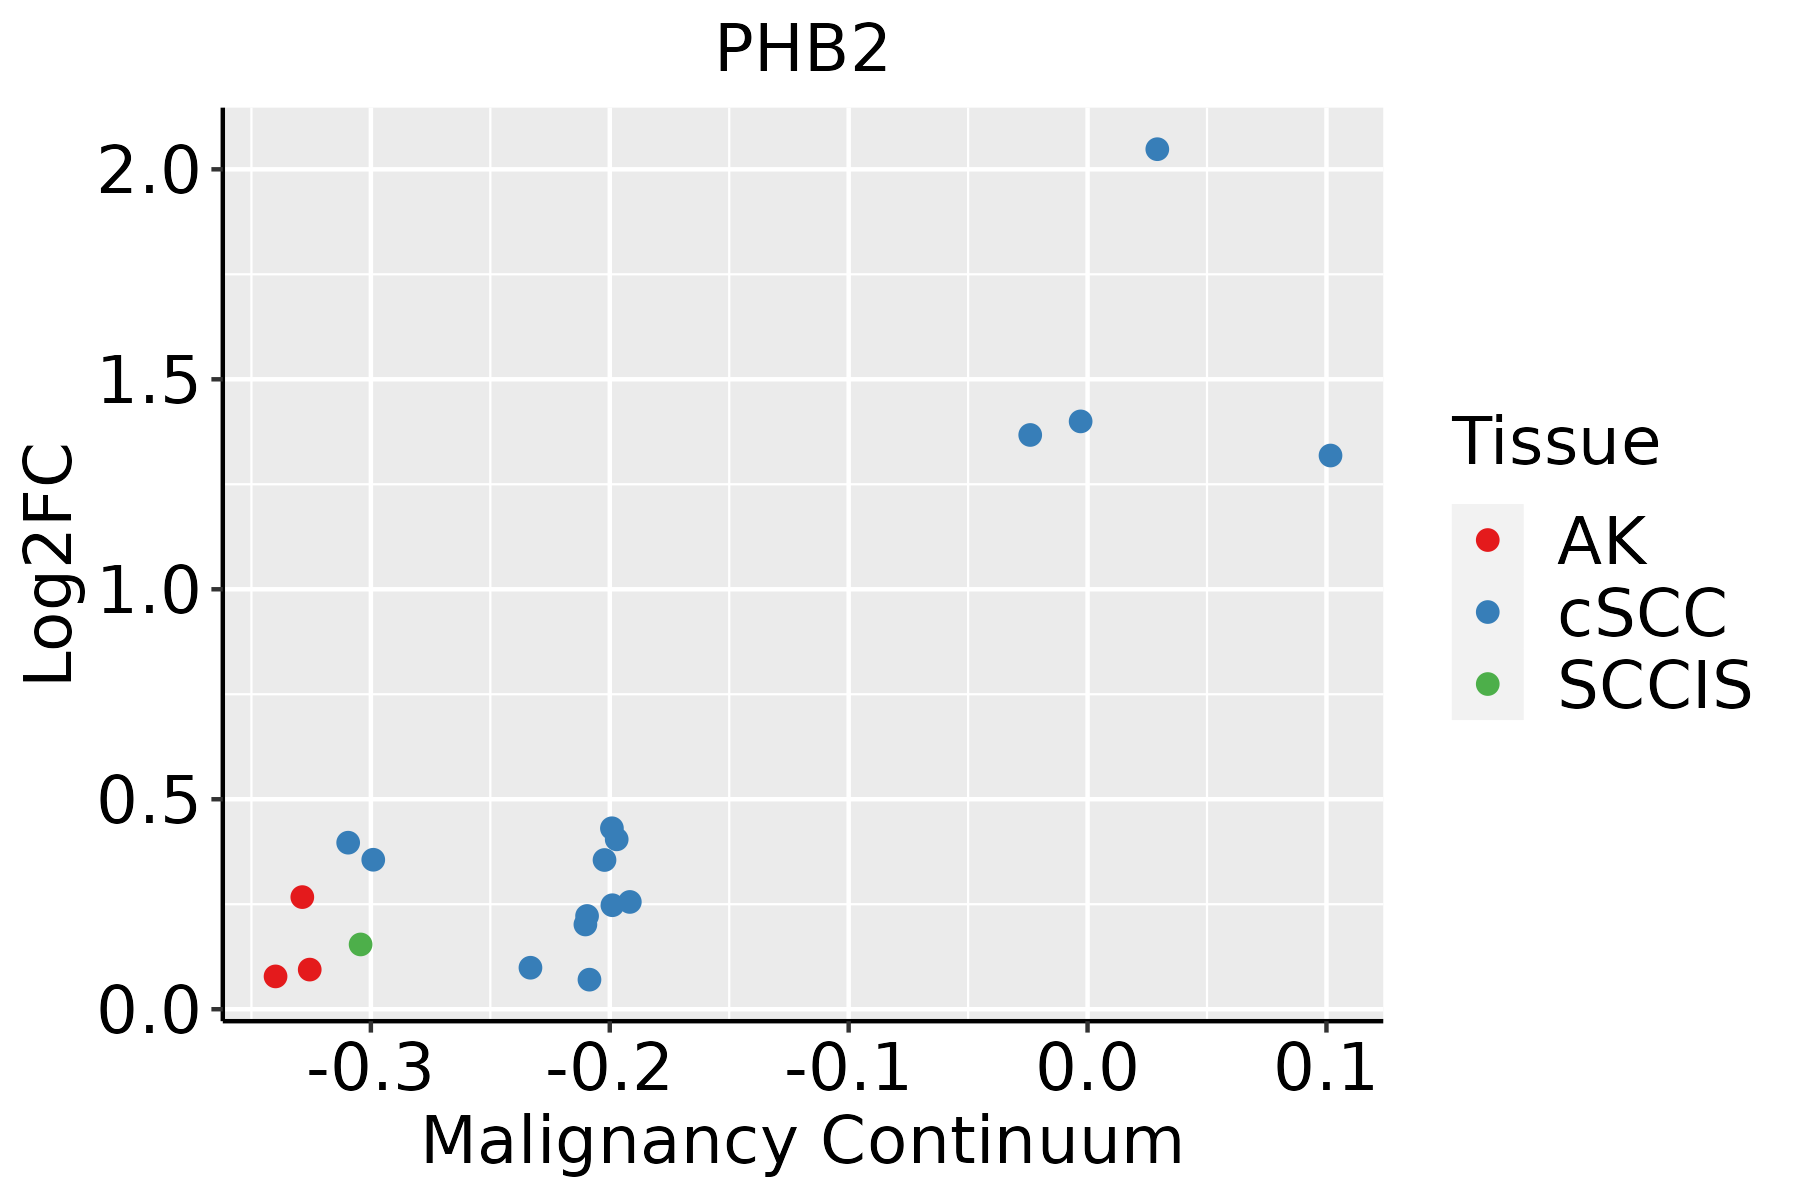 | AK: Actinic keratosis |
| cSCC: Cutaneous squamous cell carcinoma | ||
| SCCIS:squamous cell carcinoma in situ | ||
| Thyroid | 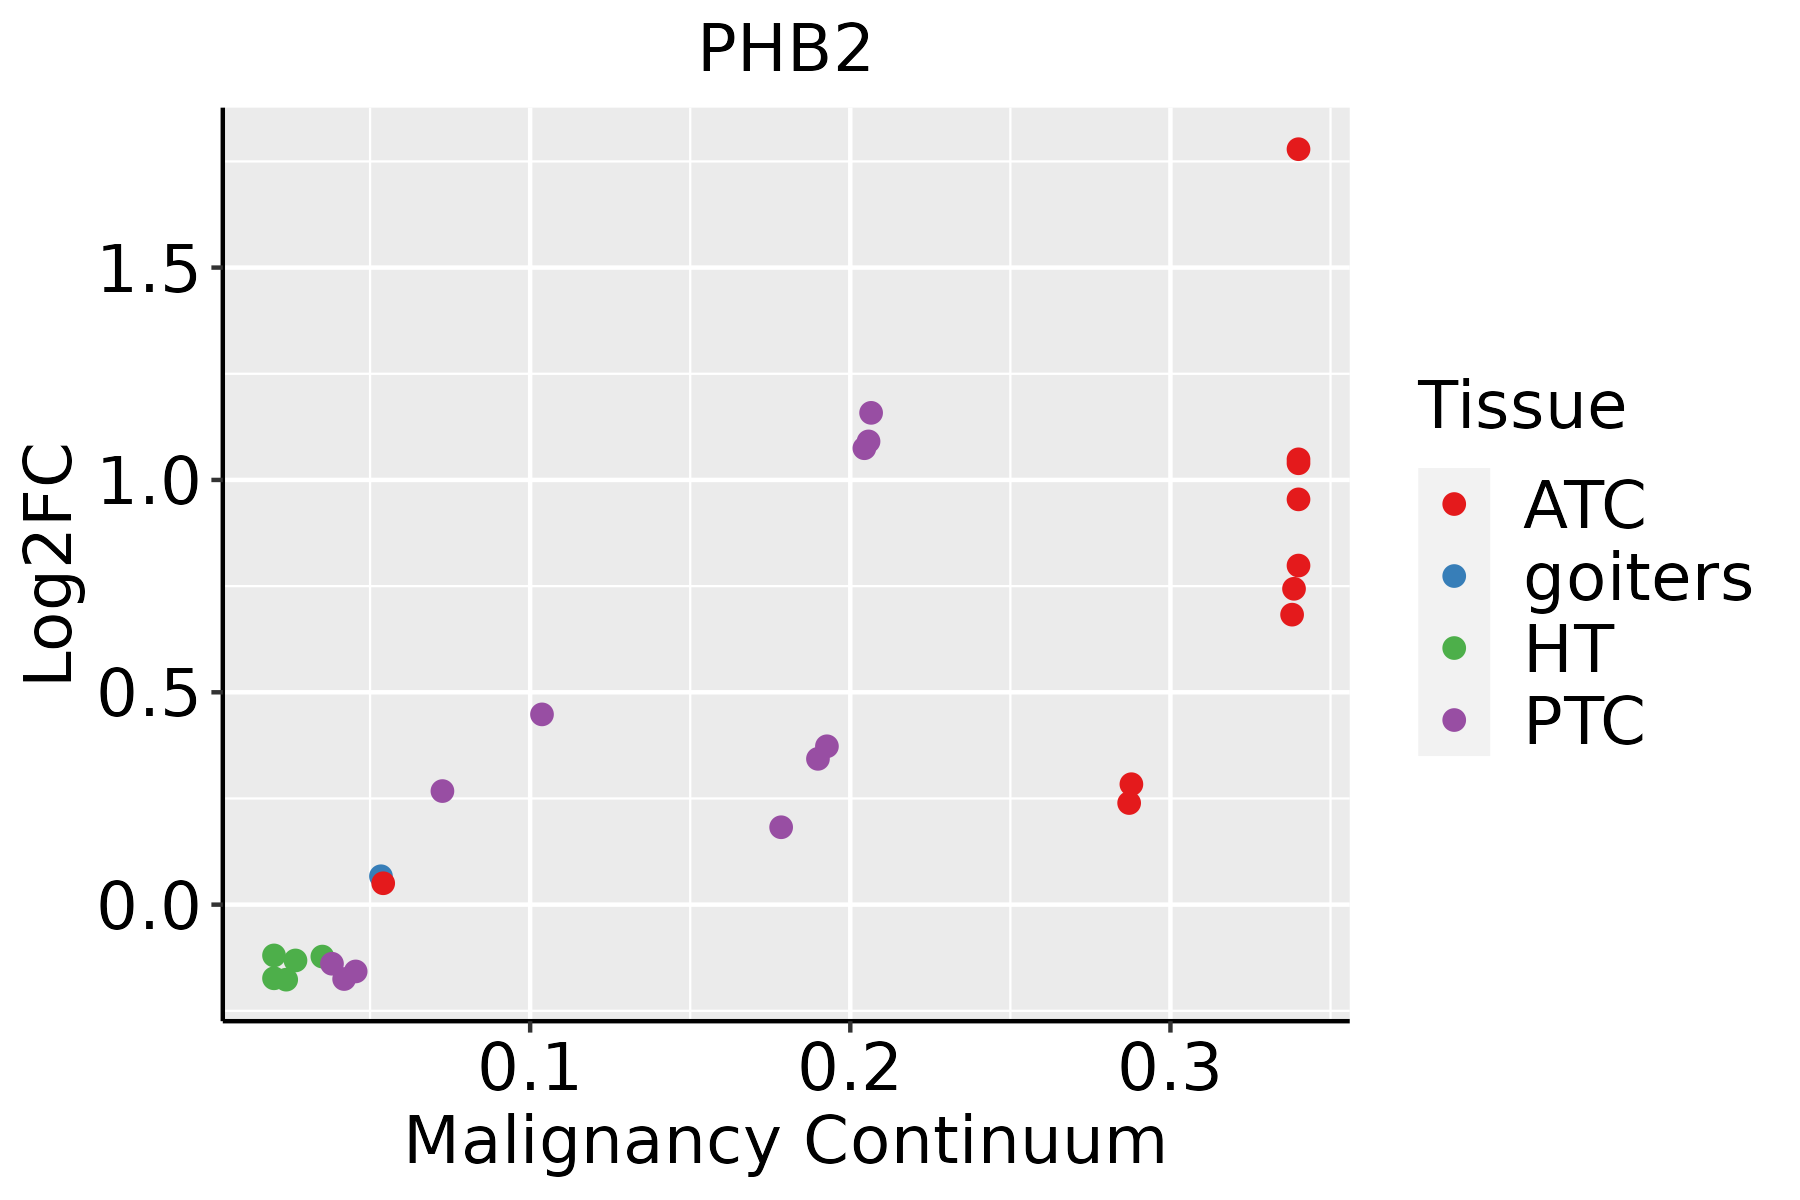 | ATC: Anaplastic thyroid cancer |
| HT: Hashimoto's thyroiditis | ||
| PTC: Papillary thyroid cancer |
| ∗log2FC in expression of this searched gene in stem-like cells from each diseased tissue sample relative to stem-like cells in normal samples in each tissue plotted against the malignancy continuum. Samples are colored based on if they are from different disease stage. |
Top |
Malignant transformation related pathway analysis |
| Find out the enriched GO biological processes and KEGG pathways involved in transition from healthy to precancer to cancer |
| Tissue | Disease Stage | Enriched GO biological Processes |
| Colorectum | AD |  |
| Colorectum | SER |  |
| Colorectum | MSS |  |
| Colorectum | MSI-H |  |
| Colorectum | FAP |  |
| ∗Top 15 enriched GO BP terms are showed in the bar plot of each disease state in each tissue. Each row represents a significant GO biological process which is colored according to the -log10(p.adjust). |
| Page: 1 2 3 4 5 6 7 8 9 |
| GO ID | Tissue | Disease Stage | Description | Gene Ratio | Bg Ratio | pvalue | p.adjust | Count |
| GO:000042211 | Liver | HCC | autophagy of mitochondrion | 64/7958 | 81/18723 | 1.96e-11 | 7.72e-10 | 64 |
| GO:006172611 | Liver | HCC | mitochondrion disassembly | 64/7958 | 81/18723 | 1.96e-11 | 7.72e-10 | 64 |
| GO:004232622 | Liver | HCC | negative regulation of phosphorylation | 227/7958 | 385/18723 | 3.98e-11 | 1.52e-09 | 227 |
| GO:199077821 | Liver | HCC | protein localization to cell periphery | 200/7958 | 333/18723 | 6.07e-11 | 2.23e-09 | 200 |
| GO:005134822 | Liver | HCC | negative regulation of transferase activity | 166/7958 | 268/18723 | 8.97e-11 | 3.18e-09 | 166 |
| GO:014001411 | Liver | HCC | mitotic nuclear division | 174/7958 | 287/18723 | 3.74e-10 | 1.23e-08 | 174 |
| GO:00008191 | Liver | HCC | sister chromatid segregation | 128/7958 | 202/18723 | 1.59e-09 | 4.73e-08 | 128 |
| GO:004346722 | Liver | HCC | regulation of generation of precursor metabolites and energy | 89/7958 | 130/18723 | 1.84e-09 | 5.35e-08 | 89 |
| GO:00447722 | Liver | HCC | mitotic cell cycle phase transition | 240/7958 | 424/18723 | 2.47e-09 | 6.84e-08 | 240 |
| GO:005170122 | Liver | HCC | biological process involved in interaction with host | 128/7958 | 203/18723 | 2.51e-09 | 6.91e-08 | 128 |
| GO:190547511 | Liver | HCC | regulation of protein localization to membrane | 113/7958 | 175/18723 | 2.90e-09 | 7.78e-08 | 113 |
| GO:007138322 | Liver | HCC | cellular response to steroid hormone stimulus | 128/7958 | 204/18723 | 3.92e-09 | 1.04e-07 | 128 |
| GO:000734611 | Liver | HCC | regulation of mitotic cell cycle | 255/7958 | 457/18723 | 4.96e-09 | 1.30e-07 | 255 |
| GO:000961511 | Liver | HCC | response to virus | 210/7958 | 367/18723 | 7.32e-09 | 1.86e-07 | 210 |
| GO:003367322 | Liver | HCC | negative regulation of kinase activity | 144/7958 | 237/18723 | 9.76e-09 | 2.45e-07 | 144 |
| GO:000193322 | Liver | HCC | negative regulation of protein phosphorylation | 196/7958 | 342/18723 | 1.95e-08 | 4.63e-07 | 196 |
| GO:004873222 | Liver | HCC | gland development | 242/7958 | 436/18723 | 2.26e-08 | 5.28e-07 | 242 |
| GO:005117011 | Liver | HCC | import into nucleus | 102/7958 | 159/18723 | 2.78e-08 | 6.39e-07 | 102 |
| GO:0007059 | Liver | HCC | chromosome segregation | 197/7958 | 346/18723 | 3.57e-08 | 7.87e-07 | 197 |
| GO:0039528 | Liver | HCC | cytoplasmic pattern recognition receptor signaling pathway in response to virus | 30/7958 | 34/18723 | 3.88e-08 | 8.39e-07 | 30 |
| Page: 1 2 3 4 5 6 7 8 9 10 11 12 13 14 15 16 17 18 19 20 21 22 23 24 25 26 27 28 29 30 31 32 33 34 35 36 37 38 39 40 41 42 43 44 45 46 47 48 49 50 51 52 53 54 55 56 57 58 59 60 61 62 63 64 65 66 67 68 69 70 71 72 73 74 75 76 77 78 79 80 81 82 83 84 85 86 87 88 89 90 |
| Pathway ID | Tissue | Disease Stage | Description | Gene Ratio | Bg Ratio | pvalue | p.adjust | qvalue | Count |
| Page: 1 |
Top |
Cell-cell communication analysis |
| Identification of potential cell-cell interactions between two cell types and their ligand-receptor pairs for different disease states |
| Ligand | Receptor | LRpair | Pathway | Tissue | Disease Stage |
| EFNA5 | EPHB2 | EFNA5_EPHB2 | EPHA | Cervix | CC |
| EFNB1 | EPHB2 | EFNB1_EPHB2 | EPHB | Cervix | CC |
| EFNB2 | EPHB2 | EFNB2_EPHB2 | EPHB | Cervix | CC |
| EFNB1 | EPHB2 | EFNB1_EPHB2 | EPHB | CRC | AD |
| EFNB2 | EPHB2 | EFNB2_EPHB2 | EPHB | CRC | AD |
| EFNA5 | EPHB2 | EFNA5_EPHB2 | EPHA | CRC | AD |
| EFNA5 | EPHB2 | EFNA5_EPHB2 | EPHA | CRC | ADJ |
| EFNB1 | EPHB2 | EFNB1_EPHB2 | EPHB | CRC | ADJ |
| EFNB2 | EPHB2 | EFNB2_EPHB2 | EPHB | CRC | ADJ |
| EFNA5 | EPHB2 | EFNA5_EPHB2 | EPHA | CRC | CRC |
| EFNB2 | EPHB2 | EFNB2_EPHB2 | EPHB | CRC | CRC |
| EFNA5 | EPHB2 | EFNA5_EPHB2 | EPHA | CRC | FAP |
| EFNB2 | EPHB2 | EFNB2_EPHB2 | EPHB | CRC | FAP |
| EFNA5 | EPHB2 | EFNA5_EPHB2 | EPHA | CRC | Healthy |
| EFNB2 | EPHB2 | EFNB2_EPHB2 | EPHB | CRC | Healthy |
| EFNA5 | EPHB2 | EFNA5_EPHB2 | EPHA | CRC | MSI-H |
| EFNB1 | EPHB2 | EFNB1_EPHB2 | EPHB | CRC | MSI-H |
| EFNB2 | EPHB2 | EFNB2_EPHB2 | EPHB | CRC | MSI-H |
| EFNB1 | EPHB2 | EFNB1_EPHB2 | EPHB | CRC | MSS |
| EFNB2 | EPHB2 | EFNB2_EPHB2 | EPHB | CRC | MSS |
| Page: 1 |
Top |
Single-cell gene regulatory network inference analysis |
| Find out the significant the regulons (TFs) and the target genes of each regulon across cell types for different disease states |
| TF | Cell Type | Tissue | Disease Stage | Target Gene | RSS | Regulon Activity |
| ∗The dot plots of a searched regulon are shown for all cell subpopulations in each disease state of each tissue based on the regulon specific score inferred using pySCENIC and by calculating the average expression. |
| Page: 1 |
Top |
Somatic mutation of malignant transformation related genes |
| Annotation of somatic variants for genes involved in malignant transformation |
| Hugo Symbol | Variant Class | Variant Classification | dbSNP RS | HGVSc | HGVSp | HGVSp Short | SWISSPROT | BIOTYPE | SIFT | PolyPhen | Tumor Sample Barcode | Tissue | Histology | Sex | Age | Stage | Therapy Types | Drugs | Outcome |
| PHB2 | SNV | Missense_Mutation | c.896A>C | p.Lys299Thr | p.K299T | Q99623 | protein_coding | deleterious_low_confidence(0) | benign(0.143) | TCGA-EW-A1PE-01 | Breast | breast invasive carcinoma | Female | <65 | I/II | Chemotherapy | fluorouracil | SD | |
| PHB2 | insertion | Frame_Shift_Ins | novel | c.377_378insATTGGGAATTA | p.Asp127LeufsTer31 | p.D127Lfs*31 | Q99623 | protein_coding | TCGA-A8-A08T-01 | Breast | breast invasive carcinoma | Female | <65 | III/IV | Unknown | Unknown | PD | ||
| PHB2 | SNV | Missense_Mutation | c.415N>C | p.Glu139Gln | p.E139Q | Q99623 | protein_coding | deleterious(0) | probably_damaging(1) | TCGA-IR-A3LA-01 | Cervix | cervical & endocervical cancer | Female | <65 | I/II | Chemotherapy | cisplatin | CR | |
| PHB2 | insertion | Frame_Shift_Ins | novel | c.44_45insCCCAT | p.Arg17CysfsTer9 | p.R17Cfs*9 | Q99623 | protein_coding | TCGA-A6-6653-01 | Colorectum | colon adenocarcinoma | Male | >=65 | I/II | Unknown | Unknown | SD | ||
| PHB2 | insertion | Frame_Shift_Ins | novel | c.43_44insT | p.Gly15ValfsTer68 | p.G15Vfs*68 | Q99623 | protein_coding | TCGA-A6-6653-01 | Colorectum | colon adenocarcinoma | Male | >=65 | I/II | Unknown | Unknown | SD | ||
| PHB2 | SNV | Missense_Mutation | rs782150944 | c.368G>A | p.Arg123His | p.R123H | Q99623 | protein_coding | tolerated(0.14) | benign(0.013) | TCGA-A5-A0G2-01 | Endometrium | uterine corpus endometrioid carcinoma | Female | <65 | III/IV | Unknown | Unknown | SD |
| PHB2 | SNV | Missense_Mutation | c.283N>T | p.Gly95Cys | p.G95C | Q99623 | protein_coding | deleterious(0) | probably_damaging(0.995) | TCGA-AP-A051-01 | Endometrium | uterine corpus endometrioid carcinoma | Female | >=65 | I/II | Unknown | Unknown | SD | |
| PHB2 | SNV | Missense_Mutation | novel | c.754C>T | p.Arg252Cys | p.R252C | Q99623 | protein_coding | deleterious(0) | probably_damaging(1) | TCGA-AX-A2HC-01 | Endometrium | uterine corpus endometrioid carcinoma | Female | <65 | III/IV | Chemotherapy | paclitaxel | PD |
| PHB2 | SNV | Missense_Mutation | novel | c.895A>C | p.Lys299Gln | p.K299Q | Q99623 | protein_coding | deleterious_low_confidence(0.01) | benign(0.146) | TCGA-AX-A2IO-01 | Endometrium | uterine corpus endometrioid carcinoma | Female | >=65 | I/II | Chemotherapy | carboplatin | SD |
| PHB2 | SNV | Missense_Mutation | c.196N>C | p.Glu66Gln | p.E66Q | Q99623 | protein_coding | deleterious(0.02) | probably_damaging(0.992) | TCGA-B5-A11R-01 | Endometrium | uterine corpus endometrioid carcinoma | Female | <65 | I/II | Chemotherapy | paclitaxel | SD |
| Page: 1 2 |
Top |
Related drugs of malignant transformation related genes |
| Identification of chemicals and drugs interact with genes involved in malignant transfromation |
| (DGIdb 4.0) |
| Entrez ID | Symbol | Category | Interaction Types | Drug Claim Name | Drug Name | PMIDs |
| 11331 | PHB2 | CELL SURFACE | STEROID HORMONE | 10850416 |
| Page: 1 |

Copyright 2023-Present -The University of Texas Health Science Center at Houston |