| Tissue | Expression Dynamics | Abbreviation |
| Breast |  | IDC: Invasive ductal carcinoma |
| DCIS: Ductal carcinoma in situ |
| Precancer(BRCA1-mut): Precancerous lesion from BRCA1 mutation carriers |
| Cervix | 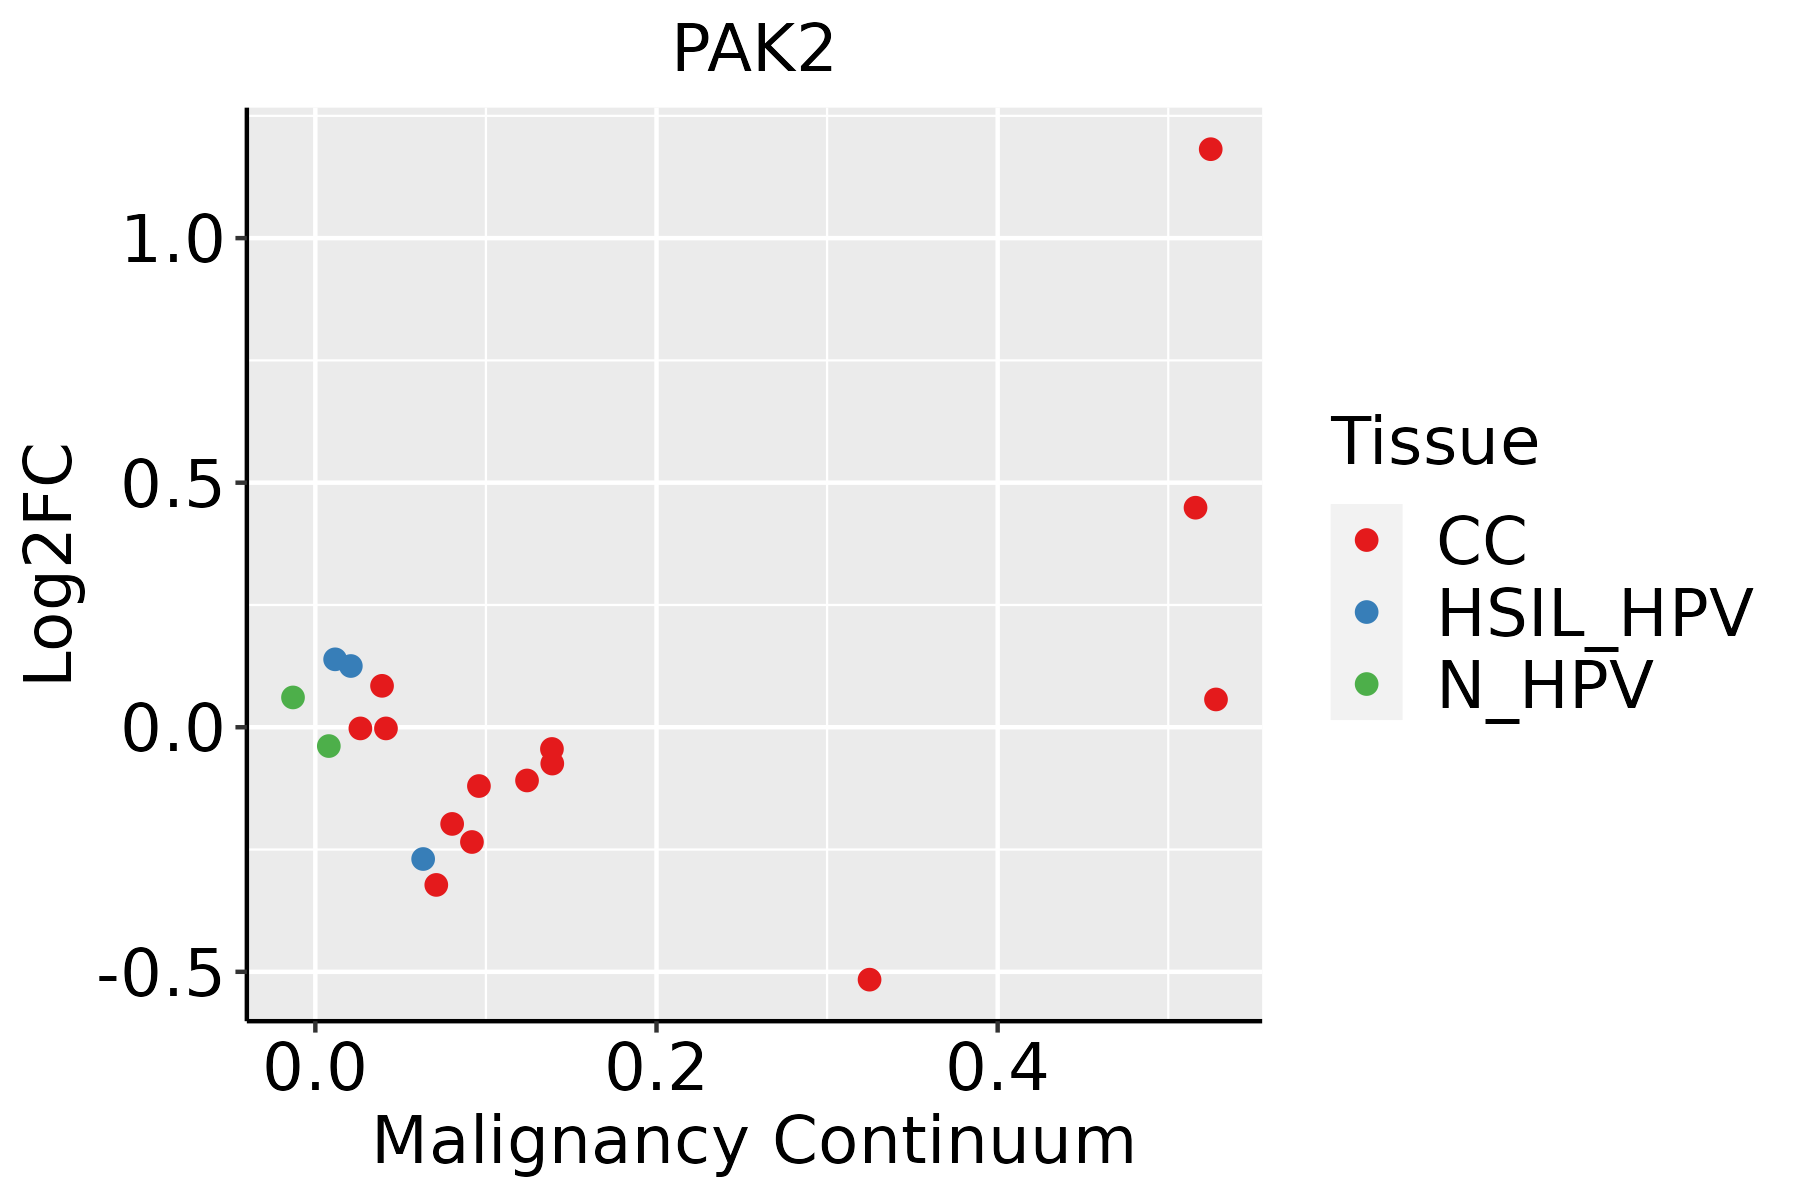 | CC: Cervix cancer |
| HSIL_HPV: HPV-infected high-grade squamous intraepithelial lesions |
| N_HPV: HPV-infected normal cervix |
| Esophagus | 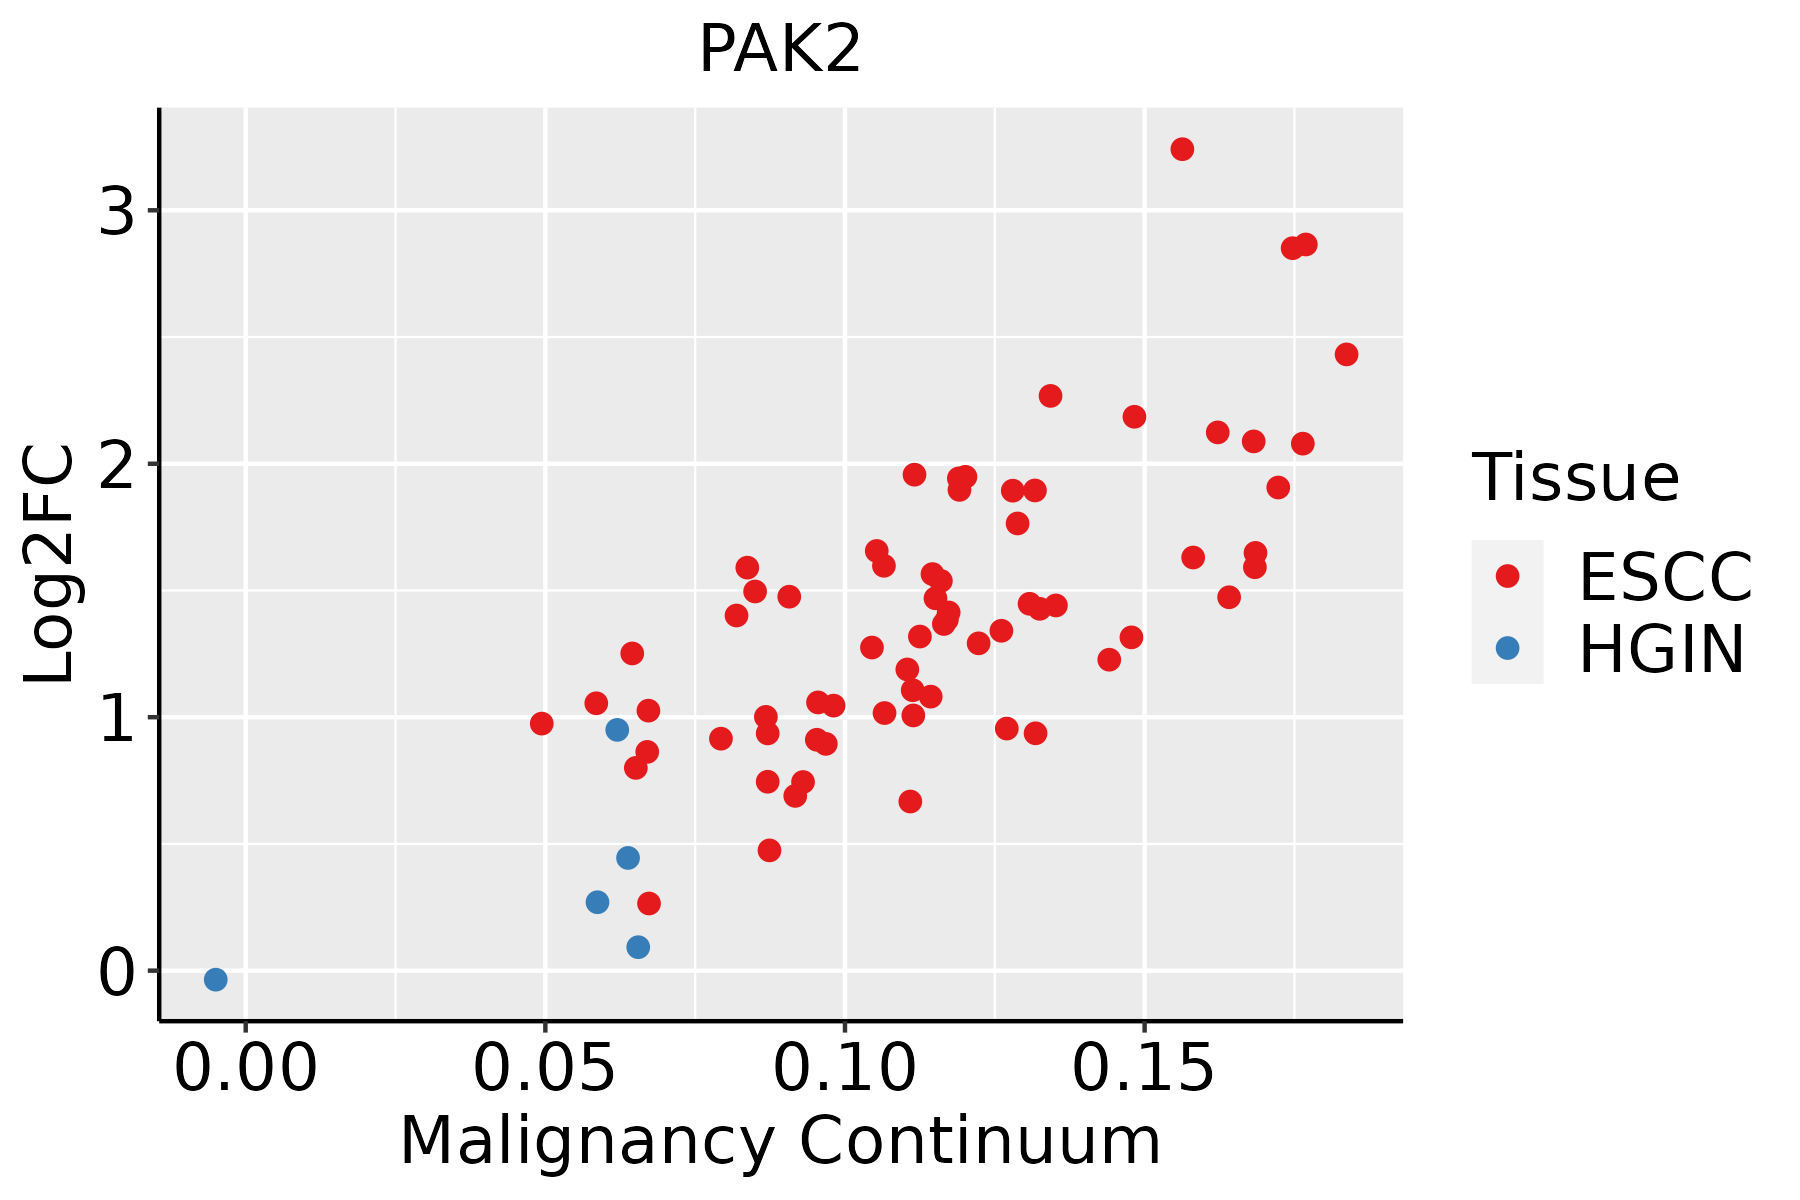 | ESCC: Esophageal squamous cell carcinoma |
| HGIN: High-grade intraepithelial neoplasias |
| LGIN: Low-grade intraepithelial neoplasias |
| Liver | 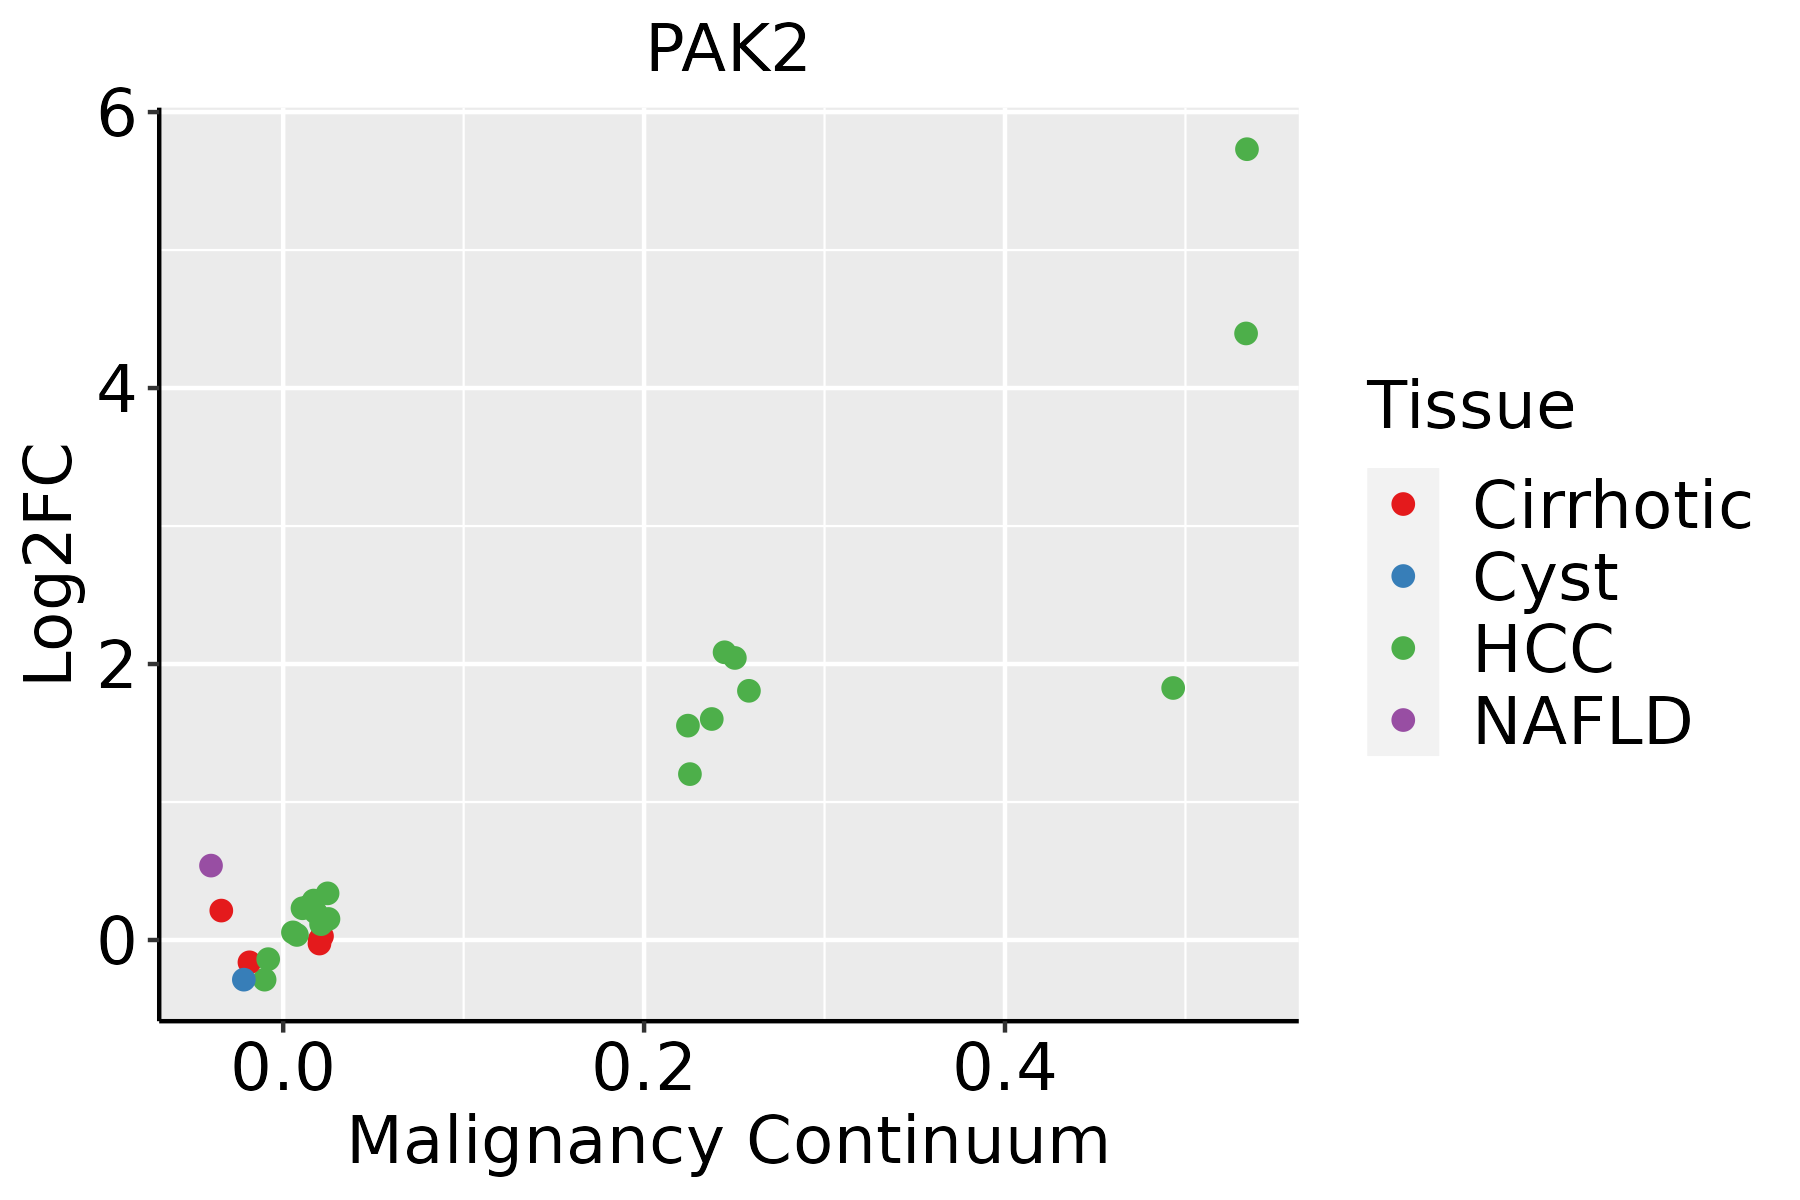 | HCC: Hepatocellular carcinoma |
| NAFLD: Non-alcoholic fatty liver disease |
| Lung |  | AAH: Atypical adenomatous hyperplasia |
| AIS: Adenocarcinoma in situ |
| IAC: Invasive lung adenocarcinoma |
| MIA: Minimally invasive adenocarcinoma |
| Oral Cavity | 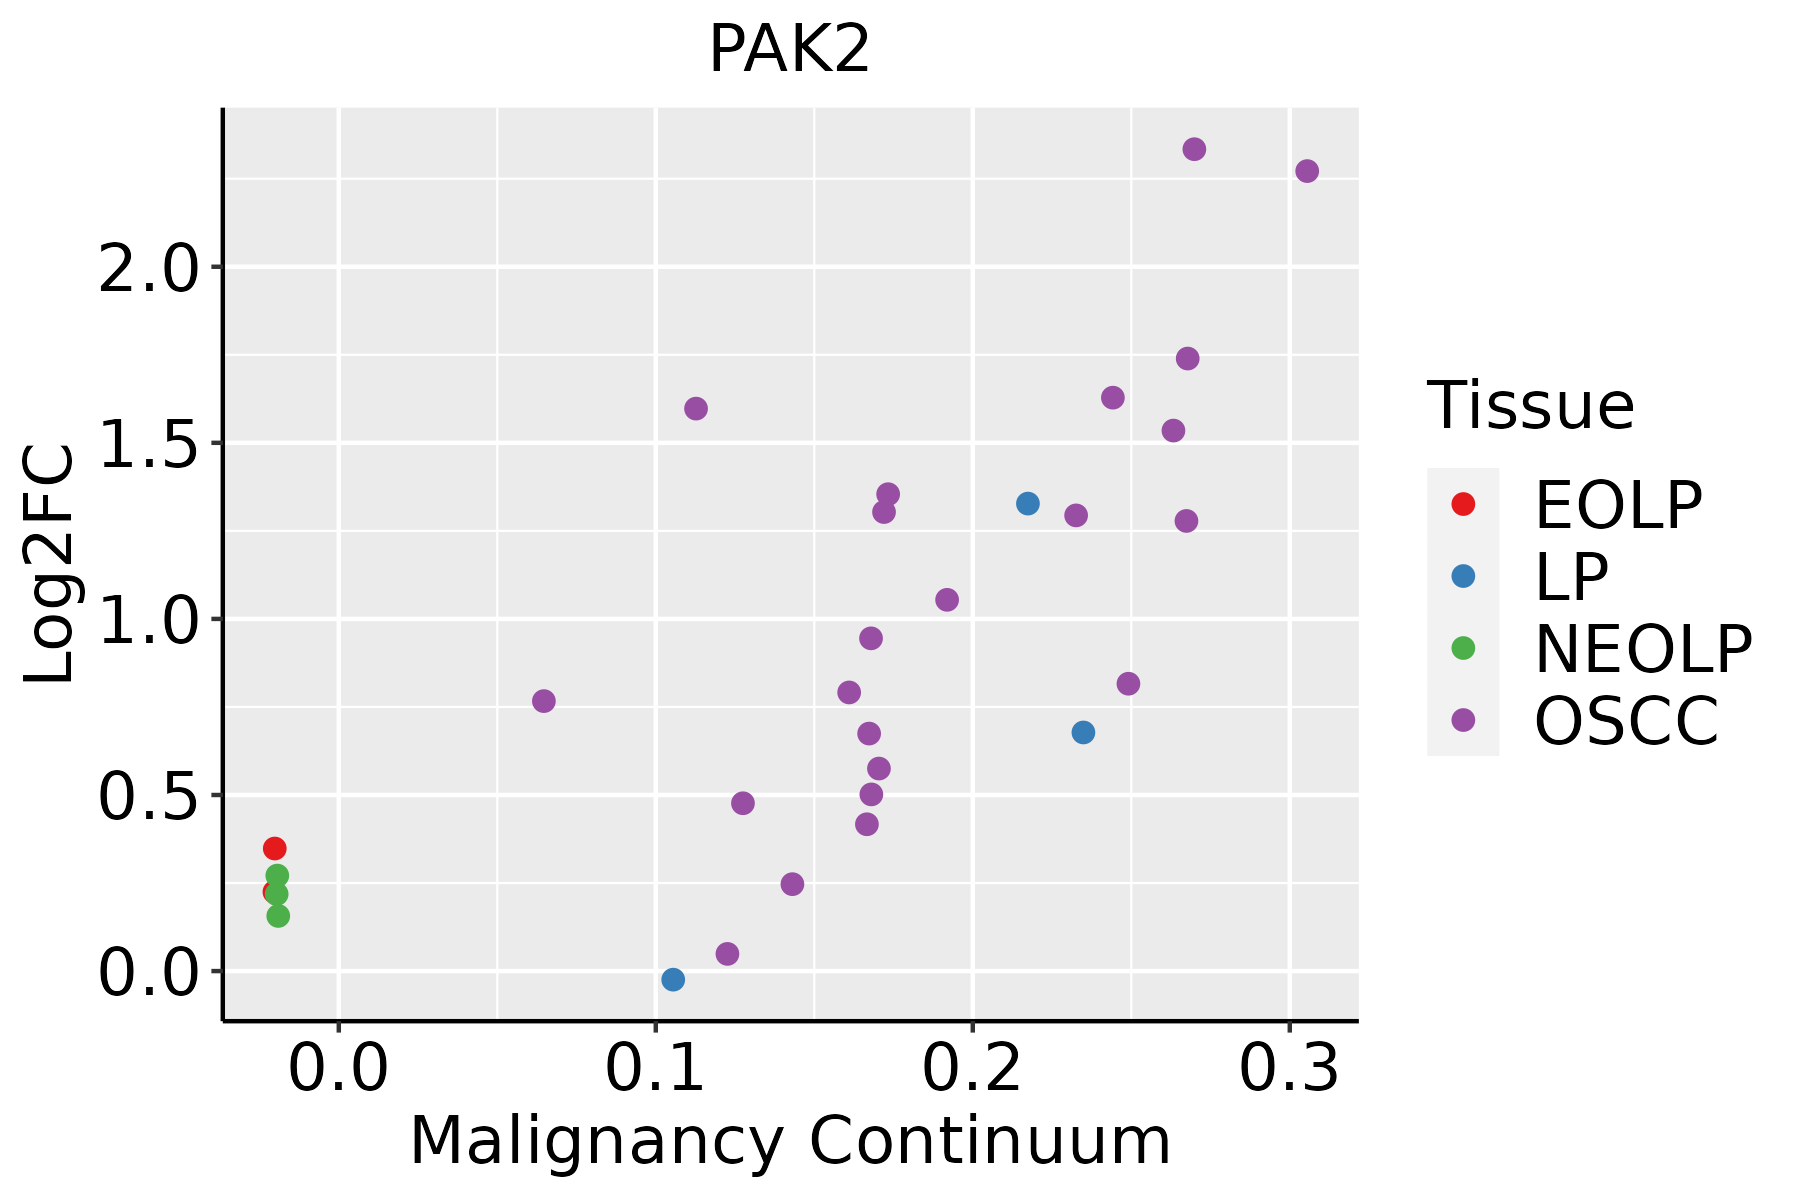 | EOLP: Erosive Oral lichen planus |
| LP: leukoplakia |
| NEOLP: Non-erosive oral lichen planus |
| OSCC: Oral squamous cell carcinoma |
| Prostate | 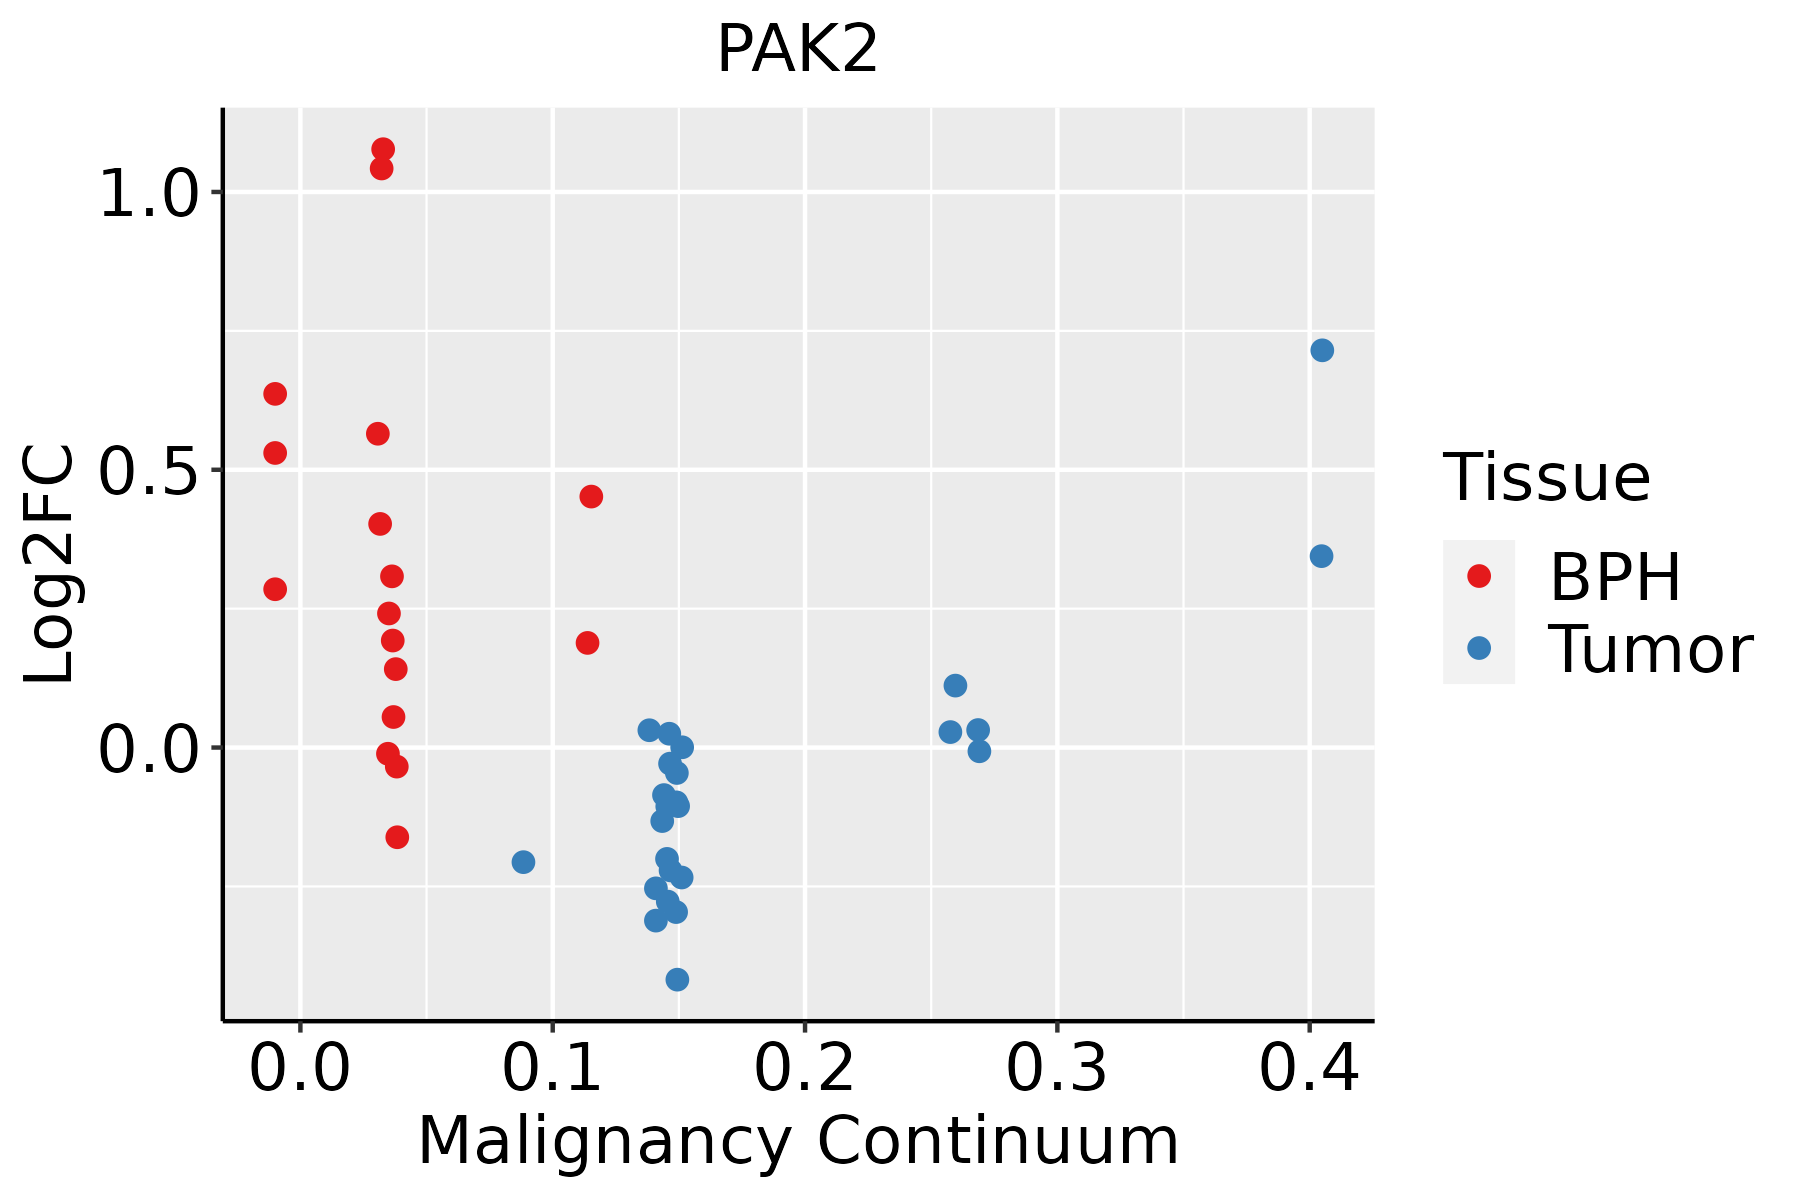 | BPH: Benign Prostatic Hyperplasia |
| Skin | 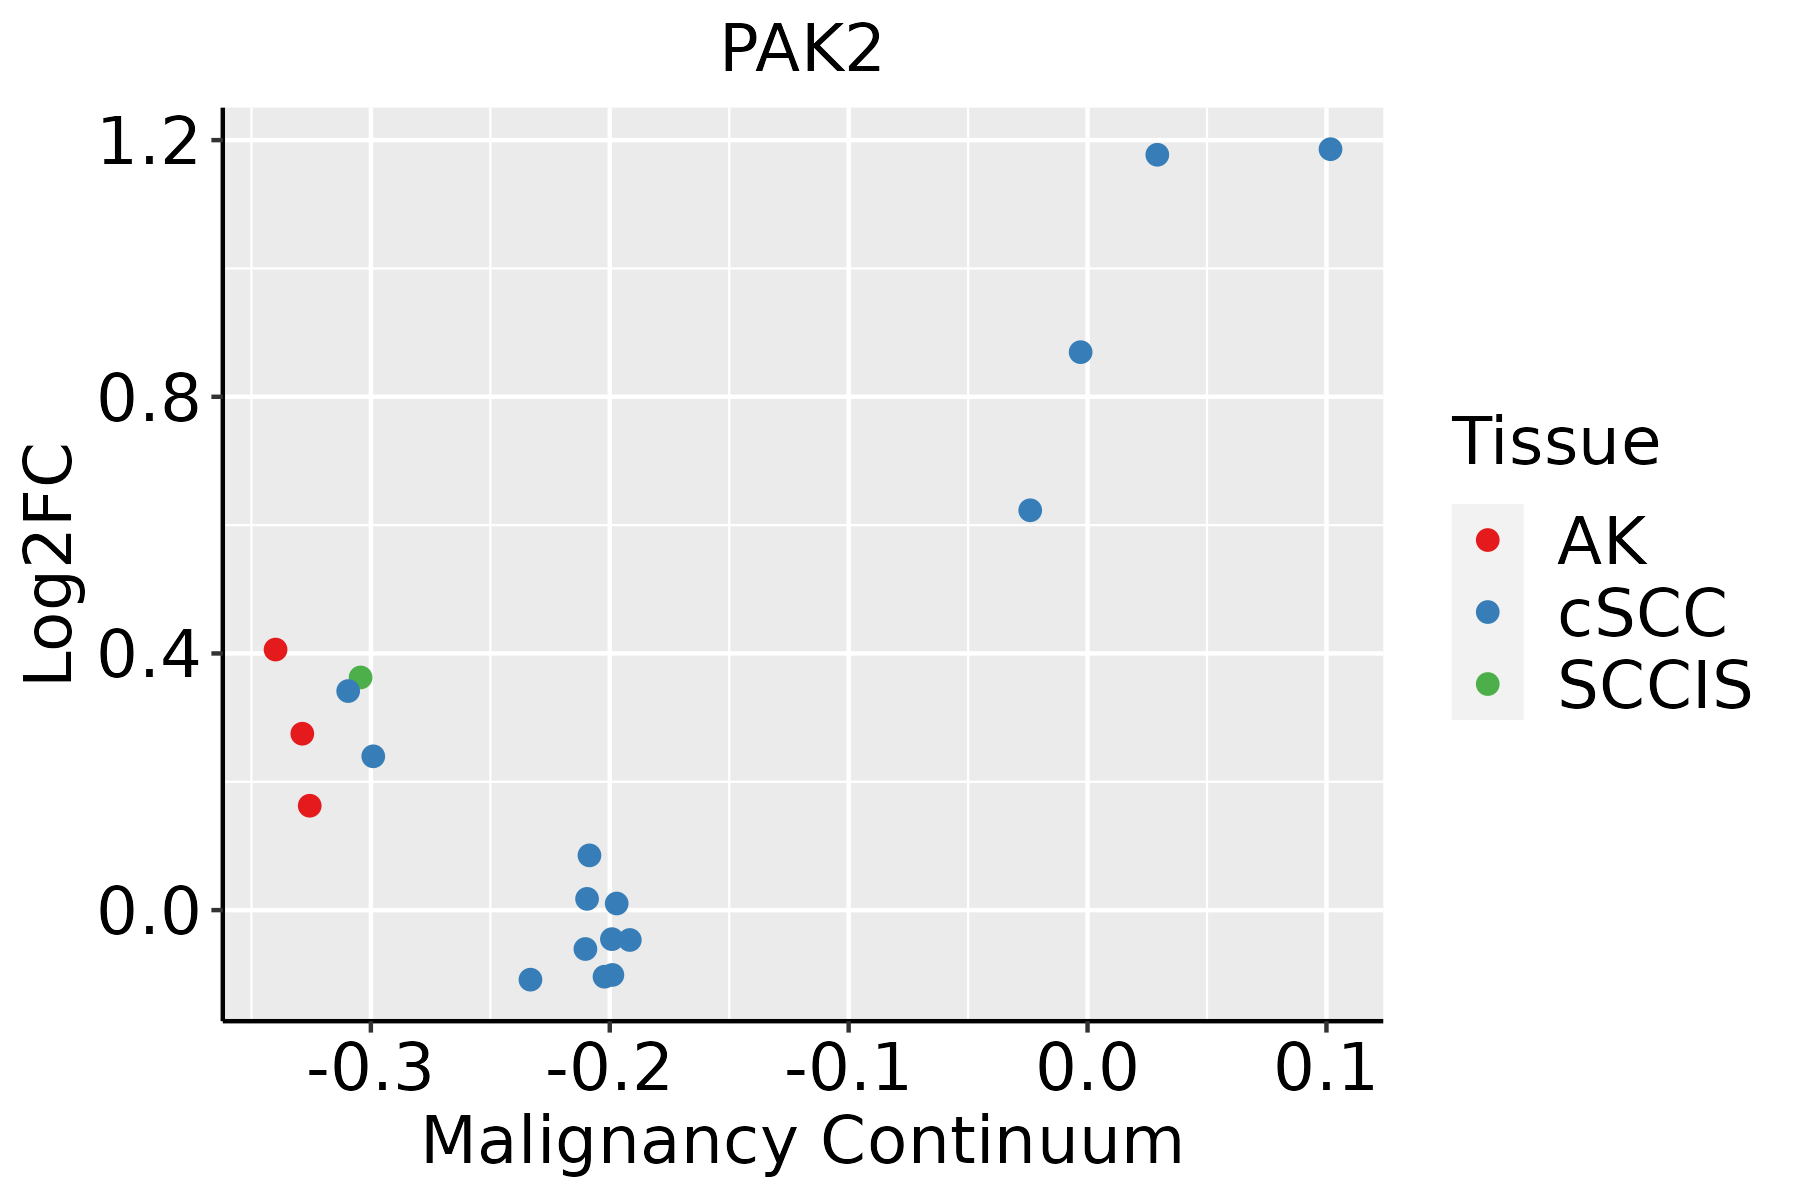 | AK: Actinic keratosis |
| cSCC: Cutaneous squamous cell carcinoma |
| SCCIS:squamous cell carcinoma in situ |
| Thyroid |  | ATC: Anaplastic thyroid cancer |
| HT: Hashimoto's thyroiditis |
| PTC: Papillary thyroid cancer |
| GO ID | Tissue | Disease Stage | Description | Gene Ratio | Bg Ratio | pvalue | p.adjust | Count |
| GO:0097191112 | Skin | SCCIS | extrinsic apoptotic signaling pathway | 26/919 | 219/18723 | 2.87e-05 | 7.82e-04 | 26 |
| GO:0010951110 | Skin | SCCIS | negative regulation of endopeptidase activity | 28/919 | 252/18723 | 4.82e-05 | 1.18e-03 | 28 |
| GO:0045936112 | Skin | SCCIS | negative regulation of phosphate metabolic process | 41/919 | 441/18723 | 6.90e-05 | 1.63e-03 | 41 |
| GO:0010563112 | Skin | SCCIS | negative regulation of phosphorus metabolic process | 41/919 | 442/18723 | 7.25e-05 | 1.71e-03 | 41 |
| GO:006099615 | Skin | SCCIS | dendritic spine development | 15/919 | 99/18723 | 9.34e-05 | 2.10e-03 | 15 |
| GO:0010466110 | Skin | SCCIS | negative regulation of peptidase activity | 28/919 | 262/18723 | 9.55e-05 | 2.12e-03 | 28 |
| GO:006109711 | Skin | SCCIS | regulation of protein tyrosine kinase activity | 14/919 | 90/18723 | 1.19e-04 | 2.49e-03 | 14 |
| GO:0007015111 | Skin | SCCIS | actin filament organization | 40/919 | 442/18723 | 1.50e-04 | 3.04e-03 | 40 |
| GO:000283113 | Skin | SCCIS | regulation of response to biotic stimulus | 32/919 | 327/18723 | 1.67e-04 | 3.31e-03 | 32 |
| GO:0042326112 | Skin | SCCIS | negative regulation of phosphorylation | 36/919 | 385/18723 | 1.67e-04 | 3.31e-03 | 36 |
| GO:0001933112 | Skin | SCCIS | negative regulation of protein phosphorylation | 33/919 | 342/18723 | 1.73e-04 | 3.35e-03 | 33 |
| GO:000276414 | Skin | SCCIS | immune response-regulating signaling pathway | 41/919 | 468/18723 | 2.48e-04 | 4.52e-03 | 41 |
| GO:0007043110 | Skin | SCCIS | cell-cell junction assembly | 18/919 | 146/18723 | 2.94e-04 | 5.23e-03 | 18 |
| GO:0061098 | Skin | SCCIS | positive regulation of protein tyrosine kinase activity | 10/919 | 55/18723 | 3.02e-04 | 5.31e-03 | 10 |
| GO:0051348112 | Skin | SCCIS | negative regulation of transferase activity | 27/919 | 268/18723 | 3.31e-04 | 5.76e-03 | 27 |
| GO:0045860110 | Skin | SCCIS | positive regulation of protein kinase activity | 35/919 | 386/18723 | 3.66e-04 | 6.19e-03 | 35 |
| GO:015010518 | Skin | SCCIS | protein localization to cell-cell junction | 6/919 | 21/18723 | 3.95e-04 | 6.58e-03 | 6 |
| GO:0032970112 | Skin | SCCIS | regulation of actin filament-based process | 35/919 | 397/18723 | 6.13e-04 | 9.08e-03 | 35 |
| GO:190241413 | Skin | SCCIS | protein localization to cell junction | 13/919 | 94/18723 | 6.65e-04 | 9.62e-03 | 13 |
| GO:0032956112 | Skin | SCCIS | regulation of actin cytoskeleton organization | 32/919 | 358/18723 | 8.18e-04 | 1.10e-02 | 32 |
| Pathway ID | Tissue | Disease Stage | Description | Gene Ratio | Bg Ratio | pvalue | p.adjust | qvalue | Count |
| hsa0513024 | Breast | IDC | Pathogenic Escherichia coli infection | 42/867 | 197/8465 | 2.66e-06 | 3.92e-05 | 2.94e-05 | 42 |
| hsa0481014 | Breast | IDC | Regulation of actin cytoskeleton | 36/867 | 229/8465 | 5.79e-03 | 3.13e-02 | 2.34e-02 | 36 |
| hsa045109 | Breast | IDC | Focal adhesion | 32/867 | 203/8465 | 8.60e-03 | 4.23e-02 | 3.17e-02 | 32 |
| hsa052118 | Breast | IDC | Renal cell carcinoma | 14/867 | 69/8465 | 9.16e-03 | 4.37e-02 | 3.27e-02 | 14 |
| hsa0517014 | Breast | IDC | Human immunodeficiency virus 1 infection | 33/867 | 212/8465 | 9.28e-03 | 4.37e-02 | 3.27e-02 | 33 |
| hsa0513034 | Breast | IDC | Pathogenic Escherichia coli infection | 42/867 | 197/8465 | 2.66e-06 | 3.92e-05 | 2.94e-05 | 42 |
| hsa0481015 | Breast | IDC | Regulation of actin cytoskeleton | 36/867 | 229/8465 | 5.79e-03 | 3.13e-02 | 2.34e-02 | 36 |
| hsa0451013 | Breast | IDC | Focal adhesion | 32/867 | 203/8465 | 8.60e-03 | 4.23e-02 | 3.17e-02 | 32 |
| hsa0521113 | Breast | IDC | Renal cell carcinoma | 14/867 | 69/8465 | 9.16e-03 | 4.37e-02 | 3.27e-02 | 14 |
| hsa0517015 | Breast | IDC | Human immunodeficiency virus 1 infection | 33/867 | 212/8465 | 9.28e-03 | 4.37e-02 | 3.27e-02 | 33 |
| hsa0513043 | Breast | DCIS | Pathogenic Escherichia coli infection | 42/846 | 197/8465 | 1.40e-06 | 2.15e-05 | 1.59e-05 | 42 |
| hsa0517024 | Breast | DCIS | Human immunodeficiency virus 1 infection | 33/846 | 212/8465 | 6.49e-03 | 3.22e-02 | 2.37e-02 | 33 |
| hsa0481023 | Breast | DCIS | Regulation of actin cytoskeleton | 35/846 | 229/8465 | 6.89e-03 | 3.37e-02 | 2.48e-02 | 35 |
| hsa0521123 | Breast | DCIS | Renal cell carcinoma | 14/846 | 69/8465 | 7.42e-03 | 3.48e-02 | 2.56e-02 | 14 |
| hsa0513053 | Breast | DCIS | Pathogenic Escherichia coli infection | 42/846 | 197/8465 | 1.40e-06 | 2.15e-05 | 1.59e-05 | 42 |
| hsa0517034 | Breast | DCIS | Human immunodeficiency virus 1 infection | 33/846 | 212/8465 | 6.49e-03 | 3.22e-02 | 2.37e-02 | 33 |
| hsa0481033 | Breast | DCIS | Regulation of actin cytoskeleton | 35/846 | 229/8465 | 6.89e-03 | 3.37e-02 | 2.48e-02 | 35 |
| hsa0521133 | Breast | DCIS | Renal cell carcinoma | 14/846 | 69/8465 | 7.42e-03 | 3.48e-02 | 2.56e-02 | 14 |
| hsa0513020 | Cervix | CC | Pathogenic Escherichia coli infection | 63/1267 | 197/8465 | 9.28e-10 | 2.00e-08 | 1.19e-08 | 63 |
| hsa0451010 | Cervix | CC | Focal adhesion | 59/1267 | 203/8465 | 1.53e-07 | 1.84e-06 | 1.09e-06 | 59 |
| Hugo Symbol | Variant Class | Variant Classification | dbSNP RS | HGVSc | HGVSp | HGVSp Short | SWISSPROT | BIOTYPE | SIFT | PolyPhen | Tumor Sample Barcode | Tissue | Histology | Sex | Age | Stage | Therapy Types | Drugs | Outcome |
| PAK2 | SNV | Missense_Mutation | | c.1312G>A | p.Glu438Lys | p.E438K | Q13177 | protein_coding | deleterious(0.02) | probably_damaging(0.995) | TCGA-A2-A0YK-01 | Breast | breast invasive carcinoma | Female | <65 | I/II | Chemotherapy | cytoxan | SD |
| PAK2 | SNV | Missense_Mutation | | c.1336N>A | p.Glu446Lys | p.E446K | Q13177 | protein_coding | deleterious(0) | probably_damaging(0.998) | TCGA-A2-A25A-01 | Breast | breast invasive carcinoma | Female | <65 | I/II | Unspecific | Cytoxan | SD |
| PAK2 | SNV | Missense_Mutation | | c.103N>G | p.His35Asp | p.H35D | Q13177 | protein_coding | tolerated(0.19) | benign(0.003) | TCGA-AN-A0XN-01 | Breast | breast invasive carcinoma | Female | >=65 | III/IV | Unknown | Unknown | SD |
| PAK2 | SNV | Missense_Mutation | | c.419N>C | p.Leu140Pro | p.L140P | Q13177 | protein_coding | tolerated(0.08) | possibly_damaging(0.62) | TCGA-AO-A128-01 | Breast | breast invasive carcinoma | Female | <65 | I/II | Chemotherapy | doxorubicin | SD |
| PAK2 | SNV | Missense_Mutation | novel | c.241G>A | p.Glu81Lys | p.E81K | Q13177 | protein_coding | tolerated(0.35) | possibly_damaging(0.734) | TCGA-C8-A8HQ-01 | Breast | breast invasive carcinoma | Female | <65 | I/II | Unknown | Unknown | SD |
| PAK2 | SNV | Missense_Mutation | rs774110601 | c.1250N>A | p.Arg417Gln | p.R417Q | Q13177 | protein_coding | tolerated(0.11) | probably_damaging(0.993) | TCGA-E9-A295-01 | Breast | breast invasive carcinoma | Female | >=65 | I/II | Hormone Therapy | tamoxiphen | SD |
| PAK2 | insertion | In_Frame_Ins | novel | c.627_628insTCTCGCTCTGTCGCC | p.Ser209_His210insSerArgSerValAla | p.S209_H210insSRSVA | Q13177 | protein_coding | | | TCGA-A8-A08F-01 | Breast | breast invasive carcinoma | Female | <65 | III/IV | Chemotherapy | 5-fluorouracil | CR |
| PAK2 | insertion | Frame_Shift_Ins | novel | c.566_567insAAGAAGCAAACTTTTTGAAG | p.His189GlnfsTer17 | p.H189Qfs*17 | Q13177 | protein_coding | | | TCGA-A8-A09D-01 | Breast | breast invasive carcinoma | Female | <65 | I/II | Chemotherapy | doxorubicin | CR |
| PAK2 | insertion | Frame_Shift_Ins | novel | c.570_571insTTCATAAAGGGCGATAGTCG | p.Lys191PhefsTer15 | p.K191Ffs*15 | Q13177 | protein_coding | | | TCGA-A8-A09D-01 | Breast | breast invasive carcinoma | Female | <65 | I/II | Chemotherapy | doxorubicin | CR |
| PAK2 | insertion | Nonsense_Mutation | novel | c.746_747insATGATACACAGTCATTGCTAACAACTAGTACAGTT | p.Tyr249Ter | p.Y249* | Q13177 | protein_coding | | | TCGA-AN-A03X-01 | Breast | breast invasive carcinoma | Female | >=65 | I/II | Unknown | Unknown | SD |
| Entrez ID | Symbol | Category | Interaction Types | Drug Claim Name | Drug Name | PMIDs |
| 5062 | PAK2 | ENZYME, KINASE, SERINE THREONINE KINASE, DRUGGABLE GENOME | inhibitor | 310264720 | | |
| 5062 | PAK2 | ENZYME, KINASE, SERINE THREONINE KINASE, DRUGGABLE GENOME | inhibitor | 249565812 | | |
| 5062 | PAK2 | ENZYME, KINASE, SERINE THREONINE KINASE, DRUGGABLE GENOME | inhibitor | 310264719 | | |
| 5062 | PAK2 | ENZYME, KINASE, SERINE THREONINE KINASE, DRUGGABLE GENOME | inhibitor | 329968394 | | |
| 5062 | PAK2 | ENZYME, KINASE, SERINE THREONINE KINASE, DRUGGABLE GENOME | allosteric modulator | 310264717 | | |
| 5062 | PAK2 | ENZYME, KINASE, SERINE THREONINE KINASE, DRUGGABLE GENOME | inhibitor | 310264722 | | |
| 5062 | PAK2 | ENZYME, KINASE, SERINE THREONINE KINASE, DRUGGABLE GENOME | inhibitor | 310264718 | PF-03758309 | |
| 5062 | PAK2 | ENZYME, KINASE, SERINE THREONINE KINASE, DRUGGABLE GENOME | inhibitor | 135652717 | STAUROSPORINE | |


