| Tissue | Expression Dynamics | Abbreviation |
| Breast | 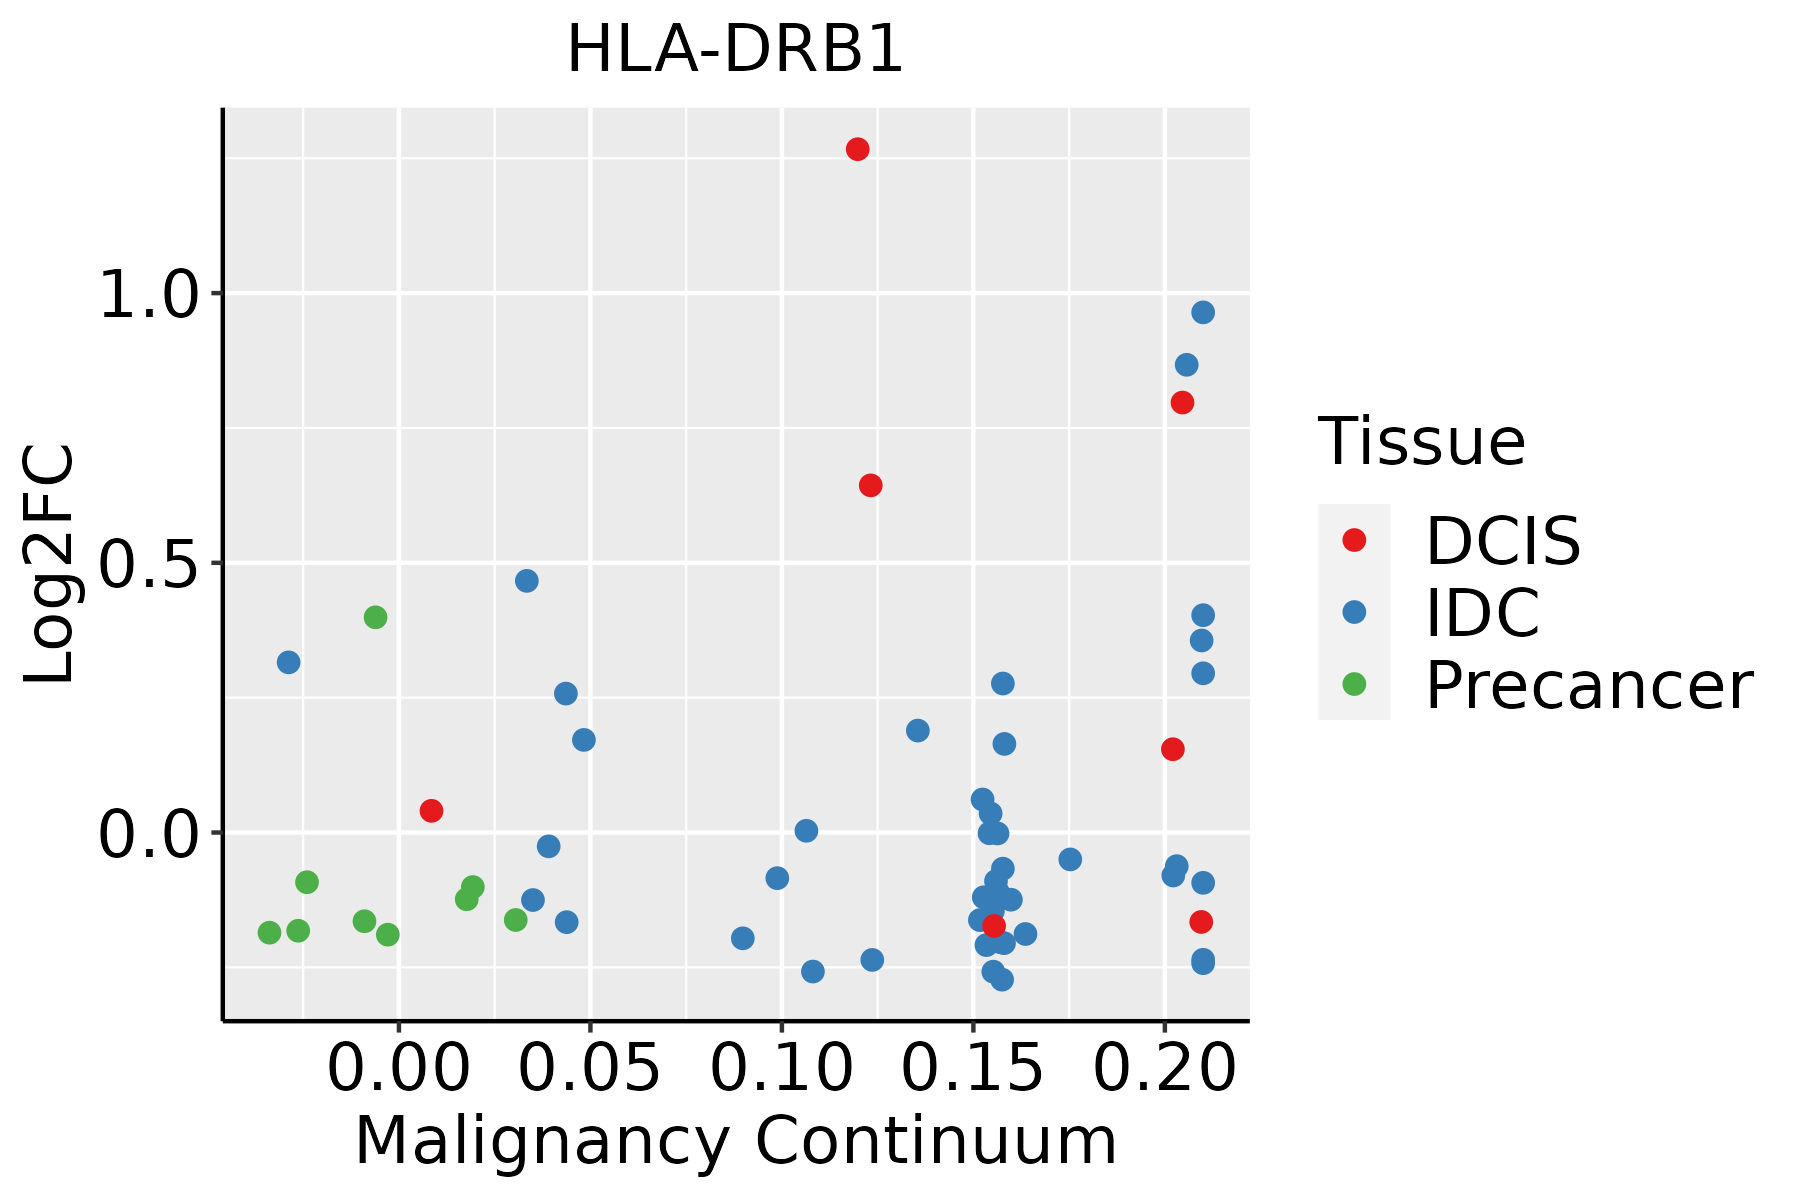 | IDC: Invasive ductal carcinoma |
| DCIS: Ductal carcinoma in situ |
| Precancer(BRCA1-mut): Precancerous lesion from BRCA1 mutation carriers |
| Cervix | 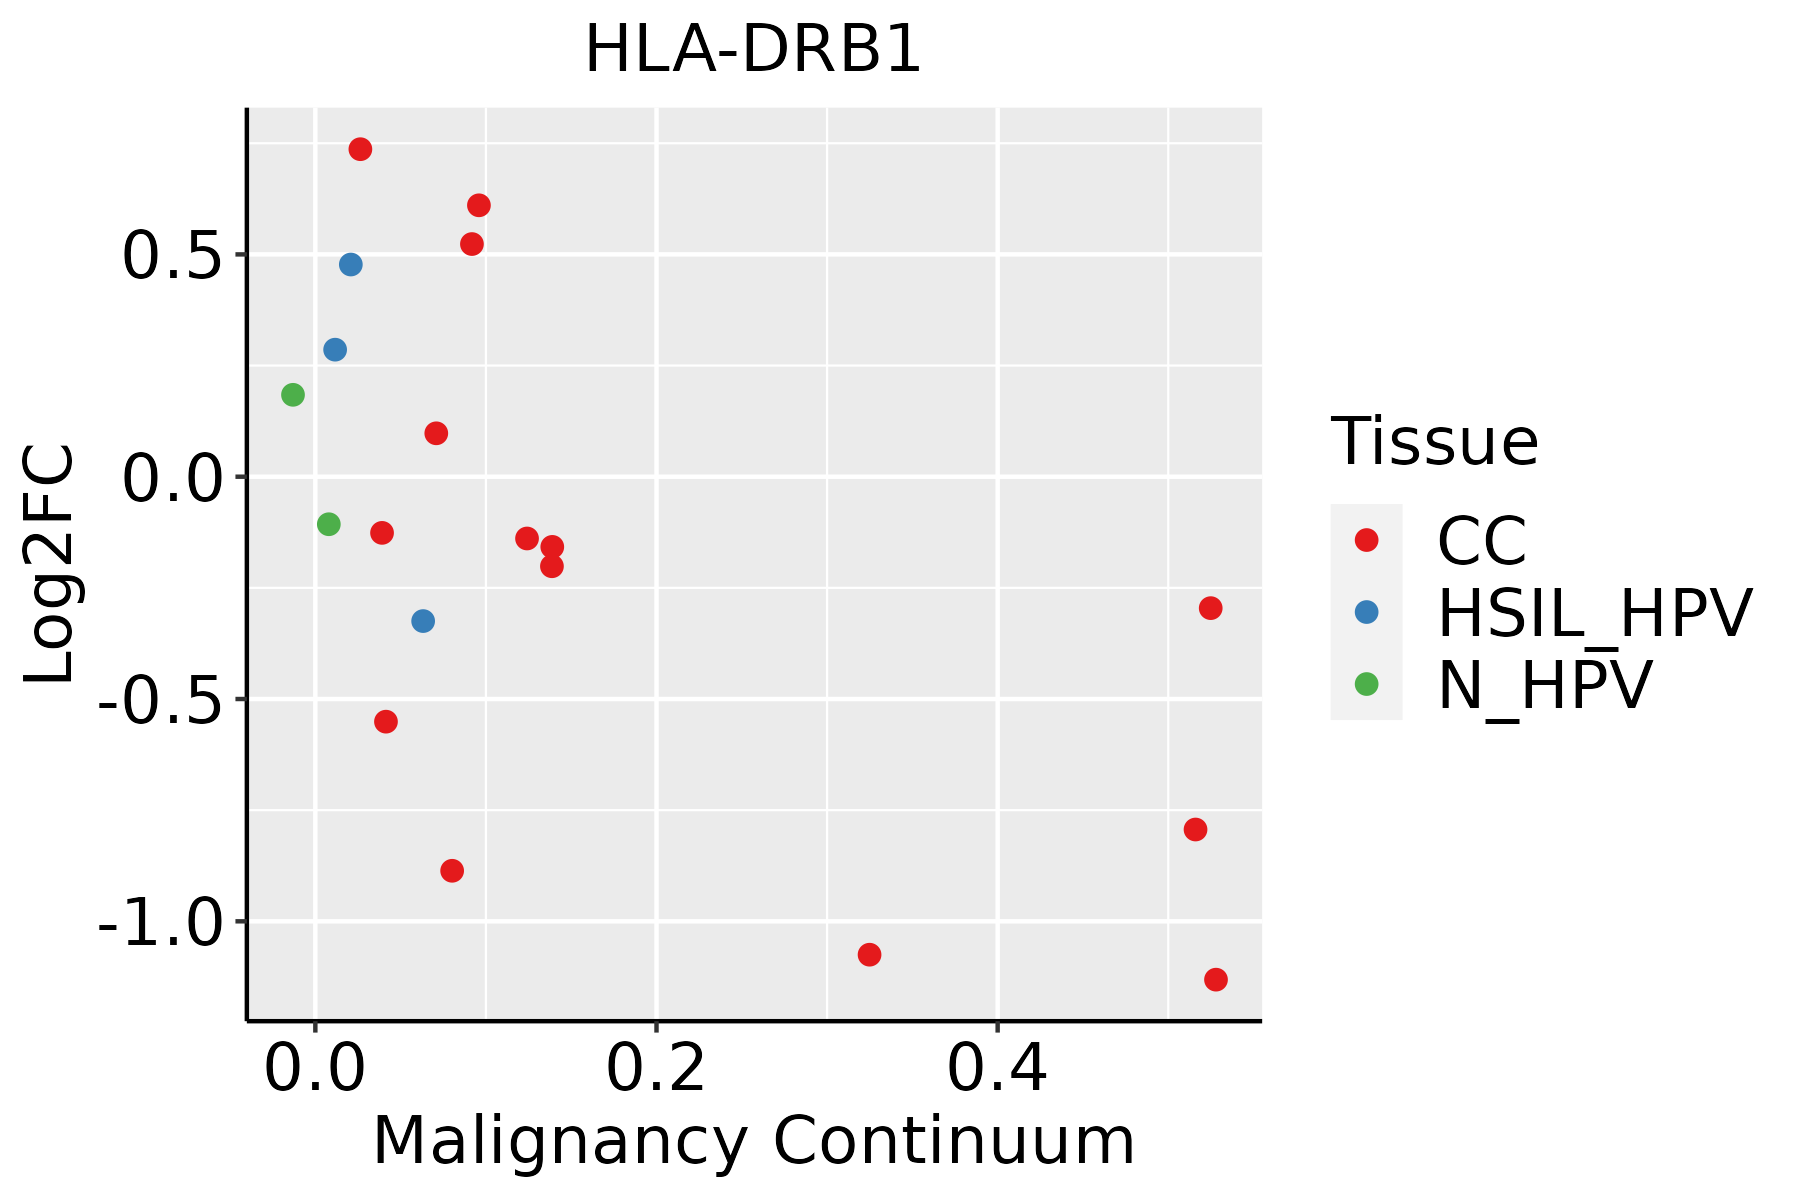 | CC: Cervix cancer |
| HSIL_HPV: HPV-infected high-grade squamous intraepithelial lesions |
| N_HPV: HPV-infected normal cervix |
| Colorectum (GSE201348) |  | FAP: Familial adenomatous polyposis |
| CRC: Colorectal cancer |
| Colorectum (HTA11) |  | AD: Adenomas |
| SER: Sessile serrated lesions |
| MSI-H: Microsatellite-high colorectal cancer |
| MSS: Microsatellite stable colorectal cancer |
| Endometrium |  | AEH: Atypical endometrial hyperplasia |
| EEC: Endometrioid Cancer |
| Esophagus | 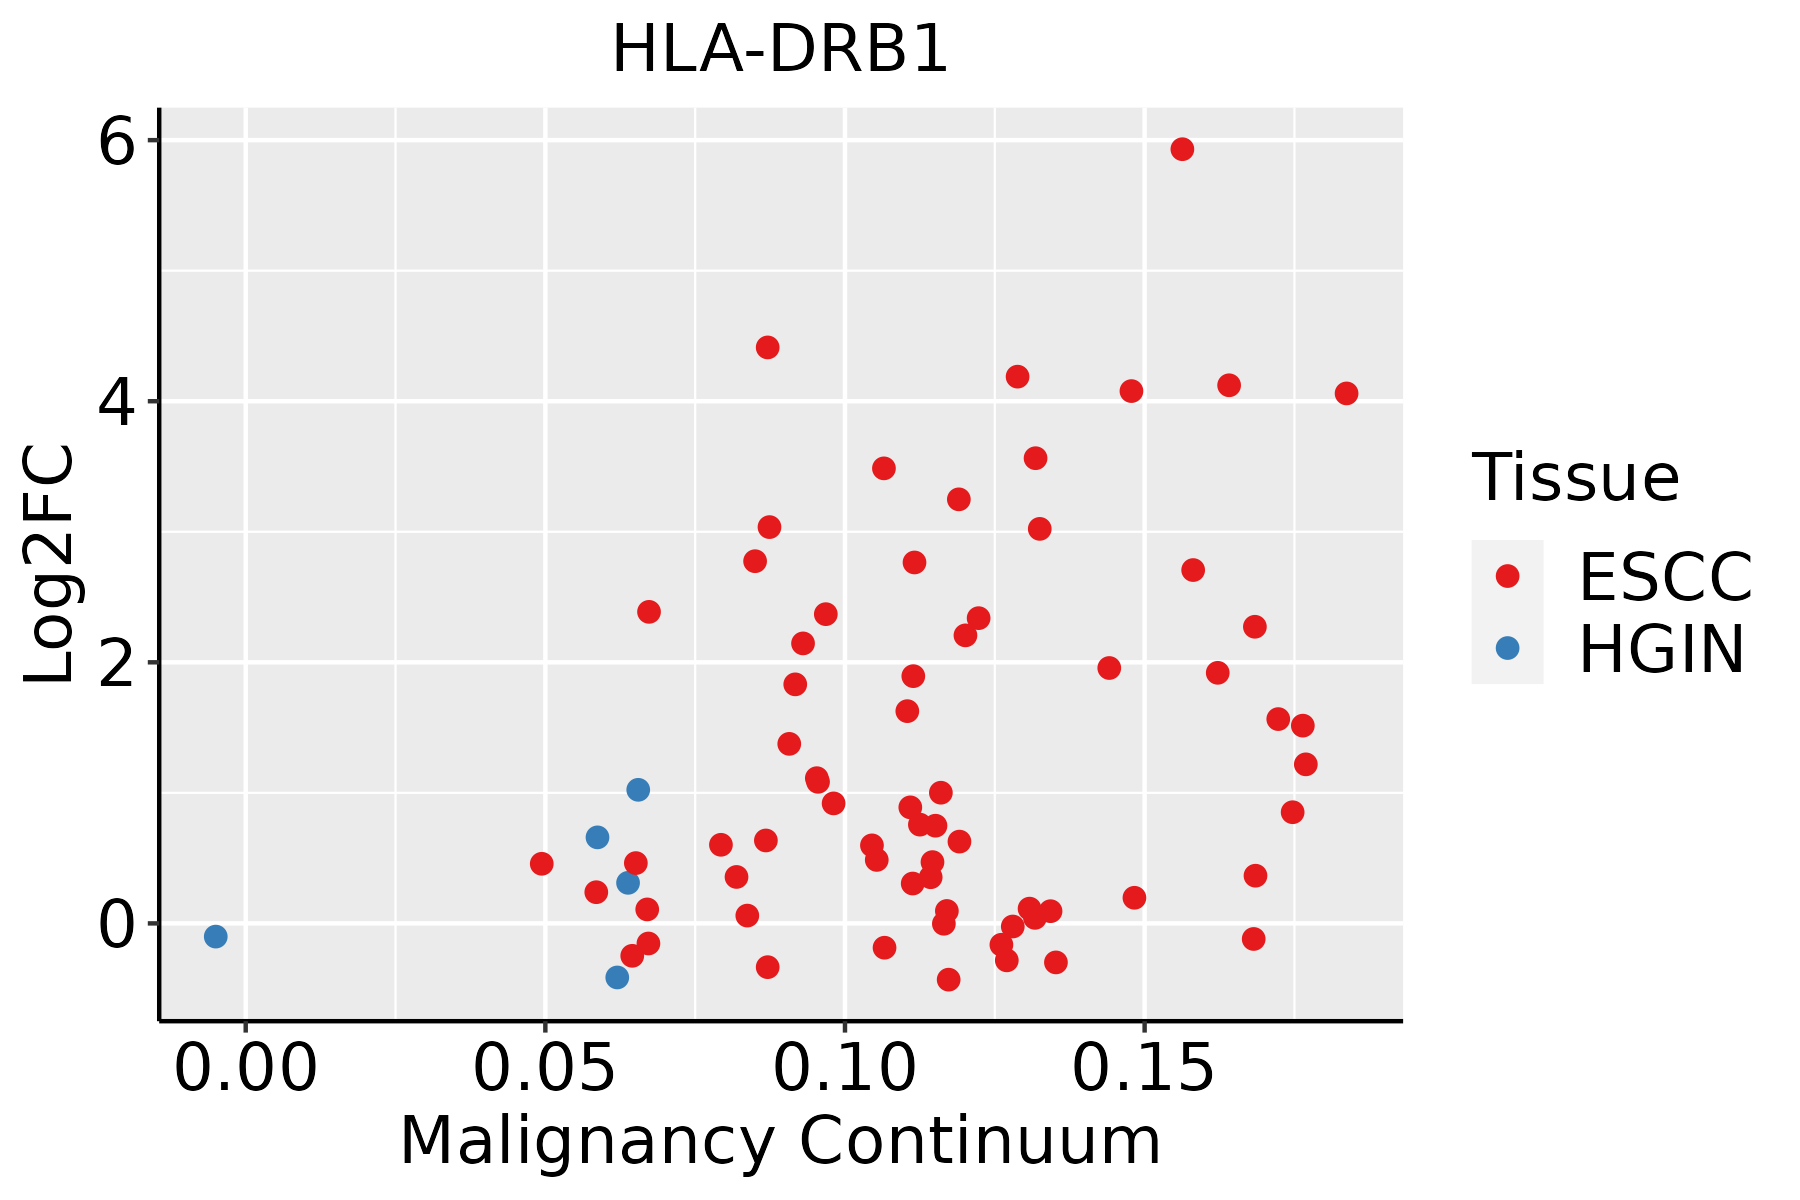 | ESCC: Esophageal squamous cell carcinoma |
| HGIN: High-grade intraepithelial neoplasias |
| LGIN: Low-grade intraepithelial neoplasias |
| GC | 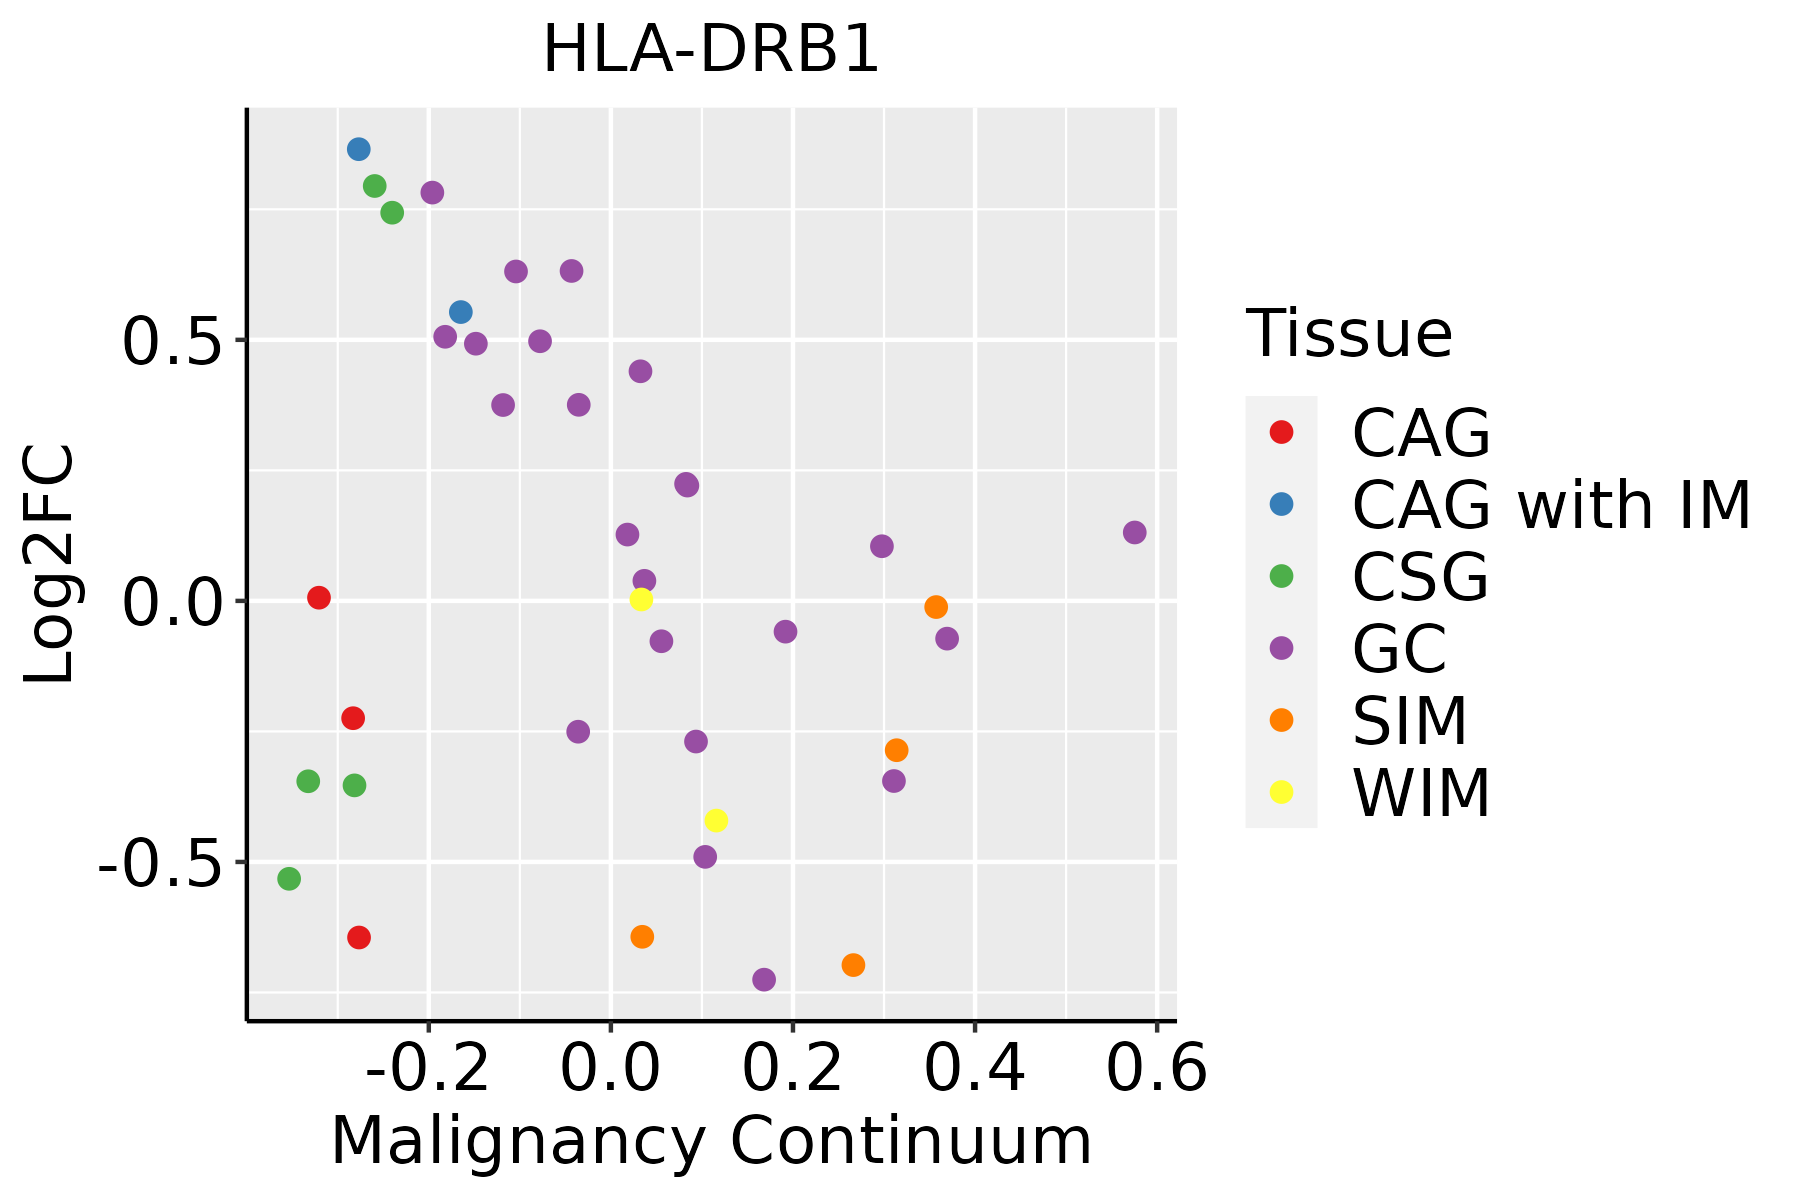 | CAG: Chronic atrophic gastritis |
| CAG with IM: Chronic atrophic gastritis with intestinal metaplasia |
| CSG: Chronic superficial gastritis |
| GC: Gastric cancer |
| SIM: Severe intestinal metaplasia |
| WIM: Wild intestinal metaplasia |
| Liver |  | HCC: Hepatocellular carcinoma |
| NAFLD: Non-alcoholic fatty liver disease |
| Lung |  | AAH: Atypical adenomatous hyperplasia |
| AIS: Adenocarcinoma in situ |
| IAC: Invasive lung adenocarcinoma |
| MIA: Minimally invasive adenocarcinoma |
| Oral Cavity |  | EOLP: Erosive Oral lichen planus |
| LP: leukoplakia |
| NEOLP: Non-erosive oral lichen planus |
| OSCC: Oral squamous cell carcinoma |
| Prostate | 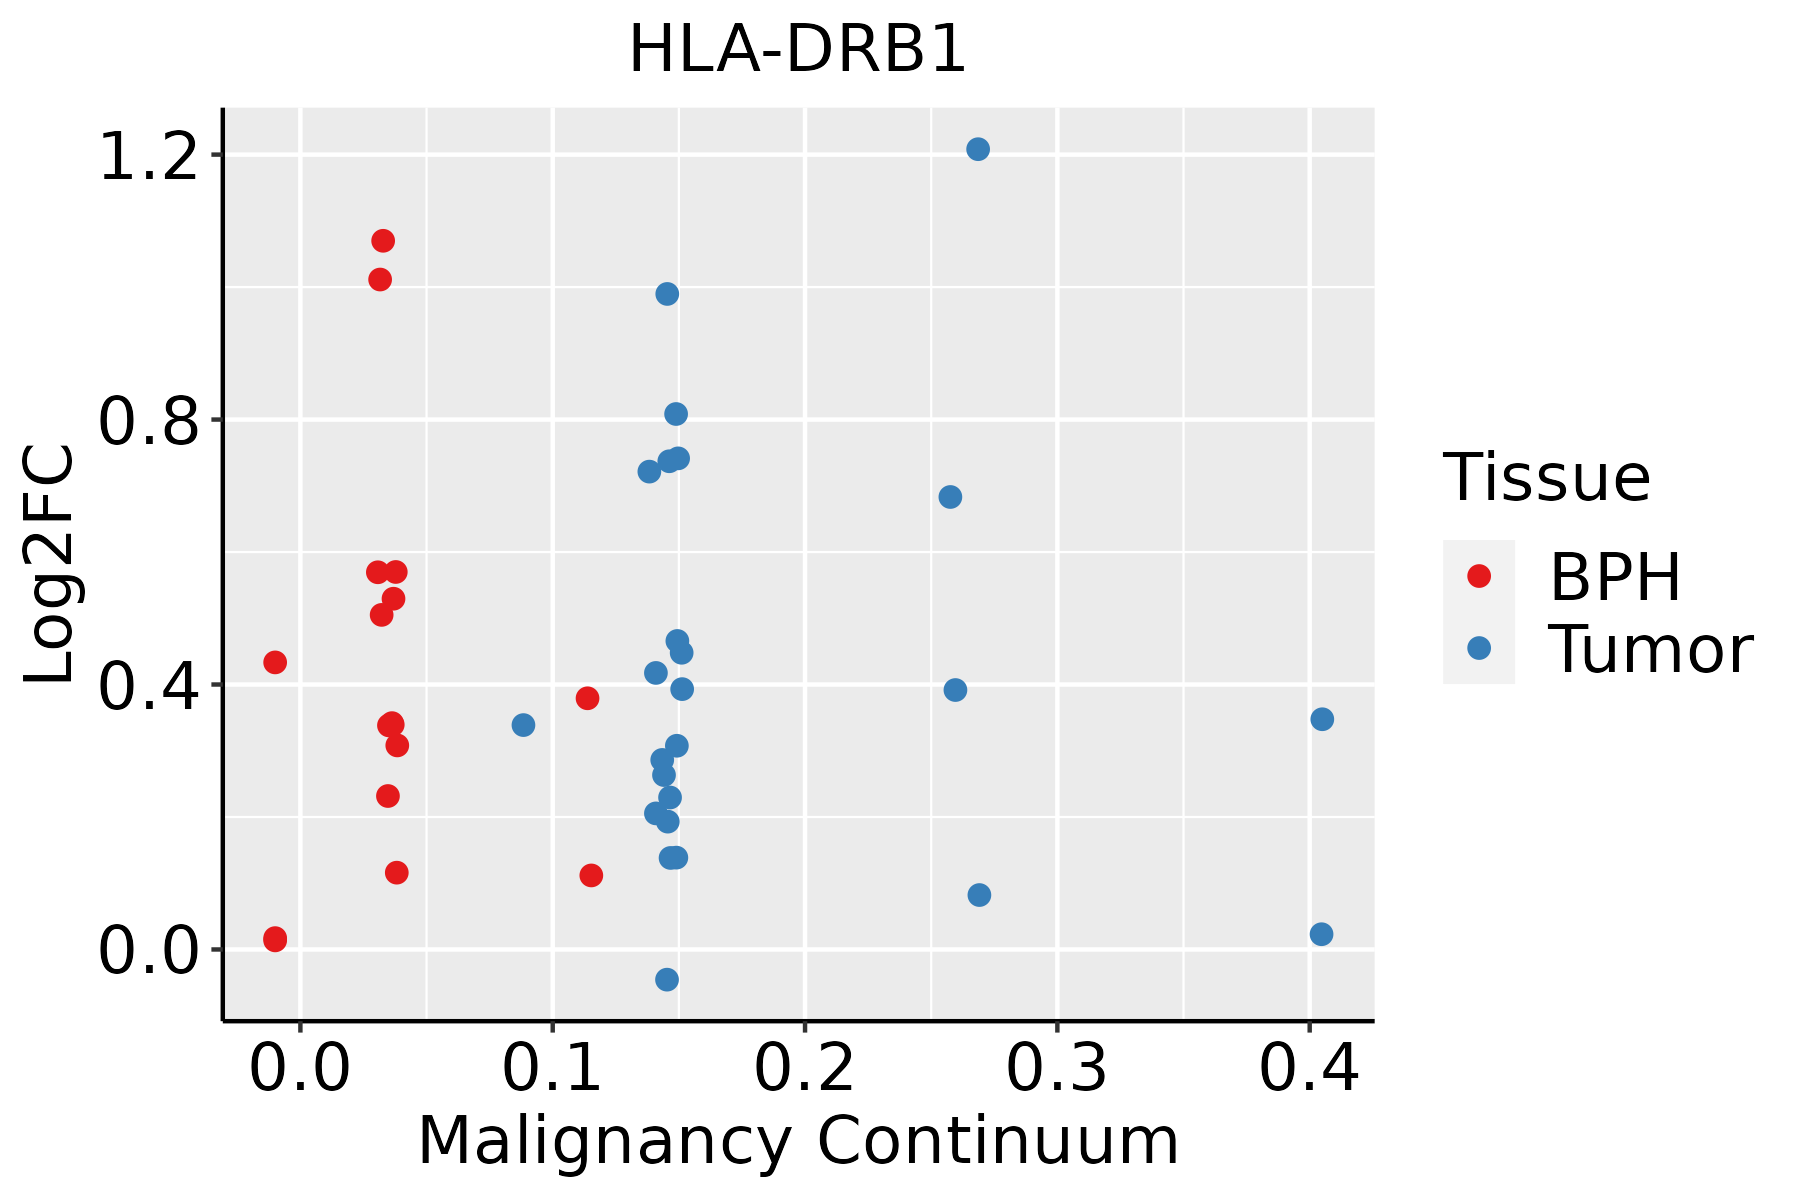 | BPH: Benign Prostatic Hyperplasia |
| Skin | 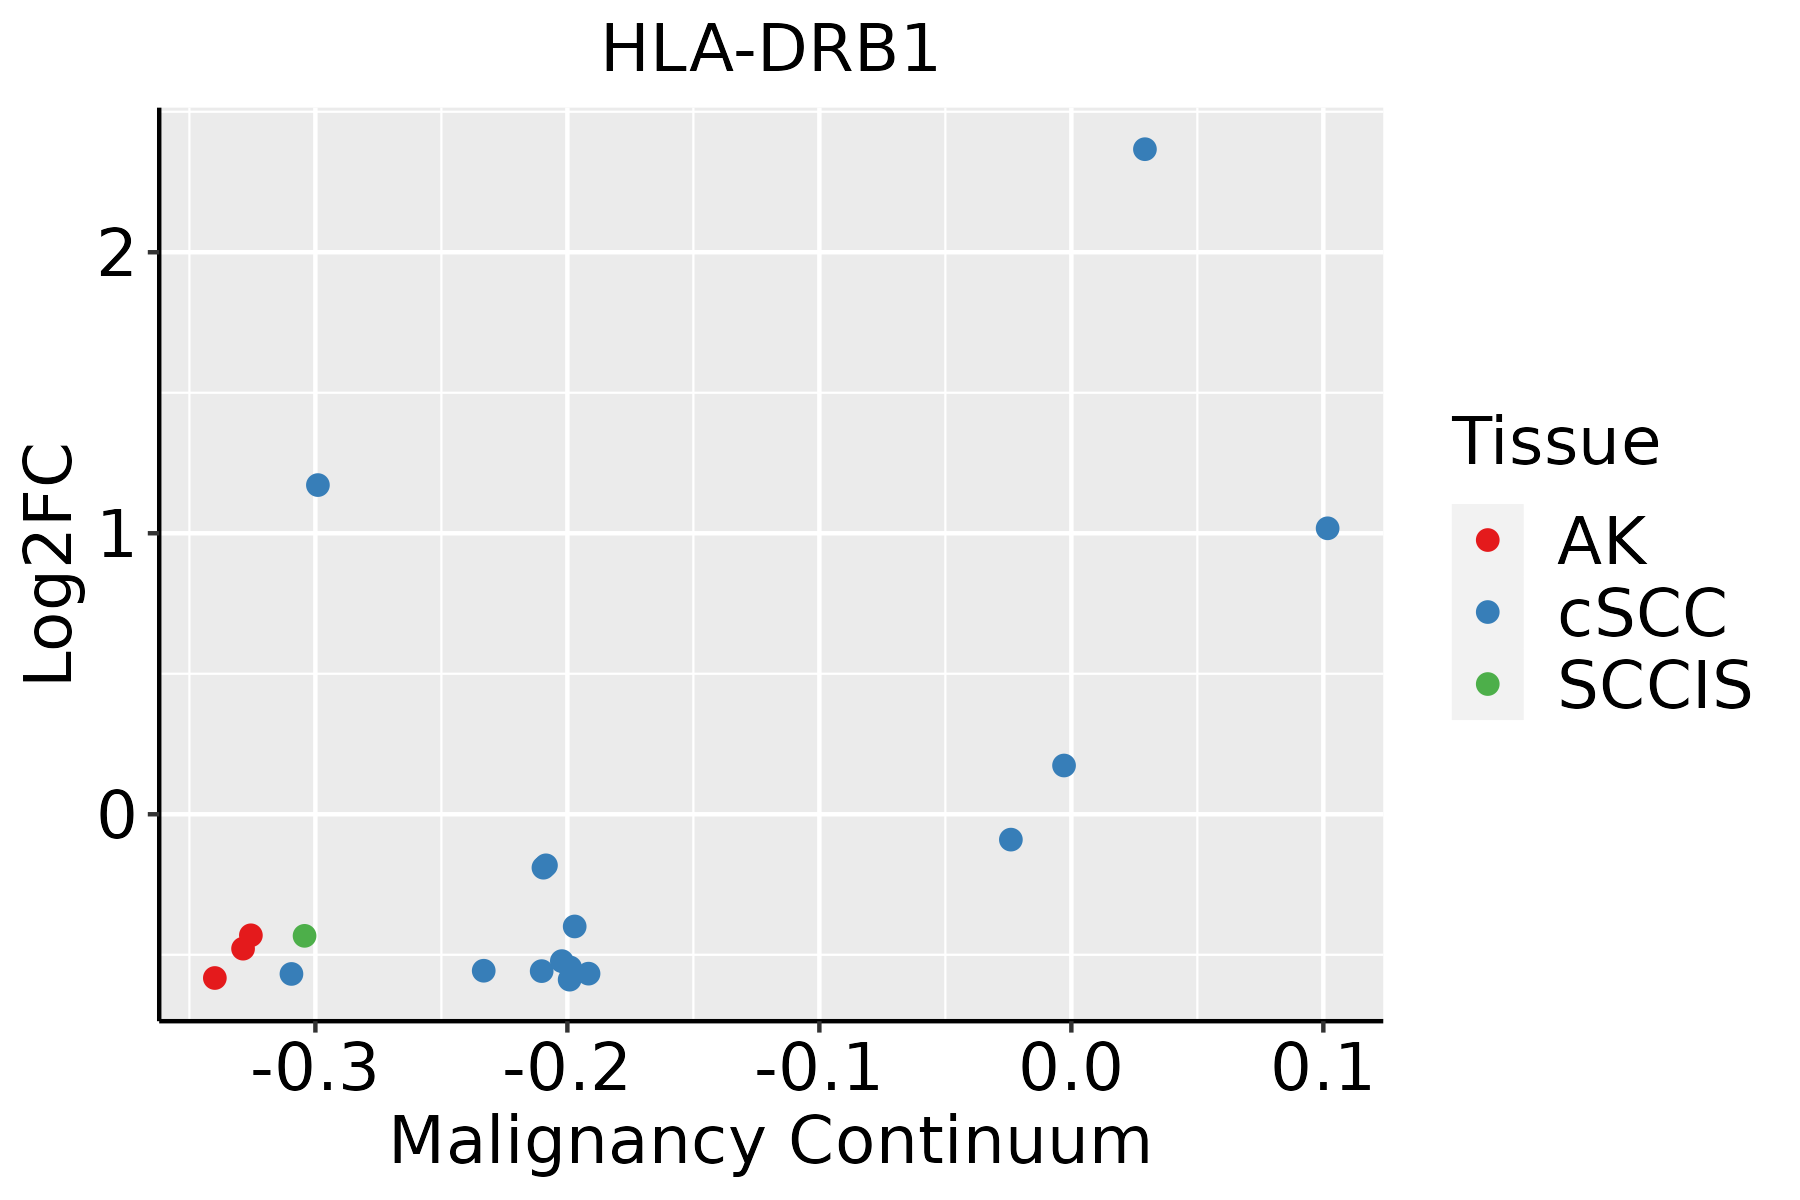 | AK: Actinic keratosis |
| cSCC: Cutaneous squamous cell carcinoma |
| SCCIS:squamous cell carcinoma in situ |
| Thyroid | 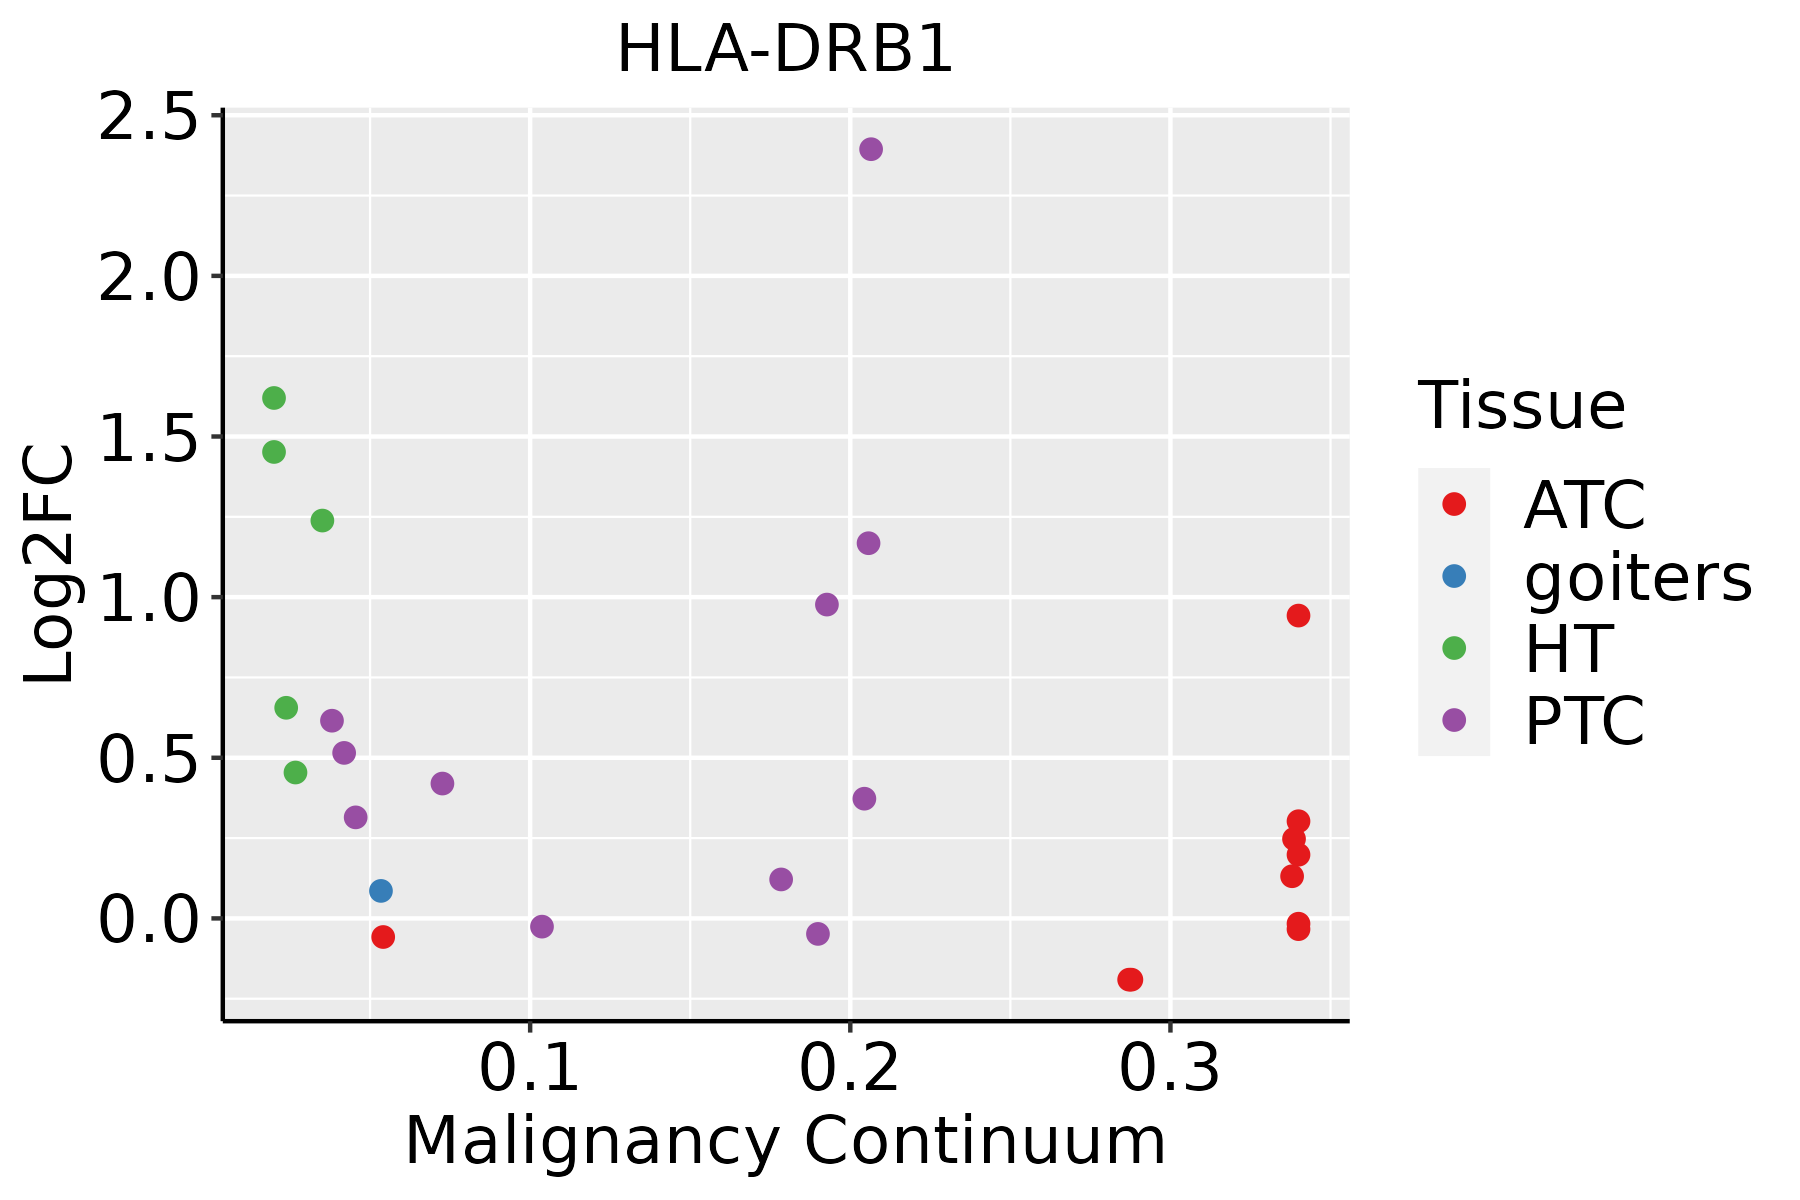 | ATC: Anaplastic thyroid cancer |
| HT: Hashimoto's thyroiditis |
| PTC: Papillary thyroid cancer |
| GO ID | Tissue | Disease Stage | Description | Gene Ratio | Bg Ratio | pvalue | p.adjust | Count |
| GO:005122216 | Endometrium | EEC | positive regulation of protein transport | 66/2168 | 303/18723 | 2.55e-07 | 1.09e-05 | 66 |
| GO:004671817 | Endometrium | EEC | viral entry into host cell | 38/2168 | 144/18723 | 7.19e-07 | 2.58e-05 | 38 |
| GO:004440917 | Endometrium | EEC | entry into host | 39/2168 | 151/18723 | 9.34e-07 | 3.22e-05 | 39 |
| GO:007133314 | Endometrium | EEC | cellular response to glucose stimulus | 39/2168 | 151/18723 | 9.34e-07 | 3.22e-05 | 39 |
| GO:007133114 | Endometrium | EEC | cellular response to hexose stimulus | 39/2168 | 153/18723 | 1.33e-06 | 4.35e-05 | 39 |
| GO:007132614 | Endometrium | EEC | cellular response to monosaccharide stimulus | 39/2168 | 154/18723 | 1.59e-06 | 4.96e-05 | 39 |
| GO:004259314 | Endometrium | EEC | glucose homeostasis | 56/2168 | 258/18723 | 2.26e-06 | 6.61e-05 | 56 |
| GO:003350014 | Endometrium | EEC | carbohydrate homeostasis | 56/2168 | 259/18723 | 2.56e-06 | 7.39e-05 | 56 |
| GO:005079217 | Endometrium | EEC | regulation of viral process | 40/2168 | 164/18723 | 3.24e-06 | 8.85e-05 | 40 |
| GO:004341011 | Endometrium | EEC | positive regulation of MAPK cascade | 89/2168 | 480/18723 | 4.21e-06 | 1.08e-04 | 89 |
| GO:002240715 | Endometrium | EEC | regulation of cell-cell adhesion | 84/2168 | 448/18723 | 4.98e-06 | 1.24e-04 | 84 |
| GO:004312216 | Endometrium | EEC | regulation of I-kappaB kinase/NF-kappaB signaling | 53/2168 | 249/18723 | 7.59e-06 | 1.73e-04 | 53 |
| GO:000250114 | Endometrium | EEC | peptide antigen assembly with MHC protein complex | 10/2168 | 18/18723 | 7.70e-06 | 1.75e-04 | 10 |
| GO:000247816 | Endometrium | EEC | antigen processing and presentation of exogenous peptide antigen | 15/2168 | 38/18723 | 9.82e-06 | 2.16e-04 | 15 |
| GO:001988416 | Endometrium | EEC | antigen processing and presentation of exogenous antigen | 17/2168 | 47/18723 | 1.02e-05 | 2.22e-04 | 17 |
| GO:190390017 | Endometrium | EEC | regulation of viral life cycle | 36/2168 | 148/18723 | 1.05e-05 | 2.25e-04 | 36 |
| GO:001988615 | Endometrium | EEC | antigen processing and presentation of exogenous peptide antigen via MHC class II | 13/2168 | 30/18723 | 1.15e-05 | 2.40e-04 | 13 |
| GO:000239614 | Endometrium | EEC | MHC protein complex assembly | 10/2168 | 19/18723 | 1.46e-05 | 2.87e-04 | 10 |
| GO:004312314 | Endometrium | EEC | positive regulation of I-kappaB kinase/NF-kappaB signaling | 42/2168 | 186/18723 | 1.47e-05 | 2.87e-04 | 42 |
| GO:000724915 | Endometrium | EEC | I-kappaB kinase/NF-kappaB signaling | 57/2168 | 281/18723 | 1.60e-05 | 3.12e-04 | 57 |
| Pathway ID | Tissue | Disease Stage | Description | Gene Ratio | Bg Ratio | pvalue | p.adjust | qvalue | Count |
| hsa0461218 | Breast | Precancer | Antigen processing and presentation | 19/684 | 78/8465 | 9.61e-06 | 1.12e-04 | 8.62e-05 | 19 |
| hsa0516918 | Breast | Precancer | Epstein-Barr virus infection | 35/684 | 202/8465 | 1.15e-05 | 1.26e-04 | 9.64e-05 | 35 |
| hsa0414518 | Breast | Precancer | Phagosome | 27/684 | 152/8465 | 7.37e-05 | 6.85e-04 | 5.25e-04 | 27 |
| hsa0532312 | Breast | Precancer | Rheumatoid arthritis | 19/684 | 93/8465 | 1.30e-04 | 1.14e-03 | 8.73e-04 | 19 |
| hsa0541618 | Breast | Precancer | Viral myocarditis | 14/684 | 60/8465 | 2.32e-04 | 1.98e-03 | 1.52e-03 | 14 |
| hsa0516618 | Breast | Precancer | Human T-cell leukemia virus 1 infection | 33/684 | 222/8465 | 4.29e-04 | 3.31e-03 | 2.53e-03 | 33 |
| hsa0461219 | Breast | Precancer | Antigen processing and presentation | 19/684 | 78/8465 | 9.61e-06 | 1.12e-04 | 8.62e-05 | 19 |
| hsa0516919 | Breast | Precancer | Epstein-Barr virus infection | 35/684 | 202/8465 | 1.15e-05 | 1.26e-04 | 9.64e-05 | 35 |
| hsa0414519 | Breast | Precancer | Phagosome | 27/684 | 152/8465 | 7.37e-05 | 6.85e-04 | 5.25e-04 | 27 |
| hsa0532313 | Breast | Precancer | Rheumatoid arthritis | 19/684 | 93/8465 | 1.30e-04 | 1.14e-03 | 8.73e-04 | 19 |
| hsa0541619 | Breast | Precancer | Viral myocarditis | 14/684 | 60/8465 | 2.32e-04 | 1.98e-03 | 1.52e-03 | 14 |
| hsa0516619 | Breast | Precancer | Human T-cell leukemia virus 1 infection | 33/684 | 222/8465 | 4.29e-04 | 3.31e-03 | 2.53e-03 | 33 |
| hsa0516922 | Breast | IDC | Epstein-Barr virus infection | 45/867 | 202/8465 | 3.16e-07 | 6.05e-06 | 4.52e-06 | 45 |
| hsa0461223 | Breast | IDC | Antigen processing and presentation | 24/867 | 78/8465 | 4.61e-07 | 8.33e-06 | 6.23e-06 | 24 |
| hsa0414522 | Breast | IDC | Phagosome | 34/867 | 152/8465 | 8.00e-06 | 9.99e-05 | 7.48e-05 | 34 |
| hsa0541623 | Breast | IDC | Viral myocarditis | 18/867 | 60/8465 | 1.85e-05 | 2.01e-04 | 1.50e-04 | 18 |
| hsa0516624 | Breast | IDC | Human T-cell leukemia virus 1 infection | 40/867 | 222/8465 | 2.52e-04 | 2.21e-03 | 1.66e-03 | 40 |
| hsa0532321 | Breast | IDC | Rheumatoid arthritis | 21/867 | 93/8465 | 3.69e-04 | 3.15e-03 | 2.36e-03 | 21 |
| hsa0494014 | Breast | IDC | Type I diabetes mellitus | 12/867 | 43/8465 | 9.40e-04 | 7.28e-03 | 5.44e-03 | 12 |
| hsa0533012 | Breast | IDC | Allograft rejection | 11/867 | 38/8465 | 1.09e-03 | 8.26e-03 | 6.18e-03 | 11 |
| Hugo Symbol | Variant Class | Variant Classification | dbSNP RS | HGVSc | HGVSp | HGVSp Short | SWISSPROT | BIOTYPE | SIFT | PolyPhen | Tumor Sample Barcode | Tissue | Histology | Sex | Age | Stage | Therapy Types | Drugs | Outcome |
| HLA-DRB1 | SNV | Missense_Mutation | rs754953589 | c.202C>T | p.Arg68Cys | p.R68C | P04229,Q9GIY3,P01911,Q29974 | protein_coding | deleterious(0) | probably_damaging(1) | TCGA-2W-A8YY-01 | Cervix | cervical & endocervical cancer | Female | <65 | I/II | Chemotherapy | cisplatin | CR |
| HLA-DRB1 | SNV | Missense_Mutation | rs761045049 | c.100C>T | p.Pro34Ser | p.P34S | P04229,Q9GIY3,P01911,Q29974 | protein_coding | tolerated(0.24) | benign(0) | TCGA-G5-6641-01 | Colorectum | rectum adenocarcinoma | Male | >=65 | III/IV | Chemotherapy | oxaliplatin | SD |
| HLA-DRB1 | SNV | Missense_Mutation | novel | c.330C>A | p.His110Gln | p.H110Q | P04229,Q9GIY3,P01911,Q29974 | protein_coding | deleterious(0.03) | possibly_damaging(0.735) | TCGA-AP-A054-01 | Endometrium | uterine corpus endometrioid carcinoma | Female | <65 | III/IV | Chemotherapy | carboplatin | PD |
| HLA-DRB1 | SNV | Missense_Mutation | novel | c.380A>T | p.Lys127Met | p.K127M | P04229,Q9GIY3,P01911,Q29974 | protein_coding | tolerated(0.11) | benign(0.376) | TCGA-DF-A2KS-01 | Endometrium | uterine corpus endometrioid carcinoma | Female | >=65 | I/II | Unknown | Unknown | PD |
| HLA-DRB1 | SNV | Missense_Mutation | novel | c.154N>T | p.Arg52Trp | p.R52W | P04229,Q9GIY3,P01911,Q29974 | protein_coding | deleterious(0.01) | probably_damaging(0.999) | TCGA-PG-A6IB-01 | Endometrium | uterine corpus endometrioid carcinoma | Female | >=65 | I/II | Unknown | Unknown | SD |
| HLA-DRB1 | SNV | Missense_Mutation | novel | c.460G>C | p.Gly154Arg | p.G154R | P04229,Q9GIY3,P01911,Q29974 | protein_coding | deleterious(0.03) | probably_damaging(0.986) | TCGA-34-2609-01 | Lung | lung squamous cell carcinoma | Male | >=65 | I/II | Chemotherapy | gemcitabine | PD |
| HLA-DRB1 | SNV | Missense_Mutation | | c.469G>A | p.Glu157Lys | p.E157K | P04229,Q9GIY3,P01911,Q29974 | protein_coding | tolerated(0.41) | probably_damaging(0.996) | TCGA-37-3789-01 | Lung | lung squamous cell carcinoma | Male | >=65 | I/II | Unknown | Unknown | SD |
| HLA-DRB1 | SNV | Missense_Mutation | rs17885257 | c.235N>T | p.Val79Leu | p.V79L | P04229,Q9GIY3,P01911,Q29974 | protein_coding | tolerated(0.2) | probably_damaging(0.974) | TCGA-63-6202-01 | Lung | lung squamous cell carcinoma | Male | Unknown | I/II | Unknown | Unknown | SD |
| HLA-DRB1 | insertion | Frame_Shift_Ins | novel | c.331_332insCA | p.Asn111ThrfsTer19 | p.N111Tfs*19 | P04229,Q9GIY3,P01911,Q29974 | protein_coding | | | TCGA-CN-A642-01 | Oral cavity | head & neck squamous cell carcinoma | Male | <65 | I/II | Unknown | Unknown | PD |
| Entrez ID | Symbol | Category | Interaction Types | Drug Claim Name | Drug Name | PMIDs |
| 3123 | HLA-DRB1 | EXTERNAL SIDE OF PLASMA MEMBRANE, CELL SURFACE, CLINICALLY ACTIONABLE, DRUGGABLE GENOME | | flupirtine | FLUPIRTINE | 26959717 |
| 3123 | HLA-DRB1 | EXTERNAL SIDE OF PLASMA MEMBRANE, CELL SURFACE, CLINICALLY ACTIONABLE, DRUGGABLE GENOME | | methimazole | METHIMAZOLE | |
| 3123 | HLA-DRB1 | EXTERNAL SIDE OF PLASMA MEMBRANE, CELL SURFACE, CLINICALLY ACTIONABLE, DRUGGABLE GENOME | | aspirin | ASPIRIN | 15784113,19392989 |
| 3123 | HLA-DRB1 | EXTERNAL SIDE OF PLASMA MEMBRANE, CELL SURFACE, CLINICALLY ACTIONABLE, DRUGGABLE GENOME | | fluvastatin | FLUVASTATIN | 27839692 |
| 3123 | HLA-DRB1 | EXTERNAL SIDE OF PLASMA MEMBRANE, CELL SURFACE, CLINICALLY ACTIONABLE, DRUGGABLE GENOME | | infliximab | INFLIXIMAB | |
| 3123 | HLA-DRB1 | EXTERNAL SIDE OF PLASMA MEMBRANE, CELL SURFACE, CLINICALLY ACTIONABLE, DRUGGABLE GENOME | | efavirenz | EFAVIRENZ | 18301070 |
| 3123 | HLA-DRB1 | EXTERNAL SIDE OF PLASMA MEMBRANE, CELL SURFACE, CLINICALLY ACTIONABLE, DRUGGABLE GENOME | | adalimumab | ADALIMUMAB | |
| 3123 | HLA-DRB1 | EXTERNAL SIDE OF PLASMA MEMBRANE, CELL SURFACE, CLINICALLY ACTIONABLE, DRUGGABLE GENOME | | propylthiouracil | PROPYLTHIOURACIL | |
| 3123 | HLA-DRB1 | EXTERNAL SIDE OF PLASMA MEMBRANE, CELL SURFACE, CLINICALLY ACTIONABLE, DRUGGABLE GENOME | | Influenza vaccines | | 11756990 |
| 3123 | HLA-DRB1 | EXTERNAL SIDE OF PLASMA MEMBRANE, CELL SURFACE, CLINICALLY ACTIONABLE, DRUGGABLE GENOME | | Tumor necrosis factor alpha (TNF-alpha) inhibitors | | |


