
|
|||||
|
 | |
| |
| |
| |
| |
| |
|
Gene: CD24 |
Gene summary for CD24 |
| Gene information | Species | Human | Gene symbol | CD24 | Gene ID | 100133941 |
| Gene name | CD24 molecule | |
| Gene Alias | CD24A | |
| Cytomap | 6q21 | |
| Gene Type | protein-coding | GO ID | GO:0000165 | UniProtAcc | B6EC88 |
Top |
Malignant transformation analysis |
| Identification of the aberrant gene expression in precancerous and cancerous lesions by comparing the gene expression of stem-like cells in diseased tissues with normal stem cells |
| Entrez ID | Symbol | Replicates | Species | Organ | Tissue | Adj P-value | Log2FC | Malignancy |
| 100133941 | CD24 | GSM4909280 | Human | Breast | Precancer | 4.31e-02 | -5.83e-01 | 0.0305 |
| 100133941 | CD24 | GSM4909281 | Human | Breast | IDC | 3.58e-56 | 6.40e-01 | 0.21 |
| 100133941 | CD24 | GSM4909285 | Human | Breast | IDC | 1.95e-05 | -3.40e-02 | 0.21 |
| 100133941 | CD24 | GSM4909286 | Human | Breast | IDC | 6.84e-11 | -2.25e-01 | 0.1081 |
| 100133941 | CD24 | GSM4909287 | Human | Breast | IDC | 5.21e-05 | 1.87e-01 | 0.2057 |
| 100133941 | CD24 | GSM4909289 | Human | Breast | IDC | 2.49e-30 | 8.22e-01 | 0.1064 |
| 100133941 | CD24 | GSM4909290 | Human | Breast | IDC | 4.63e-03 | 2.74e-01 | 0.2096 |
| 100133941 | CD24 | GSM4909293 | Human | Breast | IDC | 4.52e-25 | 4.63e-01 | 0.1581 |
| 100133941 | CD24 | GSM4909295 | Human | Breast | IDC | 9.58e-36 | 7.00e-01 | 0.0898 |
| 100133941 | CD24 | GSM4909296 | Human | Breast | IDC | 4.35e-11 | -4.51e-01 | 0.1524 |
| 100133941 | CD24 | GSM4909297 | Human | Breast | IDC | 8.12e-11 | -5.14e-03 | 0.1517 |
| 100133941 | CD24 | GSM4909298 | Human | Breast | IDC | 9.32e-23 | 4.56e-01 | 0.1551 |
| 100133941 | CD24 | GSM4909302 | Human | Breast | IDC | 8.68e-14 | -5.61e-01 | 0.1545 |
| 100133941 | CD24 | GSM4909304 | Human | Breast | IDC | 1.83e-44 | -9.02e-01 | 0.1636 |
| 100133941 | CD24 | GSM4909305 | Human | Breast | IDC | 6.80e-03 | 2.59e-01 | 0.0436 |
| 100133941 | CD24 | GSM4909306 | Human | Breast | IDC | 3.12e-23 | 4.52e-01 | 0.1564 |
| 100133941 | CD24 | GSM4909308 | Human | Breast | IDC | 1.16e-05 | -3.30e-01 | 0.158 |
| 100133941 | CD24 | GSM4909309 | Human | Breast | IDC | 1.47e-06 | -4.21e-01 | 0.0483 |
| 100133941 | CD24 | GSM4909311 | Human | Breast | IDC | 6.22e-27 | -7.57e-02 | 0.1534 |
| 100133941 | CD24 | GSM4909315 | Human | Breast | IDC | 1.37e-171 | 1.08e+00 | 0.21 |
| Page: 1 2 3 4 5 6 7 8 9 10 11 12 13 14 15 16 17 |
| Tissue | Expression Dynamics | Abbreviation |
| Breast |  | IDC: Invasive ductal carcinoma |
| DCIS: Ductal carcinoma in situ | ||
| Precancer(BRCA1-mut): Precancerous lesion from BRCA1 mutation carriers | ||
| Cervix |  | CC: Cervix cancer |
| HSIL_HPV: HPV-infected high-grade squamous intraepithelial lesions | ||
| N_HPV: HPV-infected normal cervix | ||
| Colorectum (GSE201348) |  | FAP: Familial adenomatous polyposis |
| CRC: Colorectal cancer | ||
| Colorectum (HTA11) |  | AD: Adenomas |
| SER: Sessile serrated lesions | ||
| MSI-H: Microsatellite-high colorectal cancer | ||
| MSS: Microsatellite stable colorectal cancer | ||
| Endometrium | 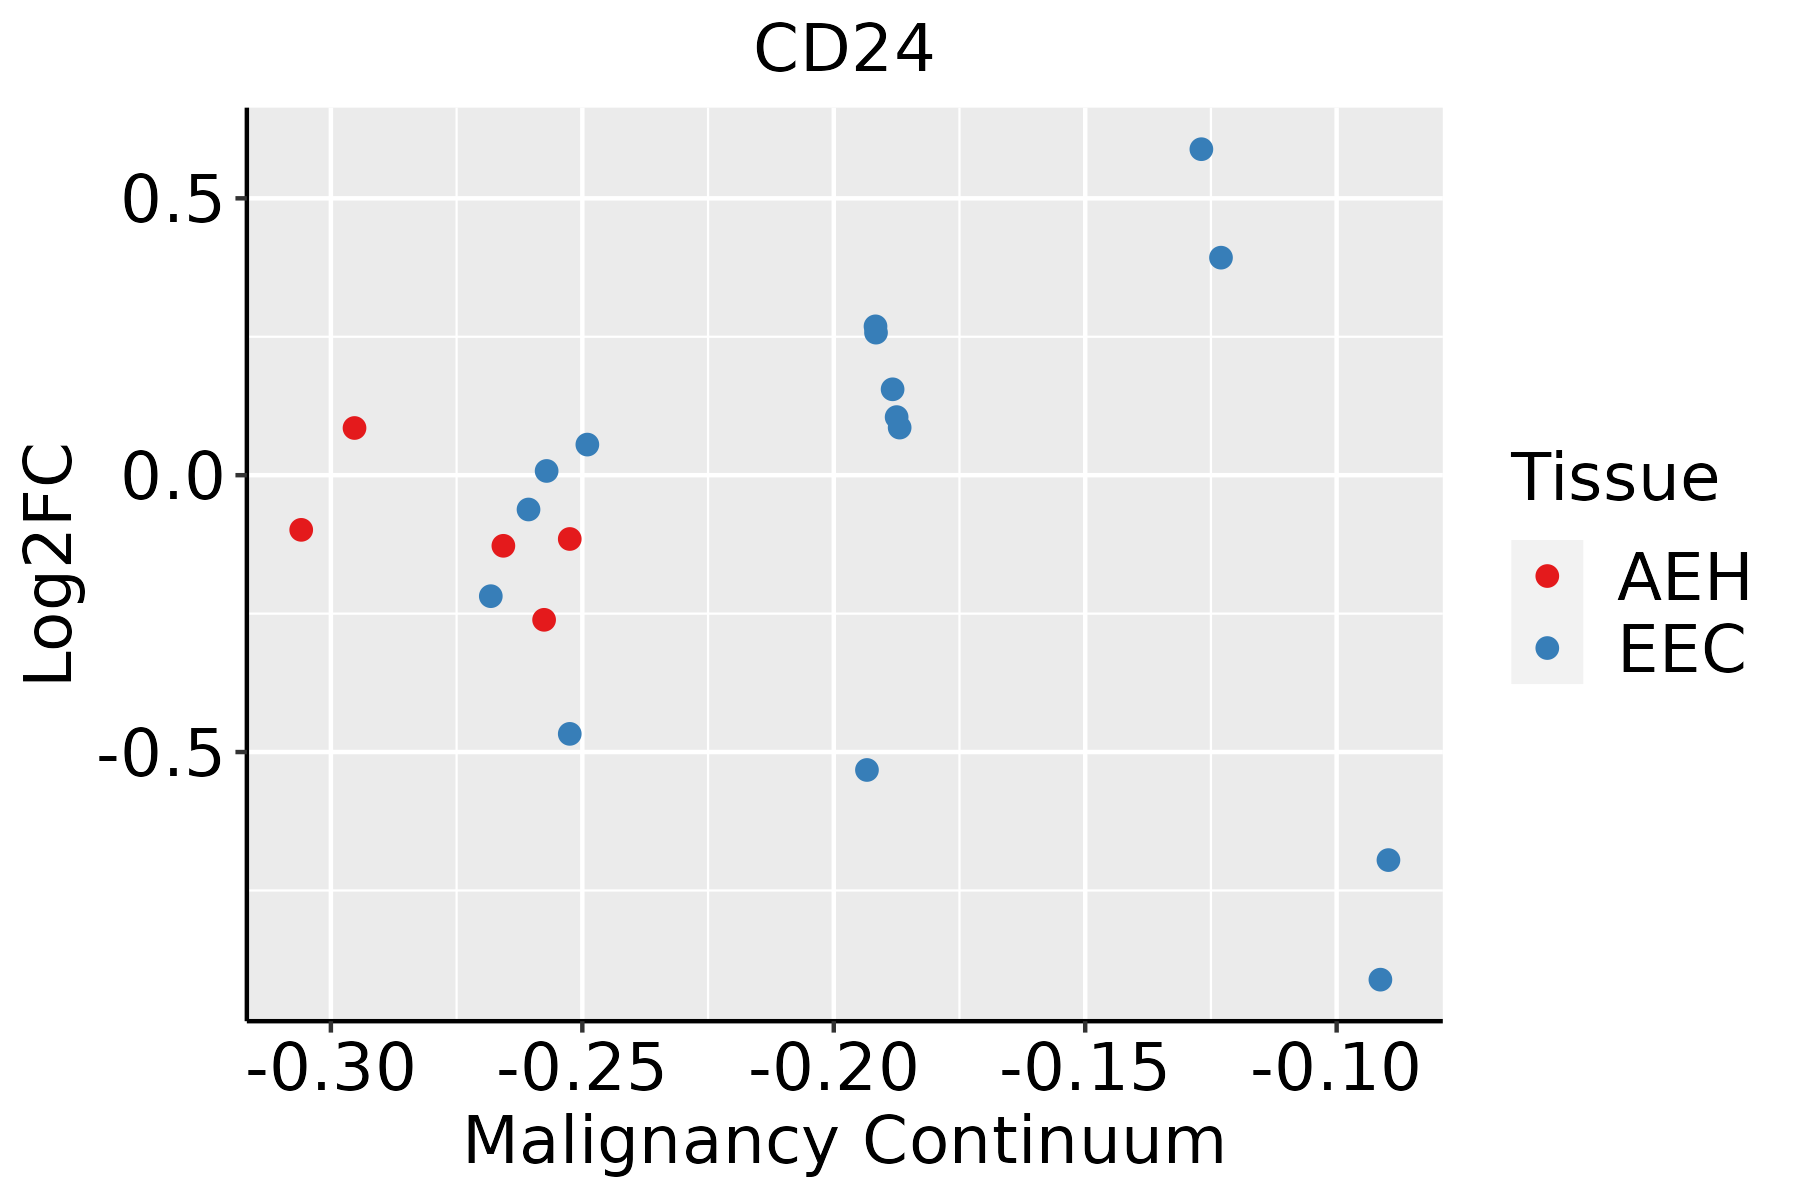 | AEH: Atypical endometrial hyperplasia |
| EEC: Endometrioid Cancer | ||
| Esophagus | 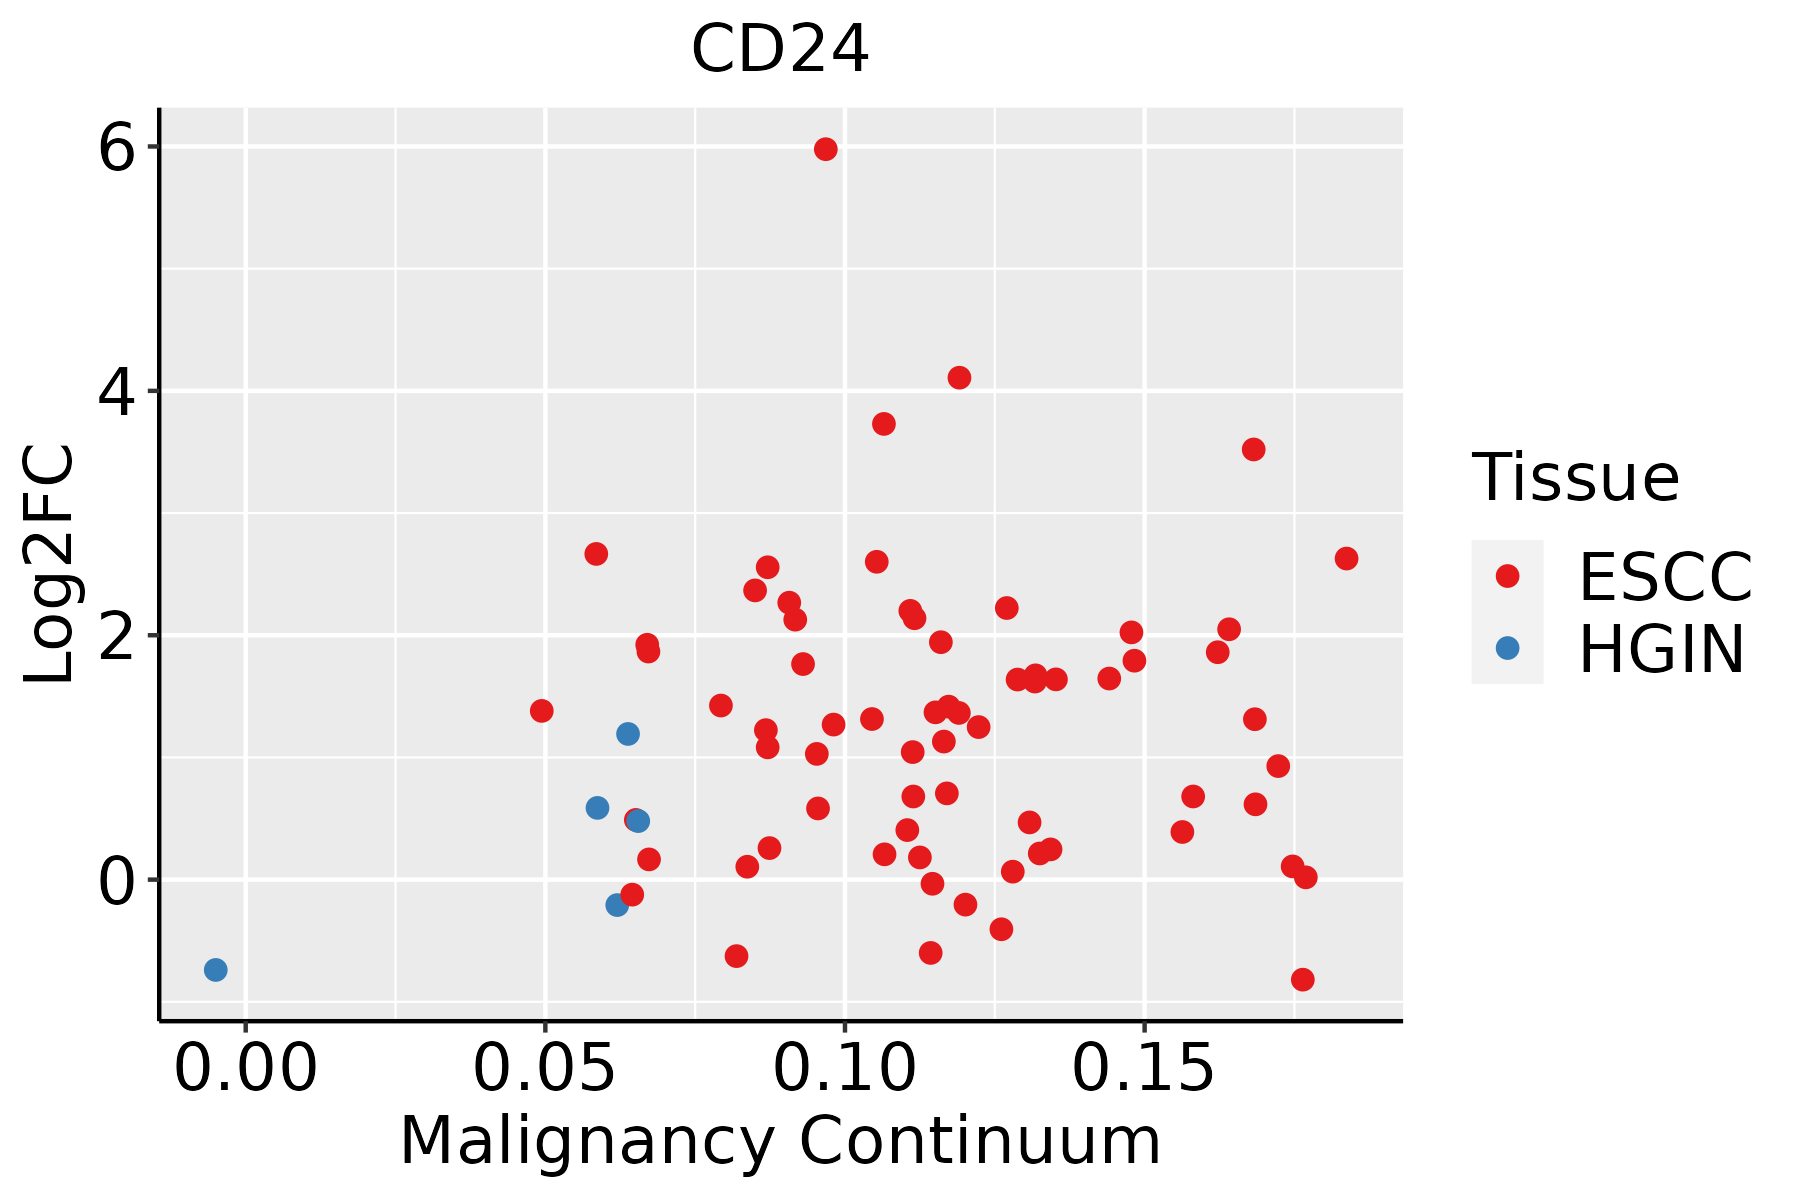 | ESCC: Esophageal squamous cell carcinoma |
| HGIN: High-grade intraepithelial neoplasias | ||
| LGIN: Low-grade intraepithelial neoplasias | ||
| GC | 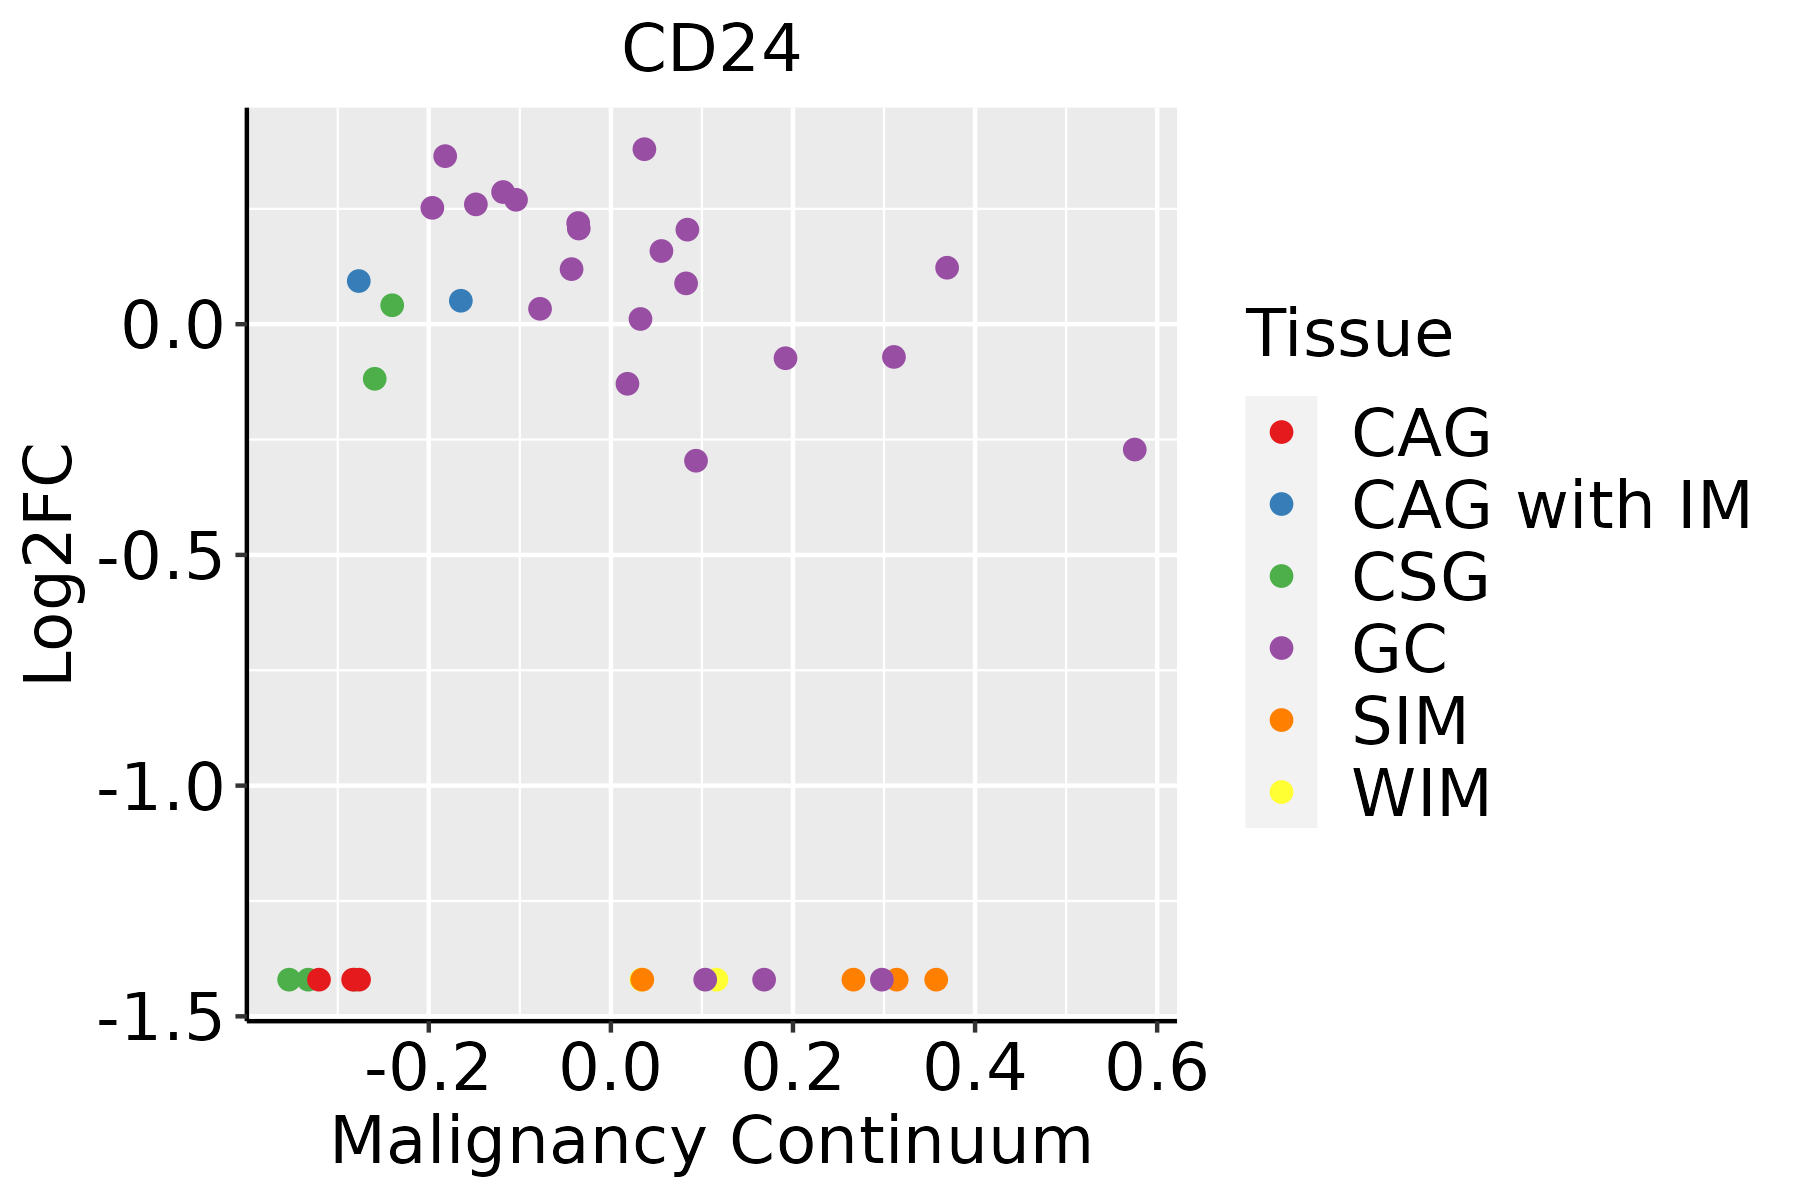 | CAG: Chronic atrophic gastritis |
| CAG with IM: Chronic atrophic gastritis with intestinal metaplasia | ||
| CSG: Chronic superficial gastritis | ||
| GC: Gastric cancer | ||
| SIM: Severe intestinal metaplasia | ||
| WIM: Wild intestinal metaplasia | ||
| Liver |  | HCC: Hepatocellular carcinoma |
| NAFLD: Non-alcoholic fatty liver disease | ||
| Lung | 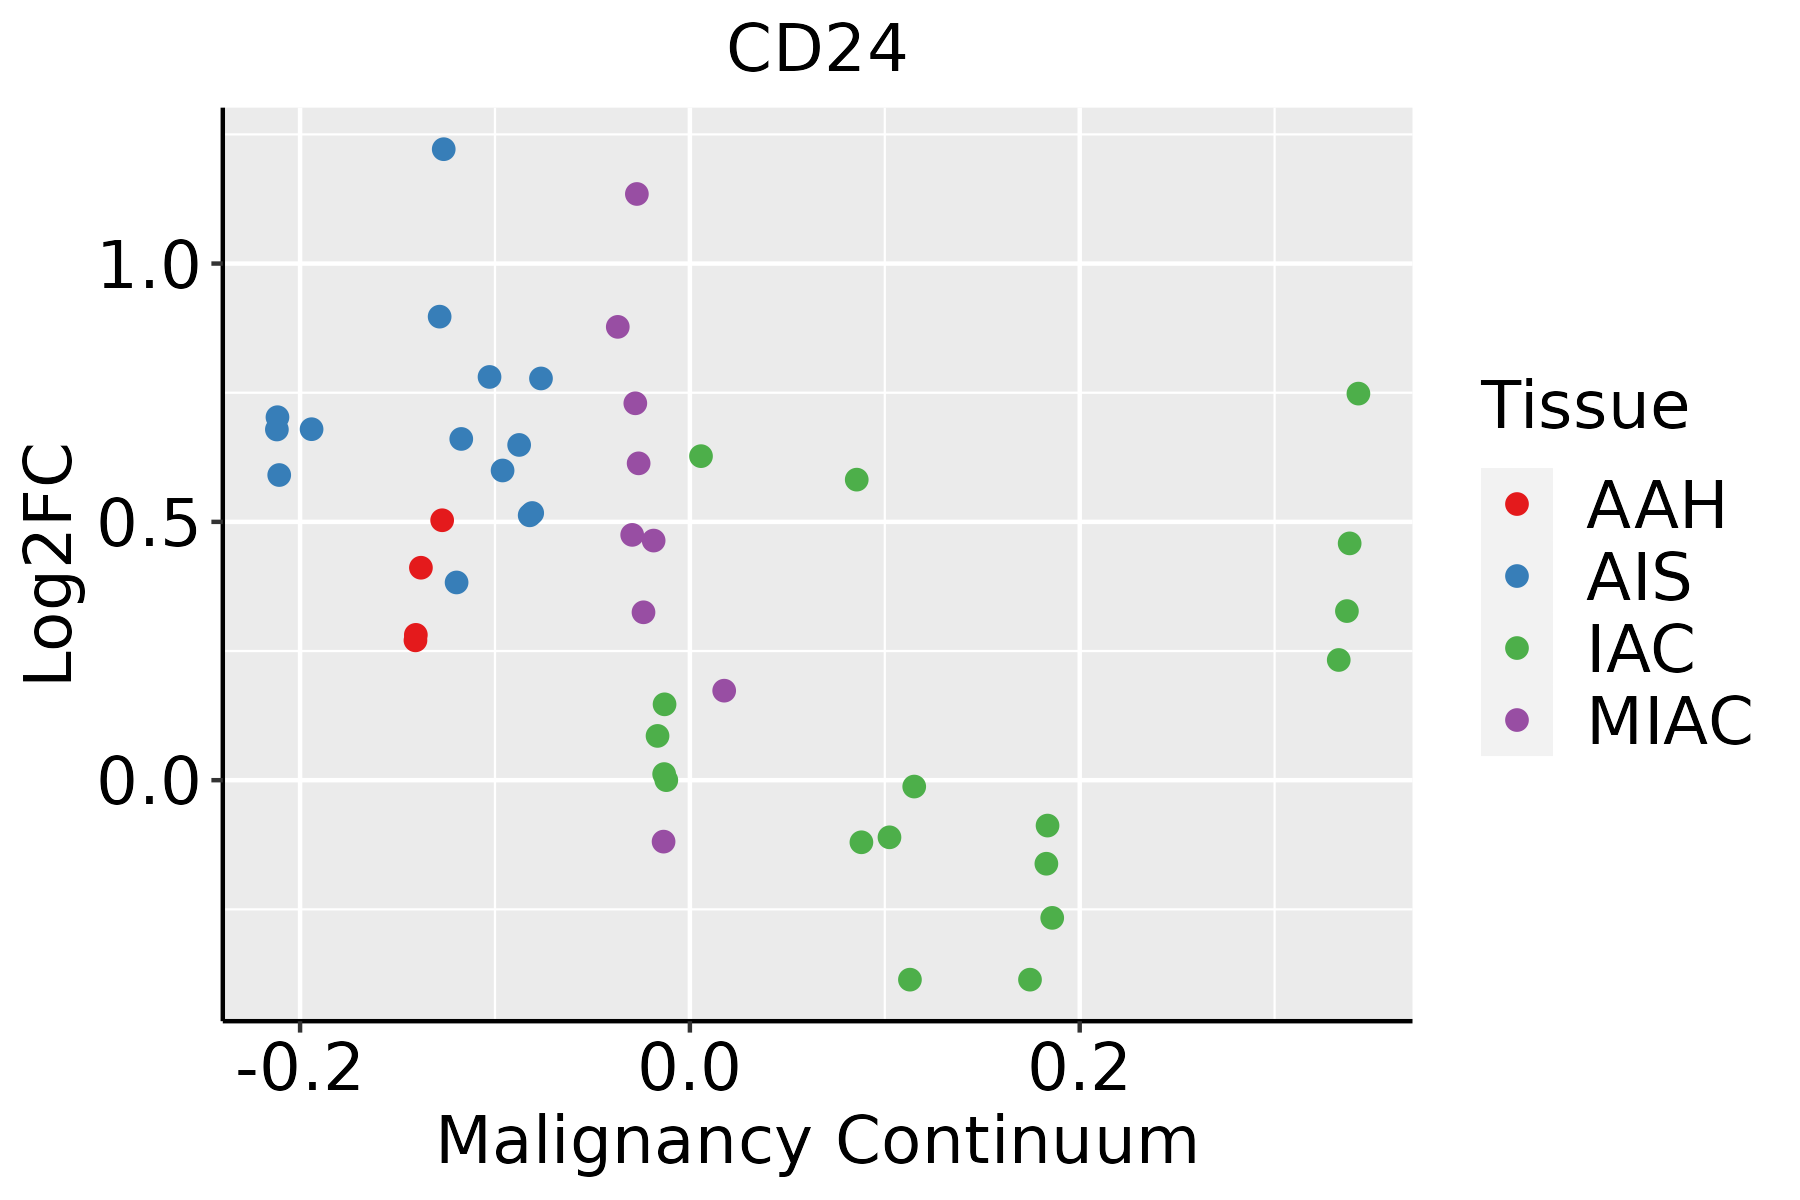 | AAH: Atypical adenomatous hyperplasia |
| AIS: Adenocarcinoma in situ | ||
| IAC: Invasive lung adenocarcinoma | ||
| MIA: Minimally invasive adenocarcinoma | ||
| Oral Cavity |  | EOLP: Erosive Oral lichen planus |
| LP: leukoplakia | ||
| NEOLP: Non-erosive oral lichen planus | ||
| OSCC: Oral squamous cell carcinoma | ||
| Prostate | 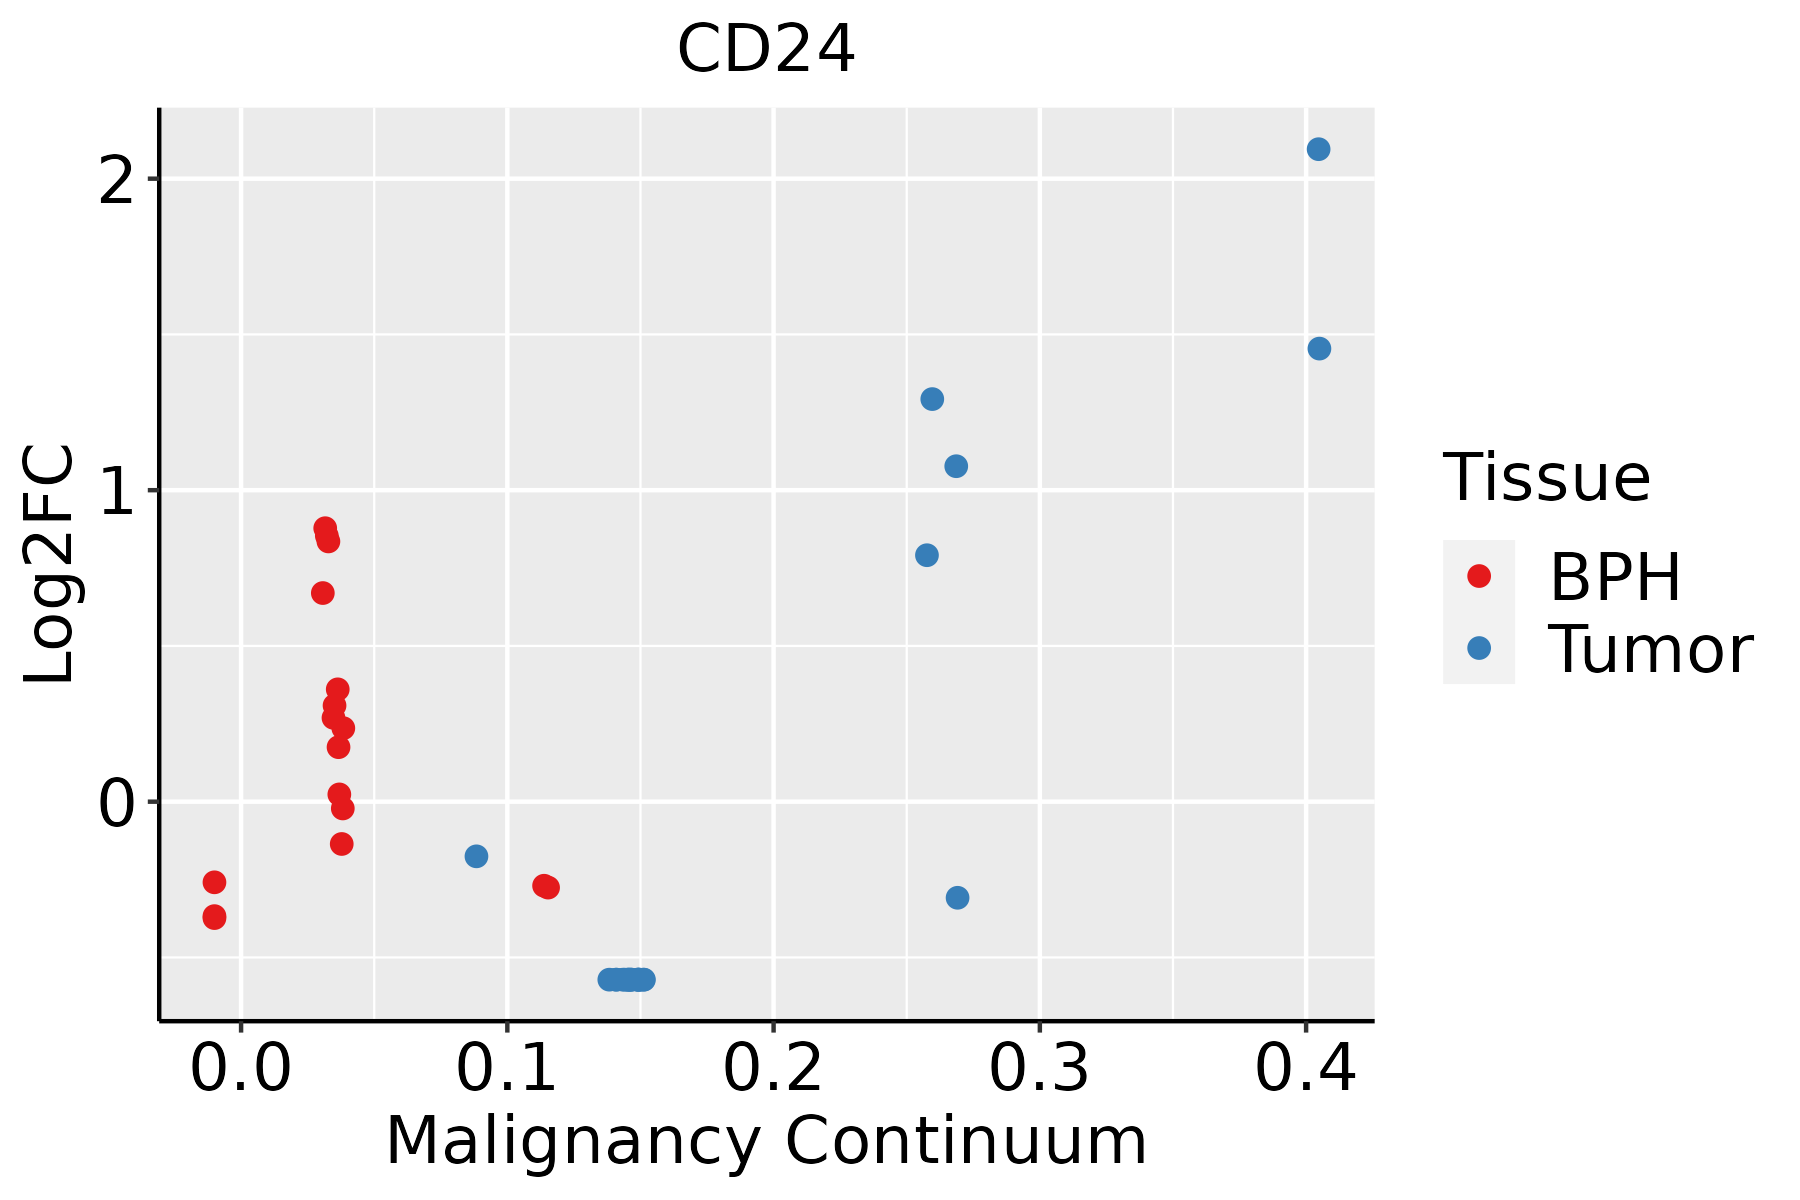 | BPH: Benign Prostatic Hyperplasia |
| Thyroid |  | ATC: Anaplastic thyroid cancer |
| HT: Hashimoto's thyroiditis | ||
| PTC: Papillary thyroid cancer |
| ∗log2FC in expression of this searched gene in stem-like cells from each diseased tissue sample relative to stem-like cells in normal samples in each tissue plotted against the malignancy continuum. Samples are colored based on if they are from different disease stage. |
Top |
Malignant transformation related pathway analysis |
| Find out the enriched GO biological processes and KEGG pathways involved in transition from healthy to precancer to cancer |
| Tissue | Disease Stage | Enriched GO biological Processes |
| Colorectum | AD |  |
| Colorectum | SER |  |
| Colorectum | MSS |  |
| Colorectum | MSI-H |  |
| Colorectum | FAP |  |
| ∗Top 15 enriched GO BP terms are showed in the bar plot of each disease state in each tissue. Each row represents a significant GO biological process which is colored according to the -log10(p.adjust). |
| Page: 1 2 3 4 5 6 7 8 9 |
| GO ID | Tissue | Disease Stage | Description | Gene Ratio | Bg Ratio | pvalue | p.adjust | Count |
| GO:00421103 | Stomach | CAG | T cell activation | 27/552 | 487/18723 | 1.34e-03 | 1.74e-02 | 27 |
| GO:00508673 | Stomach | CAG | positive regulation of cell activation | 24/552 | 420/18723 | 1.64e-03 | 1.94e-02 | 24 |
| GO:00901506 | Stomach | CAG | establishment of protein localization to membrane | 17/552 | 260/18723 | 1.91e-03 | 2.19e-02 | 17 |
| GO:00466513 | Stomach | CAG | lymphocyte proliferation | 18/552 | 288/18723 | 2.34e-03 | 2.55e-02 | 18 |
| GO:00420983 | Stomach | CAG | T cell proliferation | 14/552 | 199/18723 | 2.39e-03 | 2.61e-02 | 14 |
| GO:0050671 | Stomach | CAG | positive regulation of lymphocyte proliferation | 11/552 | 137/18723 | 2.47e-03 | 2.62e-02 | 11 |
| GO:00512513 | Stomach | CAG | positive regulation of lymphocyte activation | 21/552 | 362/18723 | 2.61e-03 | 2.71e-02 | 21 |
| GO:00329432 | Stomach | CAG | mononuclear cell proliferation | 18/552 | 291/18723 | 2.61e-03 | 2.71e-02 | 18 |
| GO:0032946 | Stomach | CAG | positive regulation of mononuclear cell proliferation | 11/552 | 138/18723 | 2.62e-03 | 2.71e-02 | 11 |
| GO:00506702 | Stomach | CAG | regulation of lymphocyte proliferation | 15/552 | 225/18723 | 2.86e-03 | 2.92e-02 | 15 |
| GO:00329441 | Stomach | CAG | regulation of mononuclear cell proliferation | 15/552 | 227/18723 | 3.11e-03 | 3.05e-02 | 15 |
| GO:0019221 | Stomach | CAG | cytokine-mediated signaling pathway | 25/552 | 472/18723 | 3.63e-03 | 3.38e-02 | 25 |
| GO:00457303 | Stomach | CAG | respiratory burst | 5/552 | 37/18723 | 4.37e-03 | 3.92e-02 | 5 |
| GO:00421293 | Stomach | CAG | regulation of T cell proliferation | 12/552 | 171/18723 | 4.85e-03 | 4.22e-02 | 12 |
| GO:00706653 | Stomach | CAG | positive regulation of leukocyte proliferation | 11/552 | 150/18723 | 4.95e-03 | 4.25e-02 | 11 |
| GO:00336746 | Stomach | CAG | positive regulation of kinase activity | 24/552 | 467/18723 | 6.24e-03 | 4.93e-02 | 24 |
| GO:009719341 | Stomach | WIM | intrinsic apoptotic signaling pathway | 25/426 | 288/18723 | 1.16e-08 | 1.70e-06 | 25 |
| GO:00022374 | Stomach | WIM | response to molecule of bacterial origin | 25/426 | 363/18723 | 9.89e-07 | 7.03e-05 | 25 |
| GO:00362934 | Stomach | WIM | response to decreased oxygen levels | 23/426 | 322/18723 | 1.45e-06 | 9.57e-05 | 23 |
| GO:007048241 | Stomach | WIM | response to oxygen levels | 23/426 | 347/18723 | 5.09e-06 | 2.62e-04 | 23 |
| Page: 1 2 3 4 5 6 7 8 9 10 11 12 13 14 15 16 17 18 19 20 21 22 23 24 25 26 27 28 29 30 31 32 33 34 35 36 37 38 39 40 41 42 43 44 45 46 47 48 49 50 51 52 53 54 55 56 |
| Pathway ID | Tissue | Disease Stage | Description | Gene Ratio | Bg Ratio | pvalue | p.adjust | qvalue | Count |
| Page: 1 |
Top |
Cell-cell communication analysis |
| Identification of potential cell-cell interactions between two cell types and their ligand-receptor pairs for different disease states |
| Ligand | Receptor | LRpair | Pathway | Tissue | Disease Stage |
| CD48 | CD244 | CD48_CD244A | CD48 | CRC | AD |
| CD48 | CD244 | CD48_CD244A | CD48 | CRC | MSI-H |
| CD48 | CD244 | CD48_CD244A | CD48 | CRC | SER |
| Page: 1 |
Top |
Single-cell gene regulatory network inference analysis |
| Find out the significant the regulons (TFs) and the target genes of each regulon across cell types for different disease states |
| TF | Cell Type | Tissue | Disease Stage | Target Gene | RSS | Regulon Activity |
| ∗The dot plots of a searched regulon are shown for all cell subpopulations in each disease state of each tissue based on the regulon specific score inferred using pySCENIC and by calculating the average expression. |
| Page: 1 |
Top |
Somatic mutation of malignant transformation related genes |
| Annotation of somatic variants for genes involved in malignant transformation |
| Hugo Symbol | Variant Class | Variant Classification | dbSNP RS | HGVSc | HGVSp | HGVSp Short | SWISSPROT | BIOTYPE | SIFT | PolyPhen | Tumor Sample Barcode | Tissue | Histology | Sex | Age | Stage | Therapy Types | Drugs | Outcome |
| CD24 | SNV | Missense_Mutation | novel | c.340N>C | p.Thr114Pro | p.T114P | protein_coding | deleterious_low_confidence(0.02) | probably_damaging(0.952) | TCGA-AO-A03V-01 | Breast | breast invasive carcinoma | Female | <65 | I/II | Chemotherapy | fluorouracil | SD | |
| CD24 | SNV | Missense_Mutation | novel | c.340A>C | p.Thr114Pro | p.T114P | protein_coding | deleterious_low_confidence(0.02) | probably_damaging(0.952) | TCGA-BH-A0BS-01 | Breast | breast invasive carcinoma | Female | <65 | III/IV | Chemotherapy | adriamycin | CR | |
| CD24 | SNV | Missense_Mutation | novel | c.340A>C | p.Thr114Pro | p.T114P | protein_coding | deleterious_low_confidence(0.02) | probably_damaging(0.952) | TCGA-BH-A0HO-01 | Breast | breast invasive carcinoma | Female | <65 | I/II | Chemotherapy | cyclophosphamide | SD | |
| CD24 | SNV | Missense_Mutation | novel | c.368C>A | p.Ser123Tyr | p.S123Y | protein_coding | deleterious_low_confidence(0) | possibly_damaging(0.873) | TCGA-AX-A2HC-01 | Endometrium | uterine corpus endometrioid carcinoma | Female | <65 | III/IV | Chemotherapy | paclitaxel | PD | |
| CD24 | SNV | Missense_Mutation | novel | c.340N>C | p.Thr114Pro | p.T114P | protein_coding | deleterious_low_confidence(0.02) | probably_damaging(0.952) | TCGA-D1-A15W-01 | Endometrium | uterine corpus endometrioid carcinoma | Female | <65 | III/IV | Chemotherapy | taxol | SD |
| Page: 1 |
Top |
Related drugs of malignant transformation related genes |
| Identification of chemicals and drugs interact with genes involved in malignant transfromation |
| (DGIdb 4.0) |
| Entrez ID | Symbol | Category | Interaction Types | Drug Claim Name | Drug Name | PMIDs |
| Page: 1 |

Copyright 2023-Present -The University of Texas Health Science Center at Houston |