| Tissue | Expression Dynamics | Abbreviation |
| Breast | 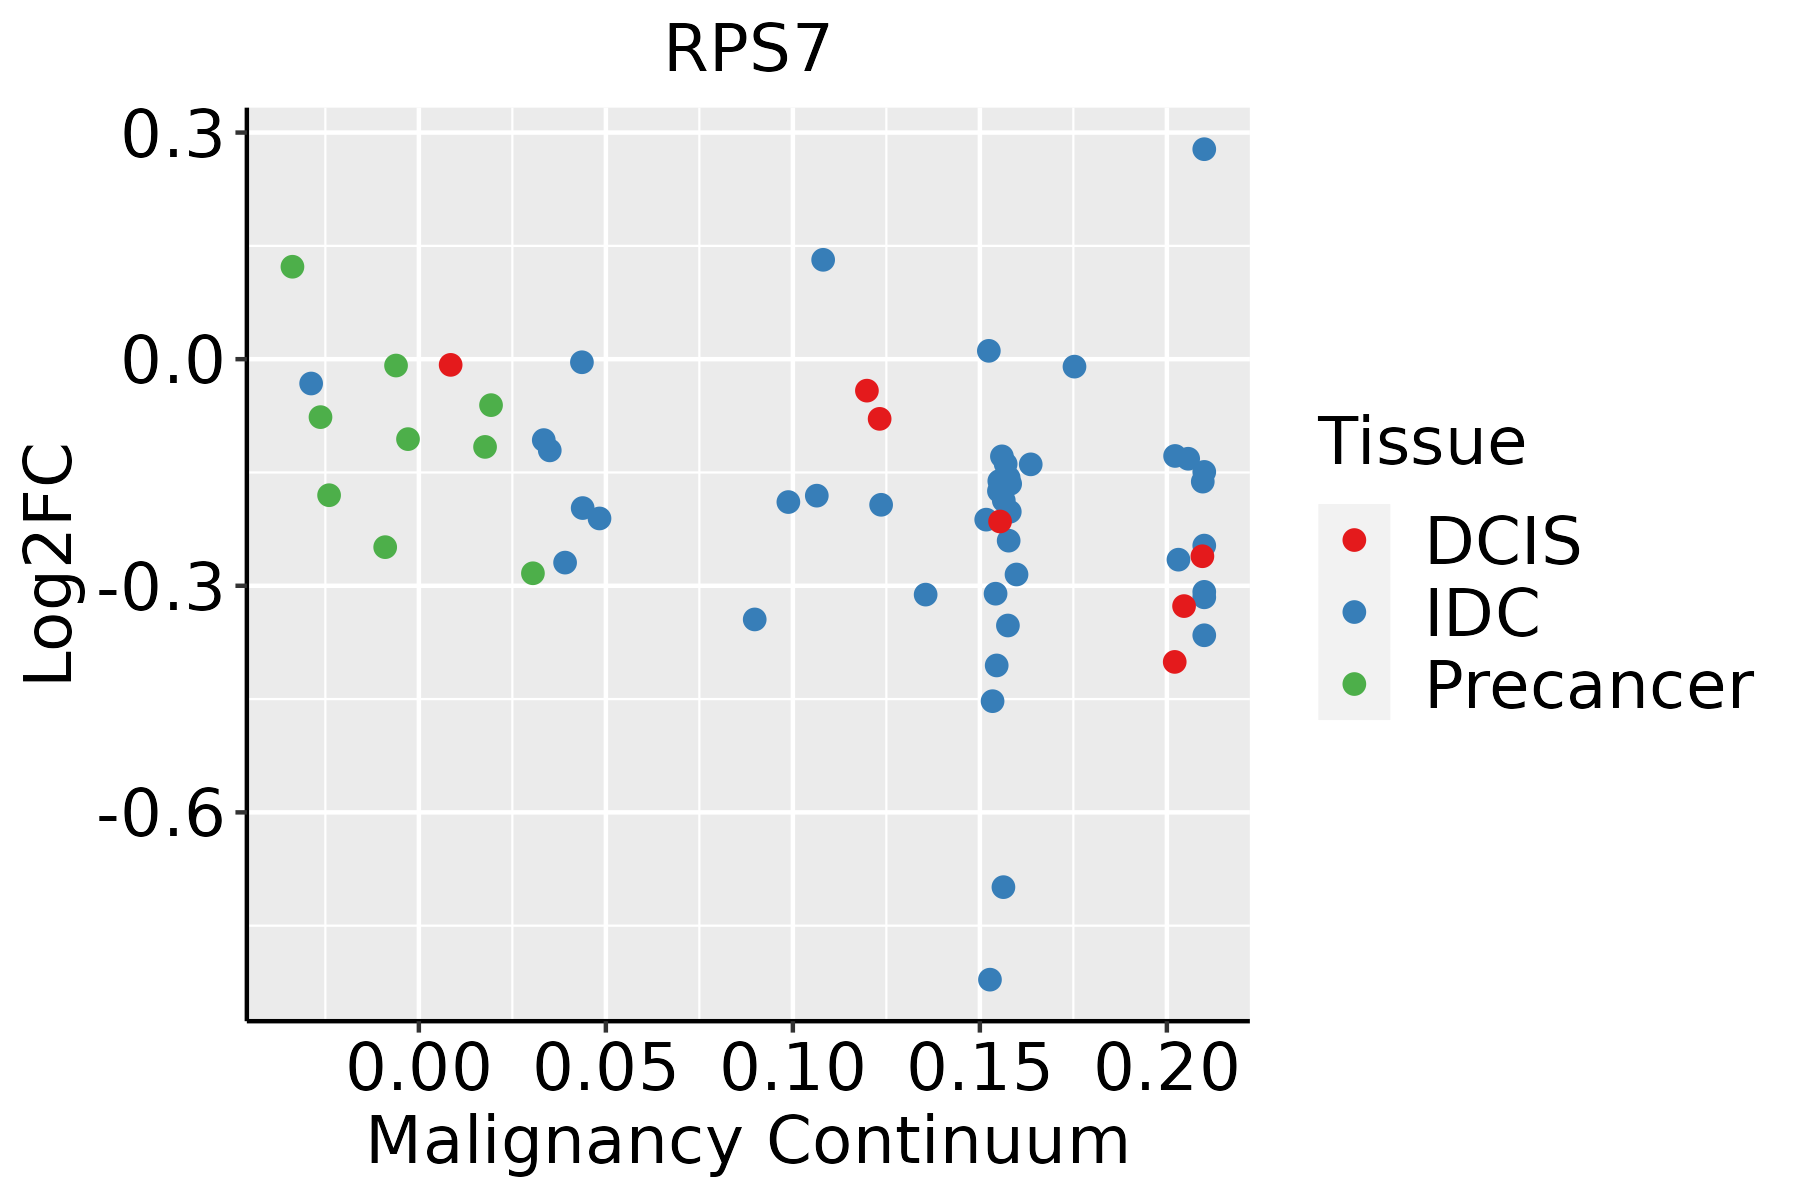 | IDC: Invasive ductal carcinoma |
| DCIS: Ductal carcinoma in situ |
| Precancer(BRCA1-mut): Precancerous lesion from BRCA1 mutation carriers |
| Cervix | 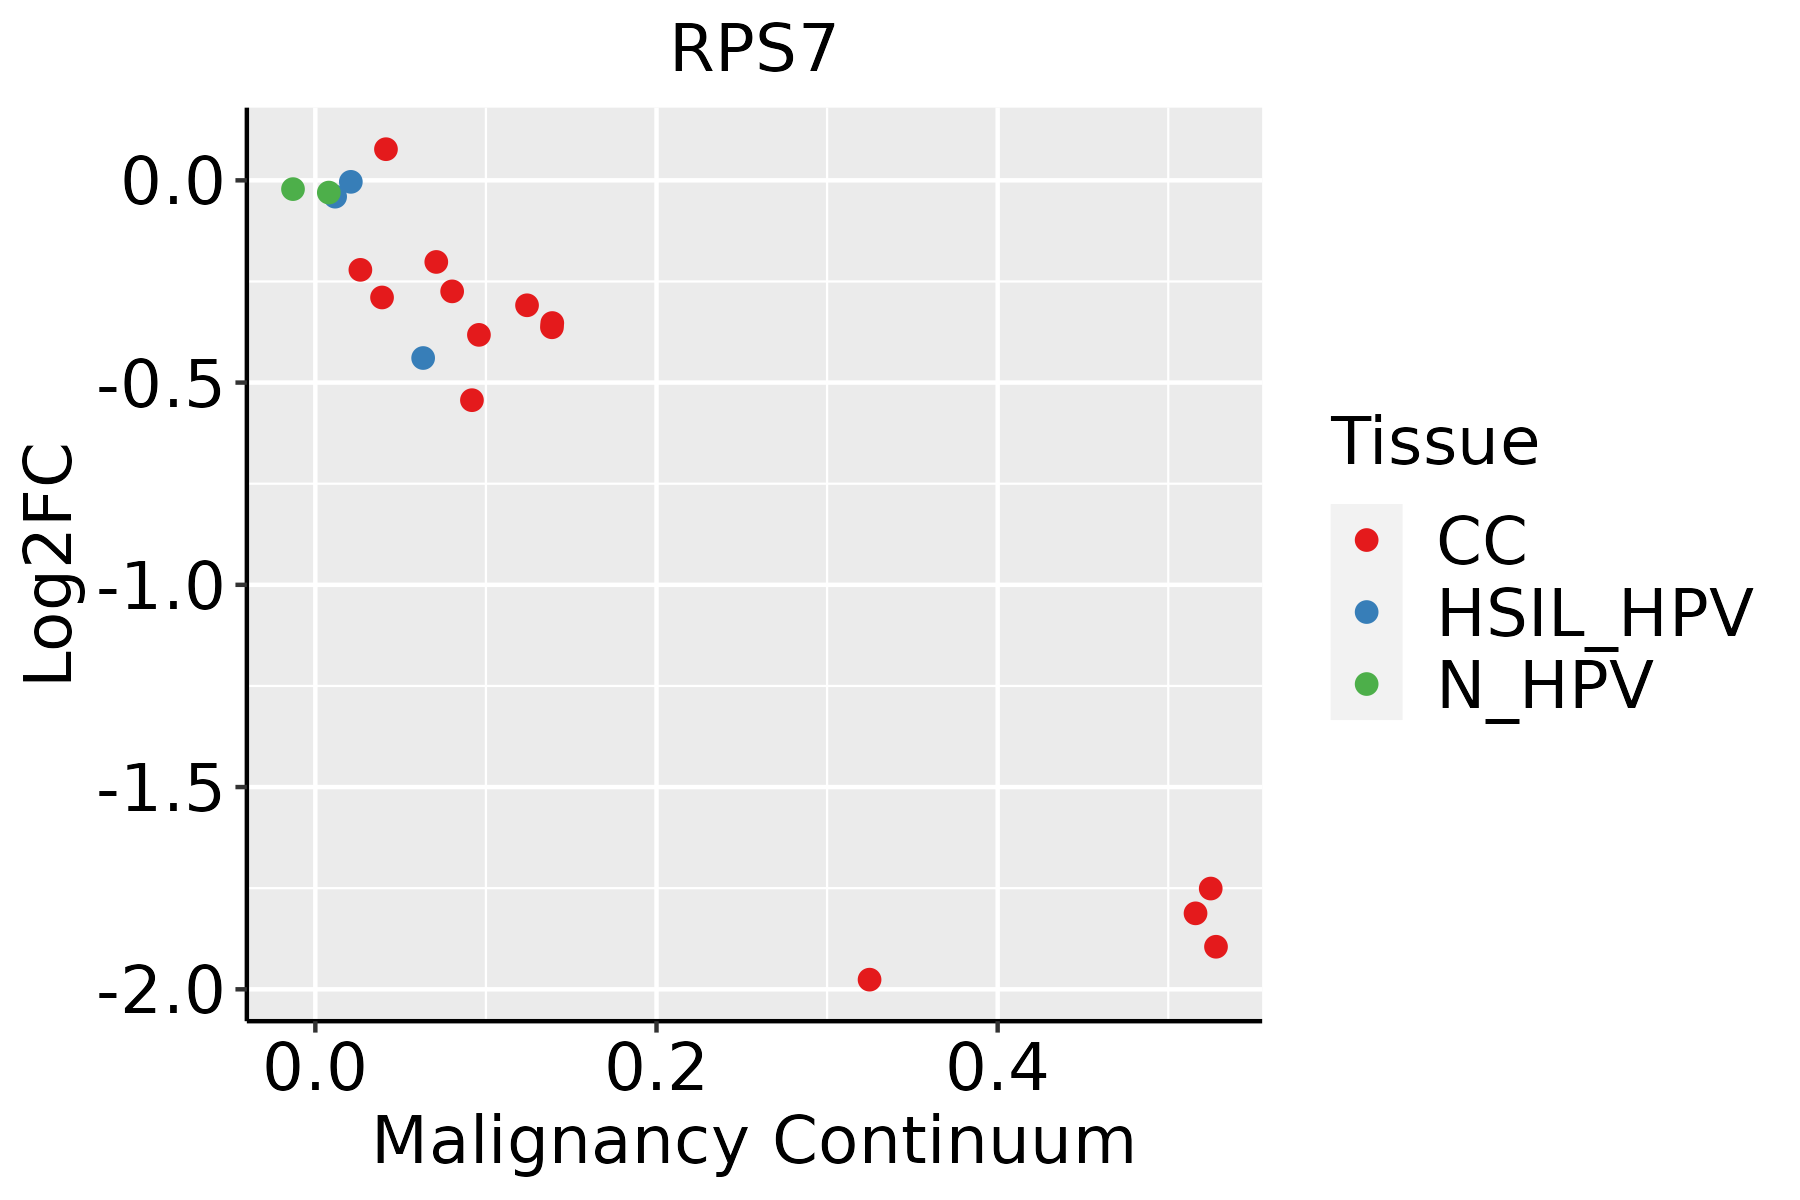 | CC: Cervix cancer |
| HSIL_HPV: HPV-infected high-grade squamous intraepithelial lesions |
| N_HPV: HPV-infected normal cervix |
| Colorectum (GSE201348) |  | FAP: Familial adenomatous polyposis |
| CRC: Colorectal cancer |
| Colorectum (HTA11) |  | AD: Adenomas |
| SER: Sessile serrated lesions |
| MSI-H: Microsatellite-high colorectal cancer |
| MSS: Microsatellite stable colorectal cancer |
| Endometrium | 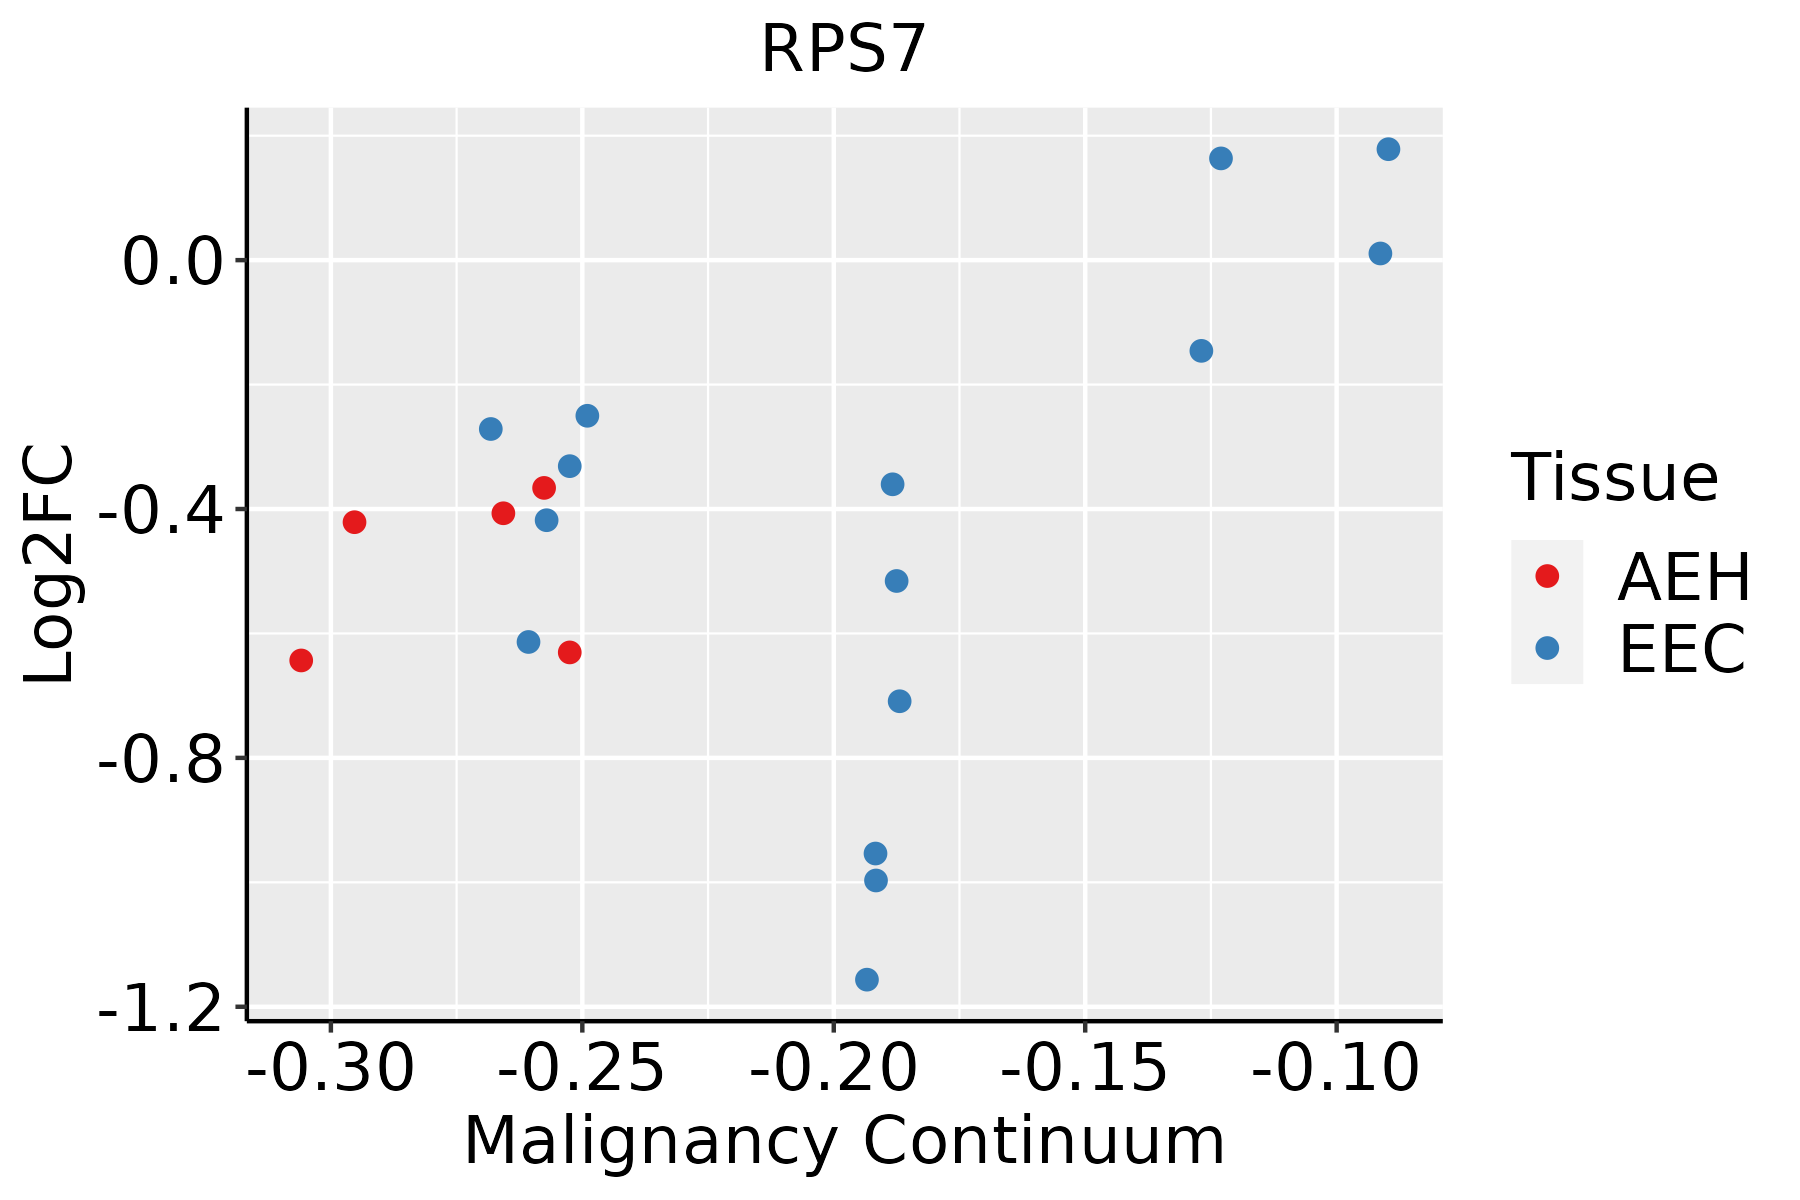 | AEH: Atypical endometrial hyperplasia |
| EEC: Endometrioid Cancer |
| Esophagus | 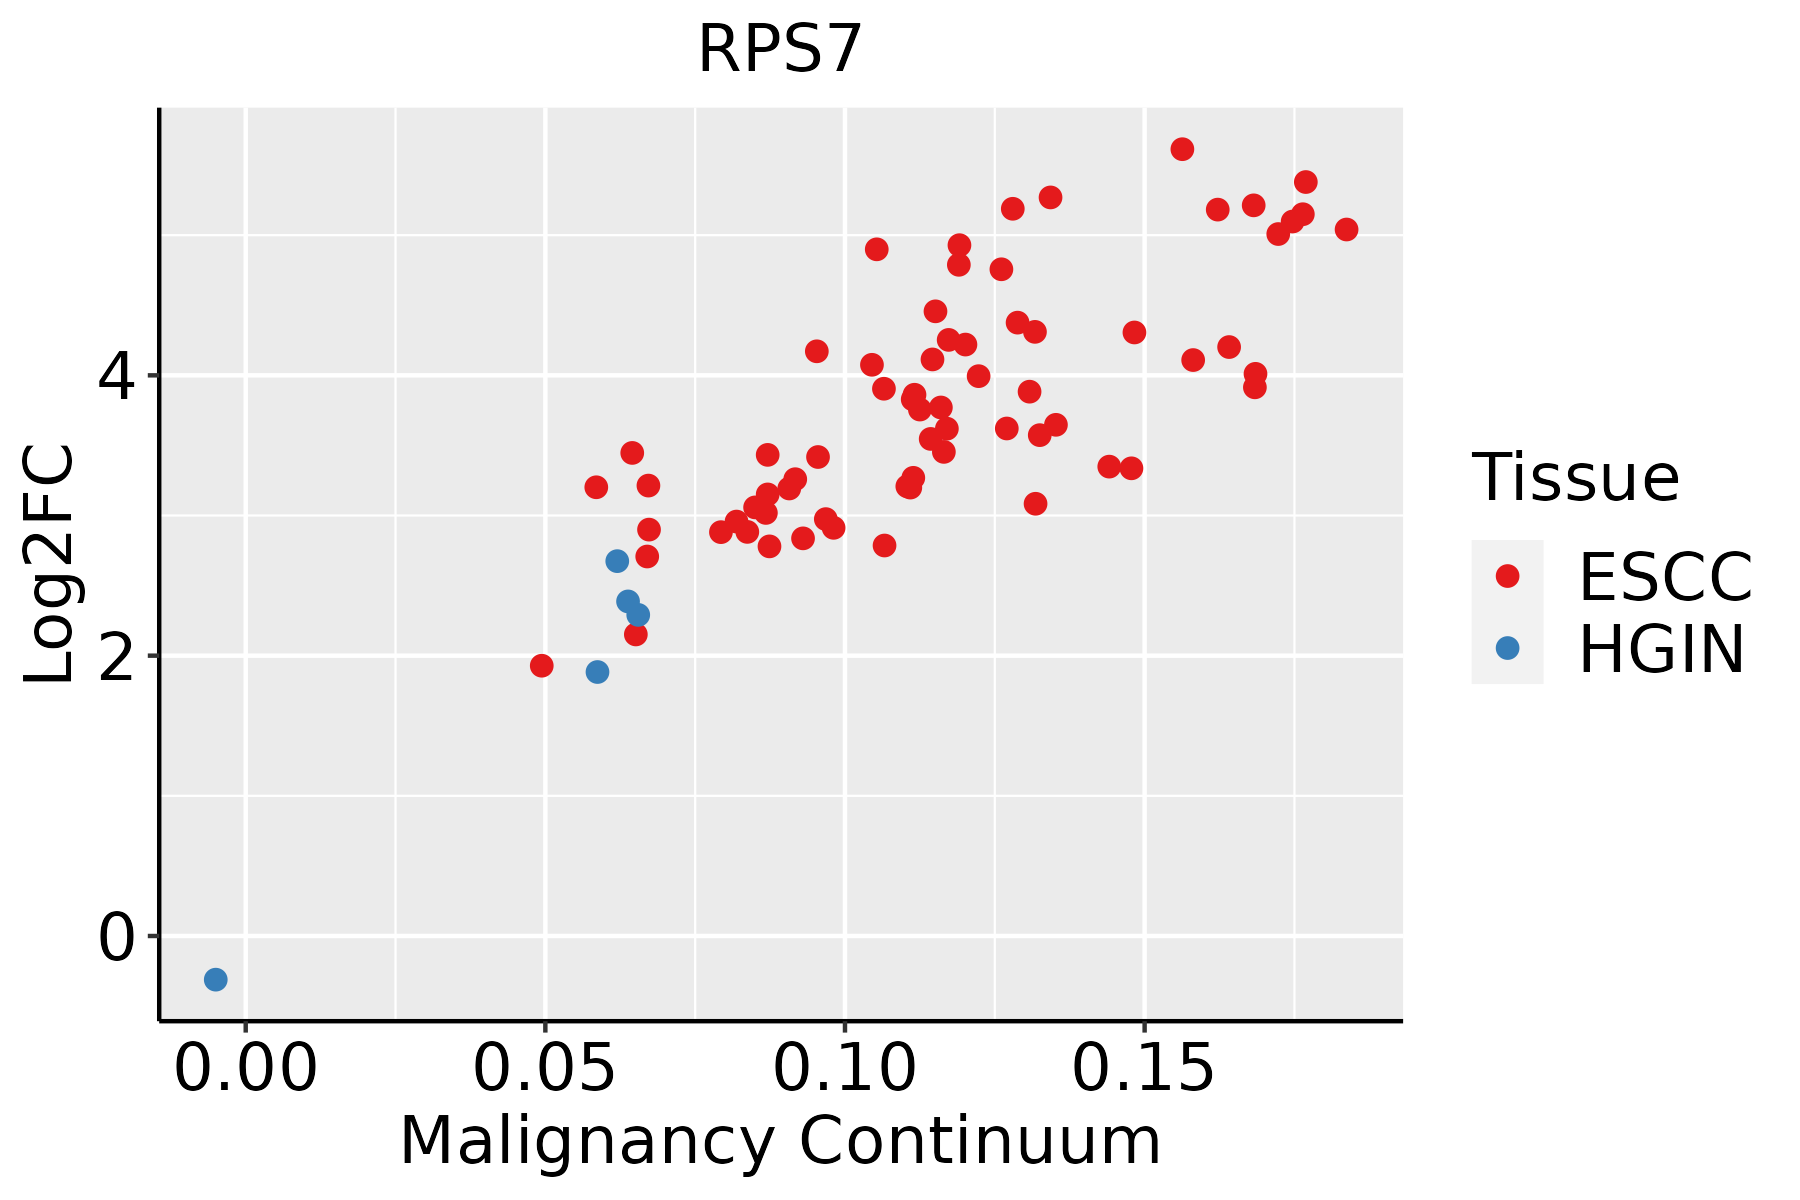 | ESCC: Esophageal squamous cell carcinoma |
| HGIN: High-grade intraepithelial neoplasias |
| LGIN: Low-grade intraepithelial neoplasias |
| Liver | 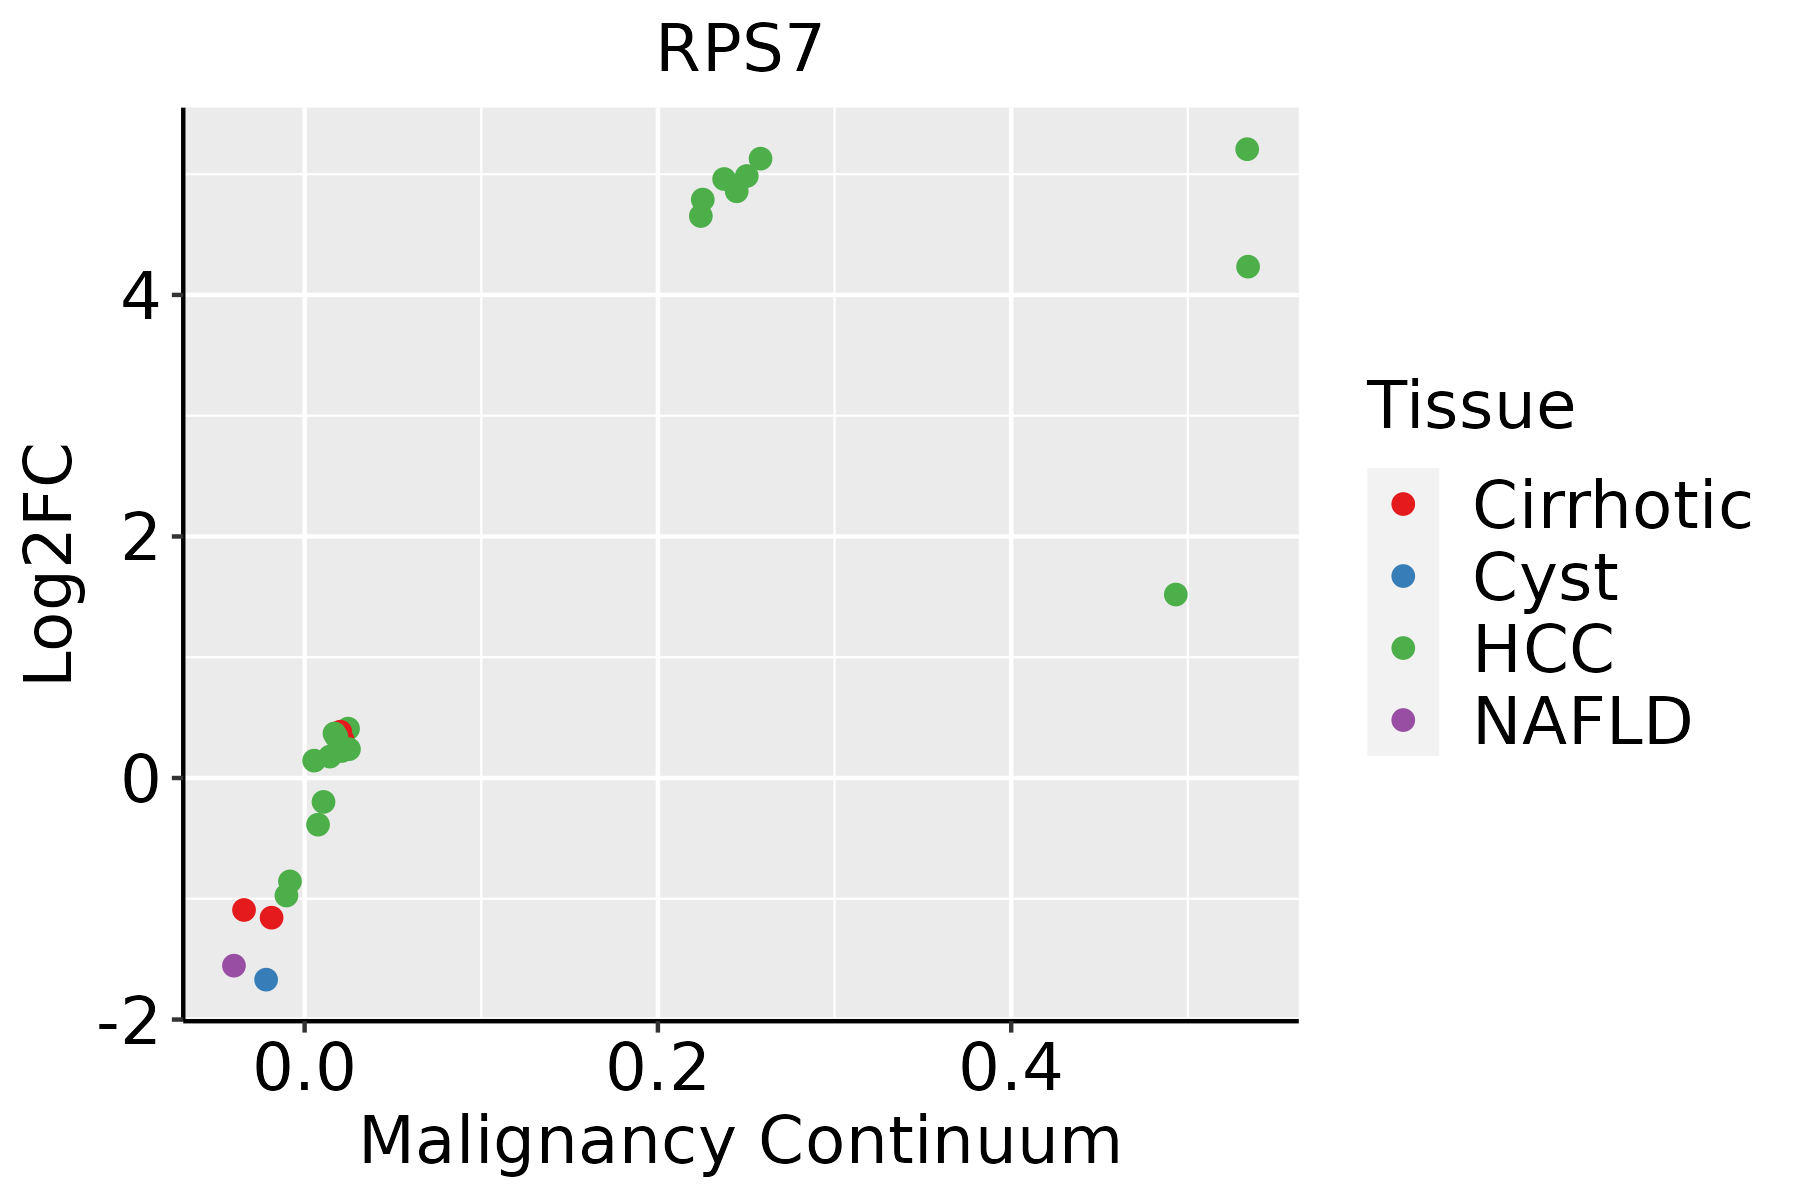 | HCC: Hepatocellular carcinoma |
| NAFLD: Non-alcoholic fatty liver disease |
| Lung | 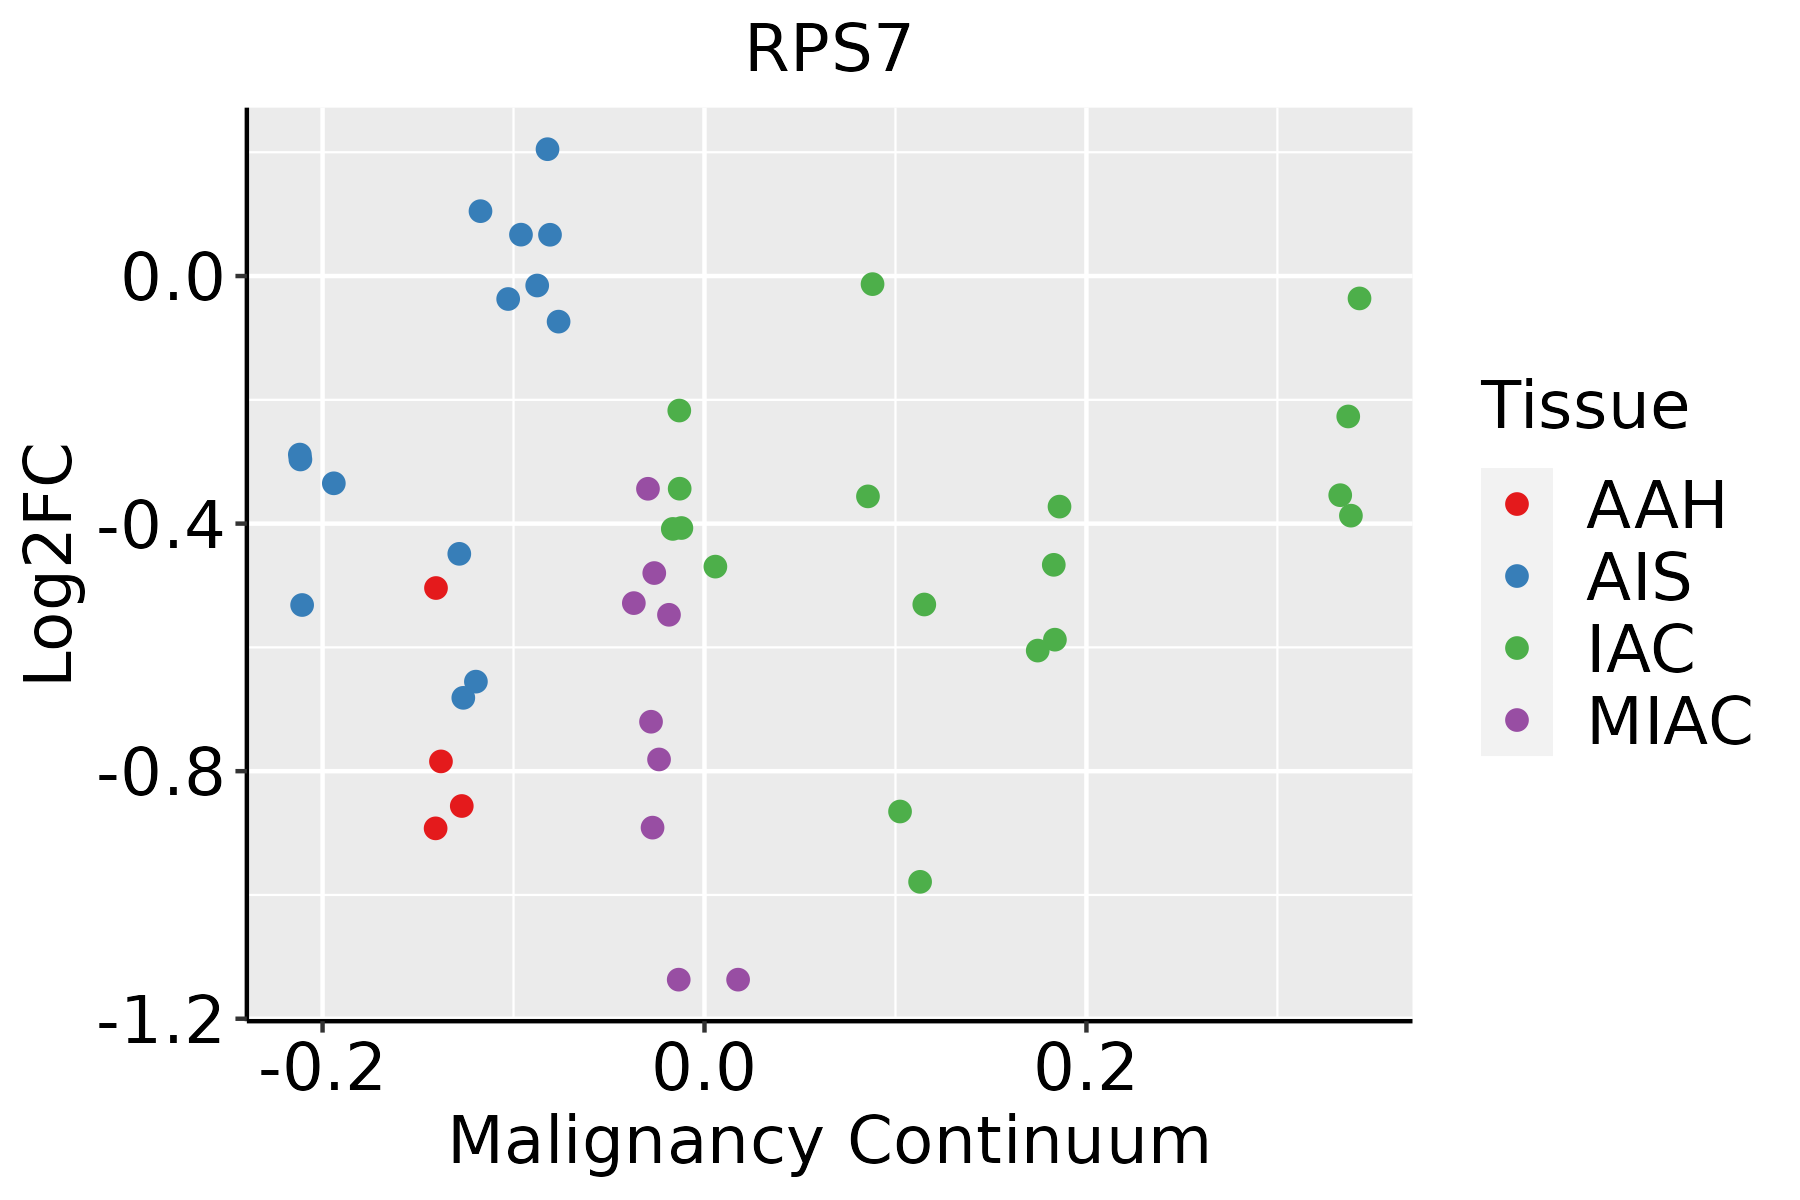 | AAH: Atypical adenomatous hyperplasia |
| AIS: Adenocarcinoma in situ |
| IAC: Invasive lung adenocarcinoma |
| MIA: Minimally invasive adenocarcinoma |
| Oral Cavity | 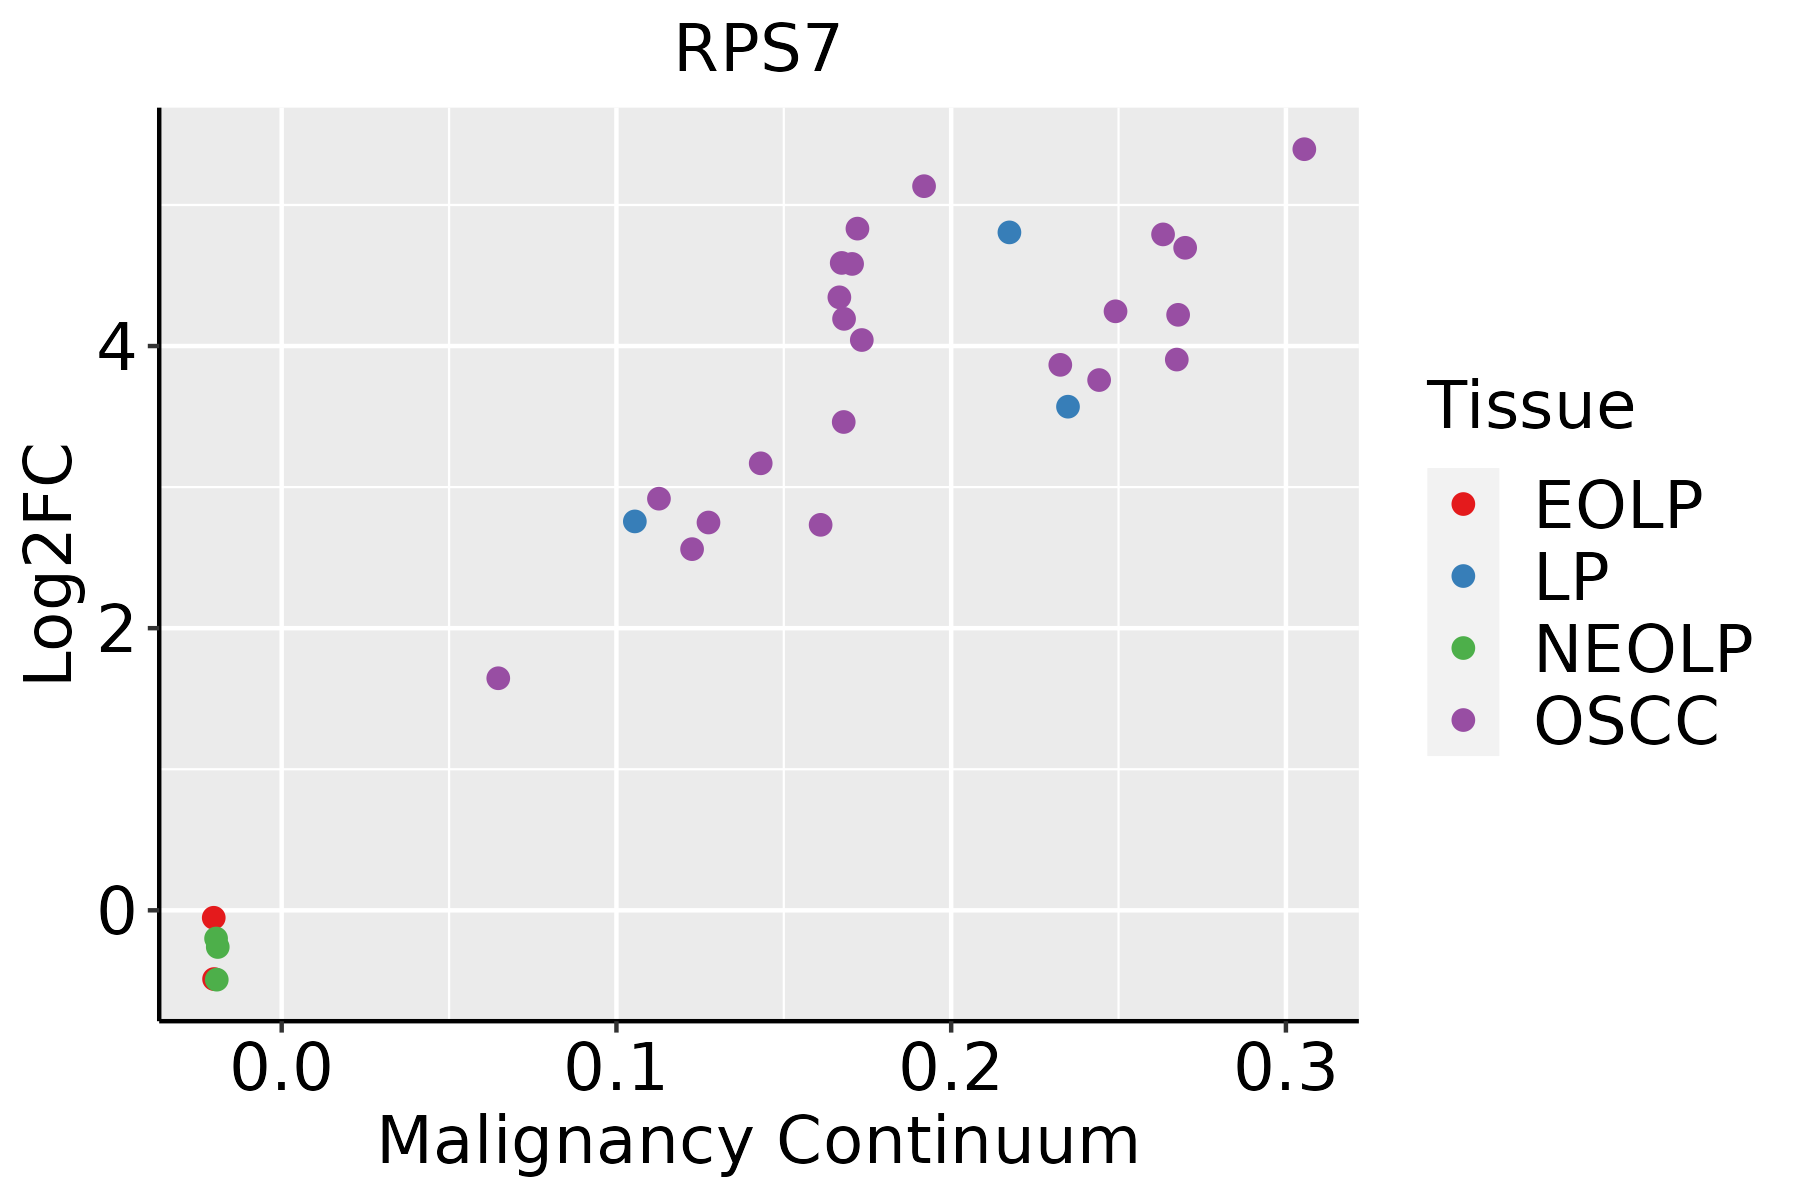 | EOLP: Erosive Oral lichen planus |
| LP: leukoplakia |
| NEOLP: Non-erosive oral lichen planus |
| OSCC: Oral squamous cell carcinoma |
| Prostate | 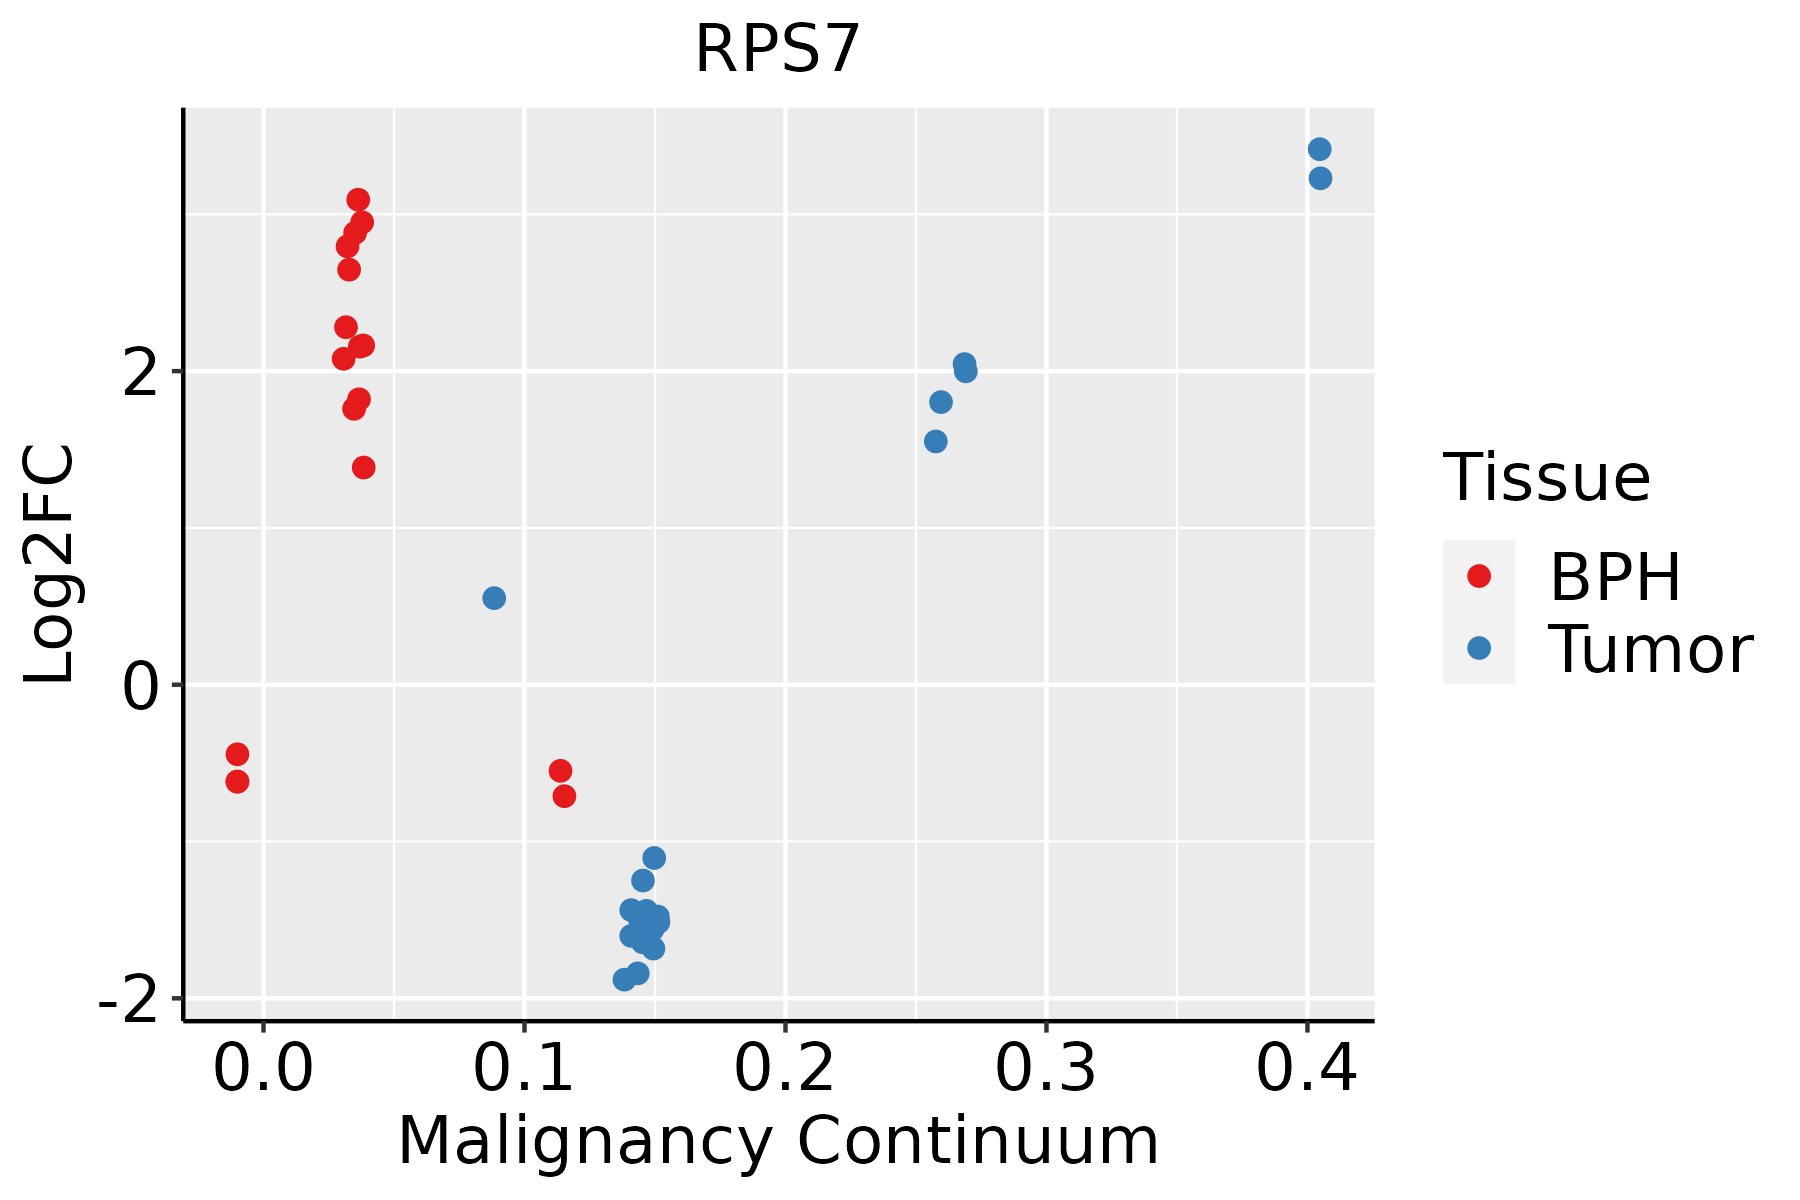 | BPH: Benign Prostatic Hyperplasia |
| Skin | 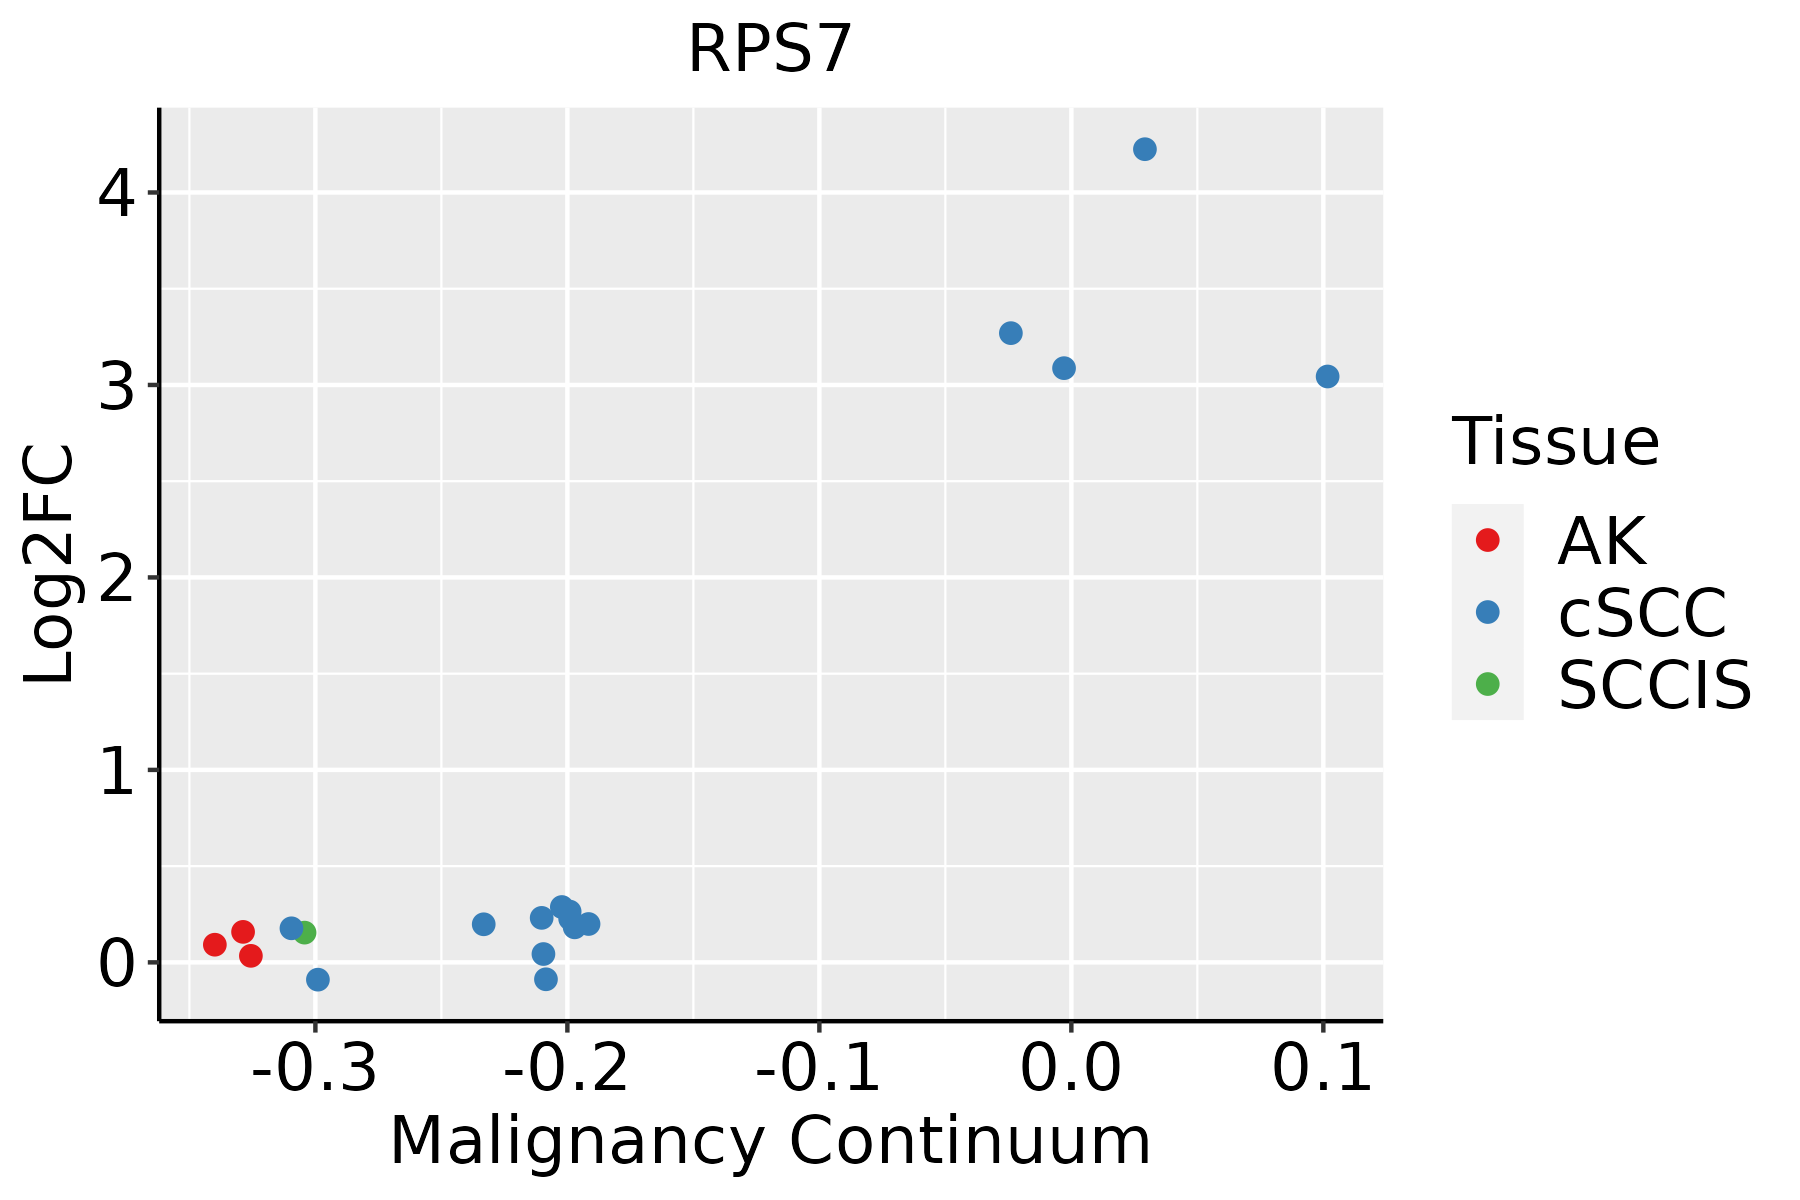 | AK: Actinic keratosis |
| cSCC: Cutaneous squamous cell carcinoma |
| SCCIS:squamous cell carcinoma in situ |
| Thyroid | 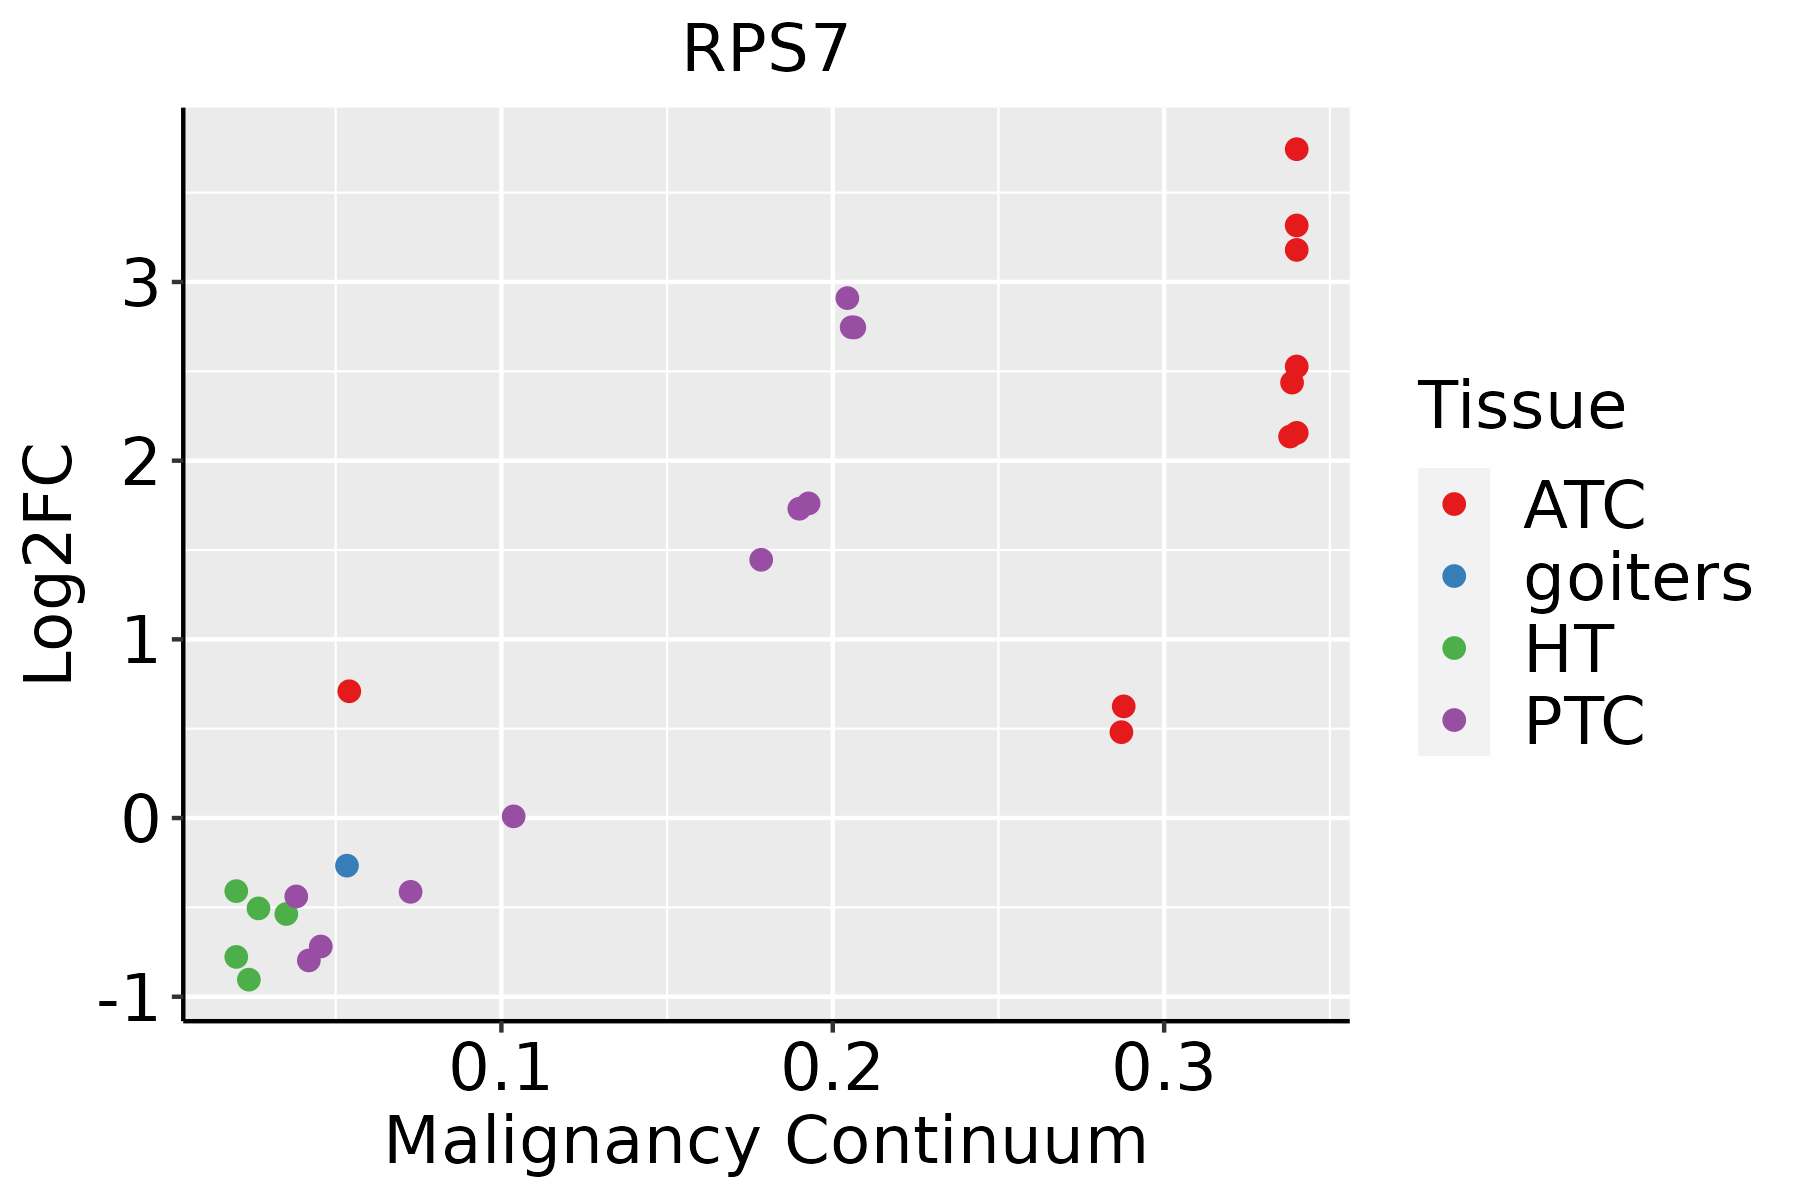 | ATC: Anaplastic thyroid cancer |
| HT: Hashimoto's thyroiditis |
| PTC: Papillary thyroid cancer |
| GO ID | Tissue | Disease Stage | Description | Gene Ratio | Bg Ratio | pvalue | p.adjust | Count |
| GO:190466733 | Lung | MIAC | negative regulation of ubiquitin protein ligase activity | 7/967 | 12/18723 | 6.05e-07 | 9.40e-05 | 7 |
| GO:190332023 | Lung | MIAC | regulation of protein modification by small protein conjugation or removal | 32/967 | 242/18723 | 1.01e-06 | 1.40e-04 | 32 |
| GO:190179633 | Lung | MIAC | regulation of signal transduction by p53 class mediator | 18/967 | 93/18723 | 1.08e-06 | 1.46e-04 | 18 |
| GO:003164723 | Lung | MIAC | regulation of protein stability | 36/967 | 298/18723 | 1.93e-06 | 2.42e-04 | 36 |
| GO:190179832 | Lung | MIAC | positive regulation of signal transduction by p53 class mediator | 9/967 | 25/18723 | 2.43e-06 | 2.83e-04 | 9 |
| GO:007233223 | Lung | MIAC | intrinsic apoptotic signaling pathway by p53 class mediator | 15/967 | 76/18723 | 6.55e-06 | 6.29e-04 | 15 |
| GO:190305033 | Lung | MIAC | regulation of proteolysis involved in cellular protein catabolic process | 28/967 | 221/18723 | 1.07e-05 | 8.86e-04 | 28 |
| GO:190466632 | Lung | MIAC | regulation of ubiquitin protein ligase activity | 8/967 | 23/18723 | 1.20e-05 | 9.65e-04 | 8 |
| GO:200005833 | Lung | MIAC | regulation of ubiquitin-dependent protein catabolic process | 23/967 | 164/18723 | 1.24e-05 | 9.79e-04 | 23 |
| GO:200123333 | Lung | MIAC | regulation of apoptotic signaling pathway | 38/967 | 356/18723 | 1.88e-05 | 1.27e-03 | 38 |
| GO:005144432 | Lung | MIAC | negative regulation of ubiquitin-protein transferase activity | 7/967 | 19/18723 | 2.79e-05 | 1.69e-03 | 7 |
| GO:004225413 | Lung | MIAC | ribosome biogenesis | 33/967 | 299/18723 | 3.37e-05 | 1.92e-03 | 33 |
| GO:002261323 | Lung | MIAC | ribonucleoprotein complex biogenesis | 44/967 | 463/18723 | 7.38e-05 | 3.47e-03 | 44 |
| GO:190225323 | Lung | MIAC | regulation of intrinsic apoptotic signaling pathway by p53 class mediator | 8/967 | 29/18723 | 7.99e-05 | 3.66e-03 | 8 |
| GO:003139623 | Lung | MIAC | regulation of protein ubiquitination | 25/967 | 210/18723 | 8.79e-05 | 3.92e-03 | 25 |
| GO:005082123 | Lung | MIAC | protein stabilization | 23/967 | 191/18723 | 1.40e-04 | 5.55e-03 | 23 |
| GO:003133033 | Lung | MIAC | negative regulation of cellular catabolic process | 28/967 | 262/18723 | 2.23e-04 | 7.67e-03 | 28 |
| GO:009719333 | Lung | MIAC | intrinsic apoptotic signaling pathway | 29/967 | 288/18723 | 4.72e-04 | 1.29e-02 | 29 |
| GO:000636413 | Lung | MIAC | rRNA processing | 23/967 | 225/18723 | 1.43e-03 | 2.54e-02 | 23 |
| GO:005143832 | Lung | MIAC | regulation of ubiquitin-protein transferase activity | 9/967 | 53/18723 | 1.44e-03 | 2.54e-02 | 9 |
| Pathway ID | Tissue | Disease Stage | Description | Gene Ratio | Bg Ratio | pvalue | p.adjust | qvalue | Count |
| hsa0301018 | Breast | Precancer | Ribosome | 80/684 | 167/8465 | 7.33e-44 | 2.32e-41 | 1.77e-41 | 80 |
| hsa0517118 | Breast | Precancer | Coronavirus disease - COVID-19 | 81/684 | 232/8465 | 3.74e-32 | 2.36e-30 | 1.81e-30 | 81 |
| hsa0301019 | Breast | Precancer | Ribosome | 80/684 | 167/8465 | 7.33e-44 | 2.32e-41 | 1.77e-41 | 80 |
| hsa0517119 | Breast | Precancer | Coronavirus disease - COVID-19 | 81/684 | 232/8465 | 3.74e-32 | 2.36e-30 | 1.81e-30 | 81 |
| hsa0301024 | Breast | IDC | Ribosome | 83/867 | 167/8465 | 6.07e-39 | 9.87e-37 | 7.38e-37 | 83 |
| hsa0517124 | Breast | IDC | Coronavirus disease - COVID-19 | 86/867 | 232/8465 | 1.50e-28 | 9.72e-27 | 7.27e-27 | 86 |
| hsa0301034 | Breast | IDC | Ribosome | 83/867 | 167/8465 | 6.07e-39 | 9.87e-37 | 7.38e-37 | 83 |
| hsa0517134 | Breast | IDC | Coronavirus disease - COVID-19 | 86/867 | 232/8465 | 1.50e-28 | 9.72e-27 | 7.27e-27 | 86 |
| hsa0301044 | Breast | DCIS | Ribosome | 82/846 | 167/8465 | 8.69e-39 | 1.40e-36 | 1.03e-36 | 82 |
| hsa0517144 | Breast | DCIS | Coronavirus disease - COVID-19 | 86/846 | 232/8465 | 2.42e-29 | 1.56e-27 | 1.15e-27 | 86 |
| hsa0301054 | Breast | DCIS | Ribosome | 82/846 | 167/8465 | 8.69e-39 | 1.40e-36 | 1.03e-36 | 82 |
| hsa0517154 | Breast | DCIS | Coronavirus disease - COVID-19 | 86/846 | 232/8465 | 2.42e-29 | 1.56e-27 | 1.15e-27 | 86 |
| hsa0517120 | Cervix | CC | Coronavirus disease - COVID-19 | 111/1267 | 232/8465 | 1.82e-33 | 5.90e-31 | 3.49e-31 | 111 |
| hsa0301020 | Cervix | CC | Ribosome | 85/1267 | 167/8465 | 3.17e-28 | 5.14e-26 | 3.04e-26 | 85 |
| hsa05171110 | Cervix | CC | Coronavirus disease - COVID-19 | 111/1267 | 232/8465 | 1.82e-33 | 5.90e-31 | 3.49e-31 | 111 |
| hsa03010110 | Cervix | CC | Ribosome | 85/1267 | 167/8465 | 3.17e-28 | 5.14e-26 | 3.04e-26 | 85 |
| hsa0301025 | Cervix | HSIL_HPV | Ribosome | 80/459 | 167/8465 | 9.61e-58 | 2.82e-55 | 2.28e-55 | 80 |
| hsa0517125 | Cervix | HSIL_HPV | Coronavirus disease - COVID-19 | 91/459 | 232/8465 | 2.14e-56 | 3.13e-54 | 2.53e-54 | 91 |
| hsa0301035 | Cervix | HSIL_HPV | Ribosome | 80/459 | 167/8465 | 9.61e-58 | 2.82e-55 | 2.28e-55 | 80 |
| hsa0517135 | Cervix | HSIL_HPV | Coronavirus disease - COVID-19 | 91/459 | 232/8465 | 2.14e-56 | 3.13e-54 | 2.53e-54 | 91 |
| Hugo Symbol | Variant Class | Variant Classification | dbSNP RS | HGVSc | HGVSp | HGVSp Short | SWISSPROT | BIOTYPE | SIFT | PolyPhen | Tumor Sample Barcode | Tissue | Histology | Sex | Age | Stage | Therapy Types | Drugs | Outcome |
| RPS7 | SNV | Missense_Mutation | novel | c.241N>T | p.Arg81Cys | p.R81C | P62081 | protein_coding | tolerated(0.1) | benign(0.07) | TCGA-D8-A1XJ-01 | Breast | breast invasive carcinoma | Female | >=65 | III/IV | Hormone Therapy | tamoxiphen | SD |
| RPS7 | SNV | Missense_Mutation | novel | c.91N>C | p.Glu31Gln | p.E31Q | P62081 | protein_coding | deleterious(0.04) | possibly_damaging(0.58) | TCGA-EK-A2RB-01 | Cervix | cervical & endocervical cancer | Female | <65 | I/II | Unknown | Unknown | SD |
| RPS7 | SNV | Missense_Mutation | | c.58N>C | p.Glu20Gln | p.E20Q | P62081 | protein_coding | deleterious(0.01) | possibly_damaging(0.897) | TCGA-Q1-A73O-01 | Cervix | cervical & endocervical cancer | Female | <65 | I/II | Chemotherapy | cisplatin | CR |
| RPS7 | SNV | Missense_Mutation | | c.347N>A | p.Arg116His | p.R116H | P62081 | protein_coding | tolerated(0.1) | benign(0.114) | TCGA-CM-6162-01 | Colorectum | colon adenocarcinoma | Female | <65 | III/IV | Chemotherapy | oxaliplatin | SD |
| RPS7 | SNV | Missense_Mutation | novel | c.352N>G | p.Arg118Gly | p.R118G | P62081 | protein_coding | deleterious(0.01) | probably_damaging(0.939) | TCGA-AJ-A3EK-01 | Endometrium | uterine corpus endometrioid carcinoma | Female | <65 | I/II | Chemotherapy | carboplatin | CR |
| RPS7 | SNV | Missense_Mutation | | c.449N>A | p.Gly150Asp | p.G150D | P62081 | protein_coding | deleterious(0) | possibly_damaging(0.795) | TCGA-AP-A051-01 | Endometrium | uterine corpus endometrioid carcinoma | Female | >=65 | I/II | Unknown | Unknown | SD |
| RPS7 | SNV | Missense_Mutation | novel | c.393G>T | p.Glu131Asp | p.E131D | P62081 | protein_coding | tolerated(0.16) | benign(0.026) | TCGA-AP-A059-01 | Endometrium | uterine corpus endometrioid carcinoma | Female | >=65 | I/II | Unknown | Unknown | SD |
| RPS7 | SNV | Missense_Mutation | | c.412N>A | p.Glu138Lys | p.E138K | P62081 | protein_coding | deleterious(0.01) | probably_damaging(0.975) | TCGA-AP-A0LM-01 | Endometrium | uterine corpus endometrioid carcinoma | Female | <65 | III/IV | Chemotherapy | cisplatin | SD |
| RPS7 | SNV | Missense_Mutation | novel | c.568N>T | p.Pro190Ser | p.P190S | P62081 | protein_coding | deleterious(0.03) | possibly_damaging(0.542) | TCGA-B5-A11E-01 | Endometrium | uterine corpus endometrioid carcinoma | Female | <65 | I/II | Unknown | Unknown | SD |
| RPS7 | SNV | Missense_Mutation | | c.117N>T | p.Gln39His | p.Q39H | P62081 | protein_coding | deleterious(0.04) | benign(0.049) | TCGA-B5-A11Z-01 | Endometrium | uterine corpus endometrioid carcinoma | Female | <65 | I/II | Unknown | Unknown | SD |


