
|
|||||
|
 | |
| |
| |
| |
| |
| |
|
Gene: ATP5F1B |
Gene summary for ATP5F1B |
| Gene information | Species | Human | Gene symbol | ATP5F1B | Gene ID | 506 |
| Gene name | ATP synthase F1 subunit beta | |
| Gene Alias | ATP5B | |
| Cytomap | 12q13.3 | |
| Gene Type | protein-coding | GO ID | GO:0001503 | UniProtAcc | P06576 |
Top |
Malignant transformation analysis |
| Identification of the aberrant gene expression in precancerous and cancerous lesions by comparing the gene expression of stem-like cells in diseased tissues with normal stem cells |
| Entrez ID | Symbol | Replicates | Species | Organ | Tissue | Adj P-value | Log2FC | Malignancy |
| 506 | ATP5F1B | GSM4909285 | Human | Breast | IDC | 4.38e-61 | 1.01e+00 | 0.21 |
| 506 | ATP5F1B | GSM4909286 | Human | Breast | IDC | 1.26e-09 | 1.14e-01 | 0.1081 |
| 506 | ATP5F1B | GSM4909289 | Human | Breast | IDC | 3.99e-03 | 5.60e-01 | 0.1064 |
| 506 | ATP5F1B | GSM4909291 | Human | Breast | IDC | 4.61e-07 | 4.69e-01 | 0.1753 |
| 506 | ATP5F1B | GSM4909293 | Human | Breast | IDC | 1.73e-15 | 3.13e-01 | 0.1581 |
| 506 | ATP5F1B | GSM4909294 | Human | Breast | IDC | 3.73e-04 | 3.03e-01 | 0.2022 |
| 506 | ATP5F1B | GSM4909297 | Human | Breast | IDC | 1.32e-03 | 2.85e-02 | 0.1517 |
| 506 | ATP5F1B | GSM4909298 | Human | Breast | IDC | 1.60e-04 | 7.18e-02 | 0.1551 |
| 506 | ATP5F1B | GSM4909304 | Human | Breast | IDC | 1.99e-11 | 4.36e-01 | 0.1636 |
| 506 | ATP5F1B | GSM4909305 | Human | Breast | IDC | 1.29e-10 | 4.21e-01 | 0.0436 |
| 506 | ATP5F1B | GSM4909306 | Human | Breast | IDC | 1.08e-03 | 2.97e-01 | 0.1564 |
| 506 | ATP5F1B | GSM4909308 | Human | Breast | IDC | 1.51e-07 | 3.10e-01 | 0.158 |
| 506 | ATP5F1B | GSM4909311 | Human | Breast | IDC | 6.99e-17 | -1.12e-01 | 0.1534 |
| 506 | ATP5F1B | GSM4909312 | Human | Breast | IDC | 5.24e-04 | 2.10e-01 | 0.1552 |
| 506 | ATP5F1B | GSM4909317 | Human | Breast | IDC | 1.98e-11 | 4.37e-01 | 0.1355 |
| 506 | ATP5F1B | GSM4909318 | Human | Breast | IDC | 7.79e-03 | 5.18e-01 | 0.2031 |
| 506 | ATP5F1B | GSM4909319 | Human | Breast | IDC | 3.68e-25 | -9.04e-02 | 0.1563 |
| 506 | ATP5F1B | GSM4909321 | Human | Breast | IDC | 1.98e-27 | 6.42e-01 | 0.1559 |
| 506 | ATP5F1B | brca1 | Human | Breast | Precancer | 1.63e-27 | -4.97e-01 | -0.0338 |
| 506 | ATP5F1B | brca2 | Human | Breast | Precancer | 7.84e-25 | -4.97e-01 | -0.024 |
| Page: 1 2 3 4 5 6 7 8 9 10 11 12 |
| Tissue | Expression Dynamics | Abbreviation |
| Breast | 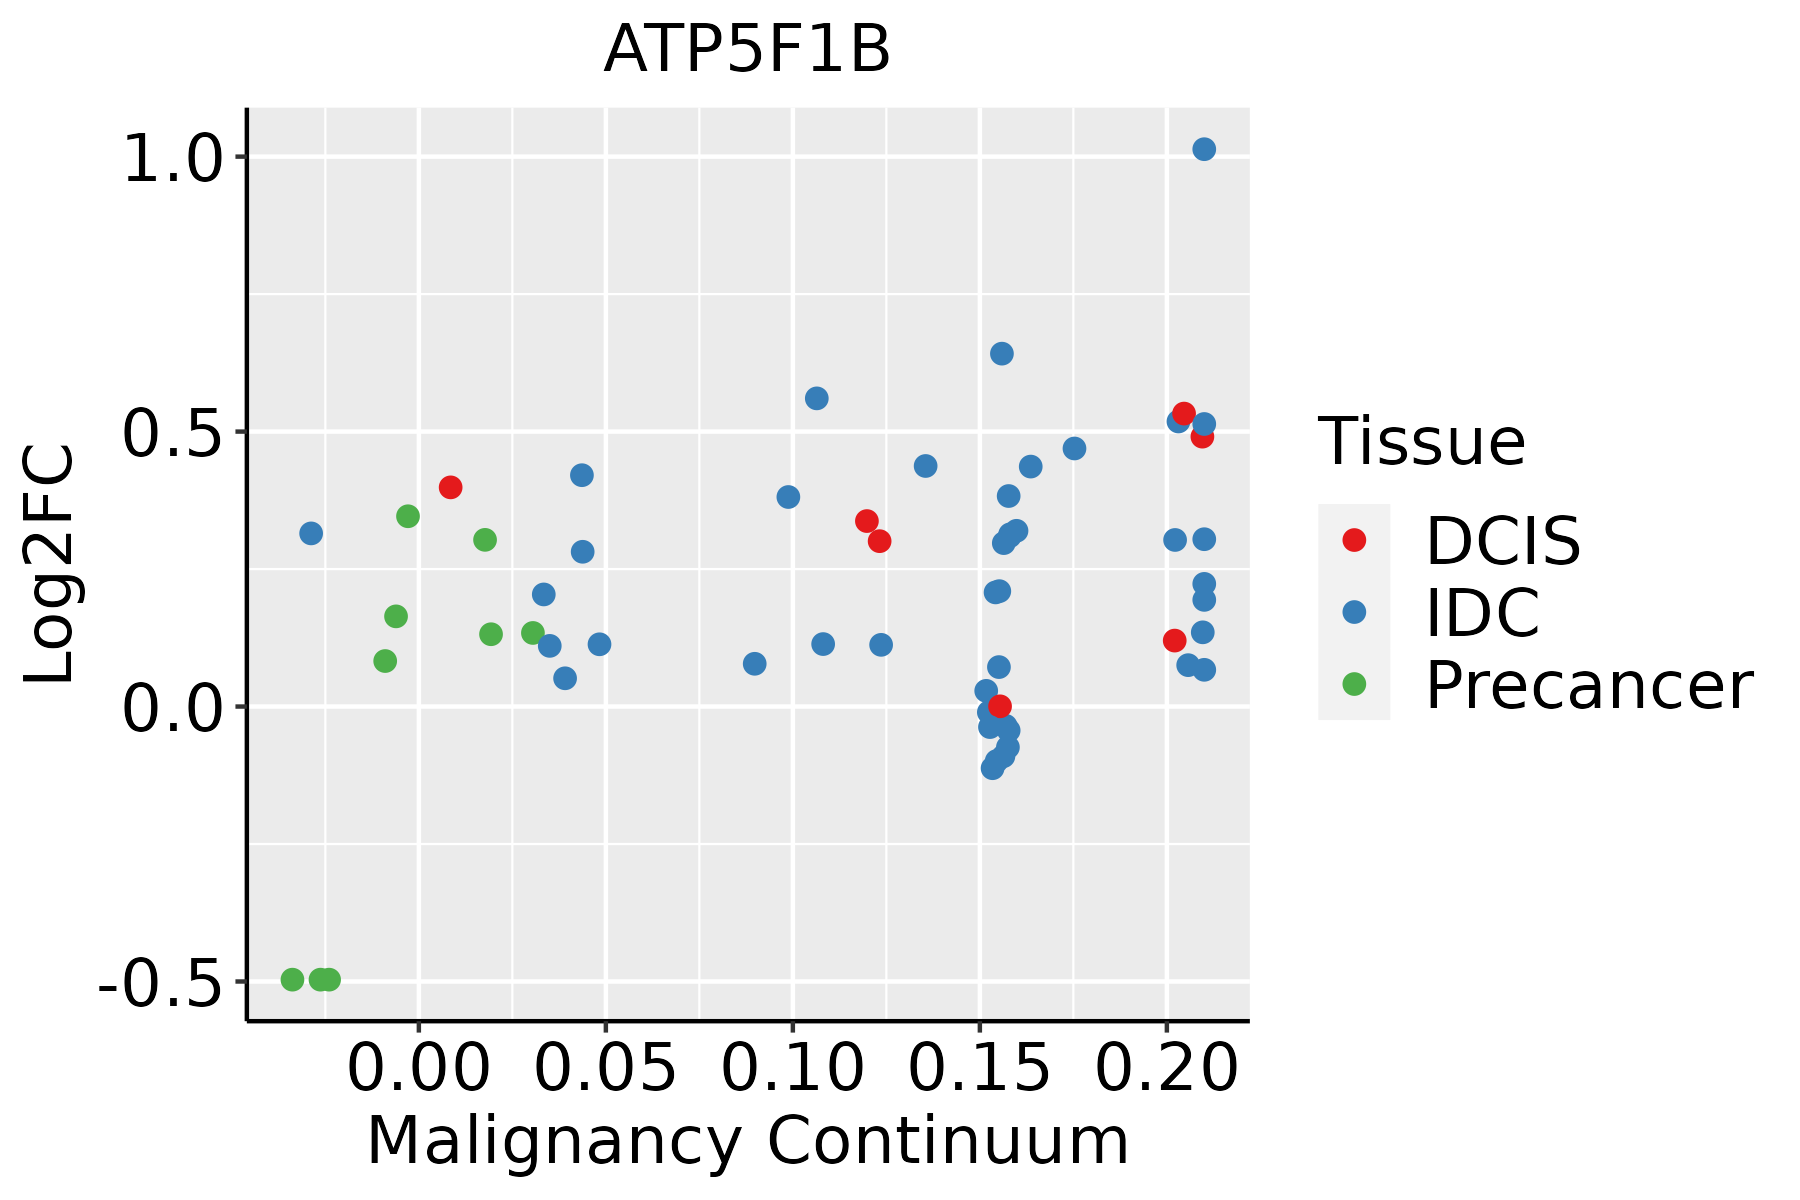 | IDC: Invasive ductal carcinoma |
| DCIS: Ductal carcinoma in situ | ||
| Precancer(BRCA1-mut): Precancerous lesion from BRCA1 mutation carriers | ||
| Cervix | 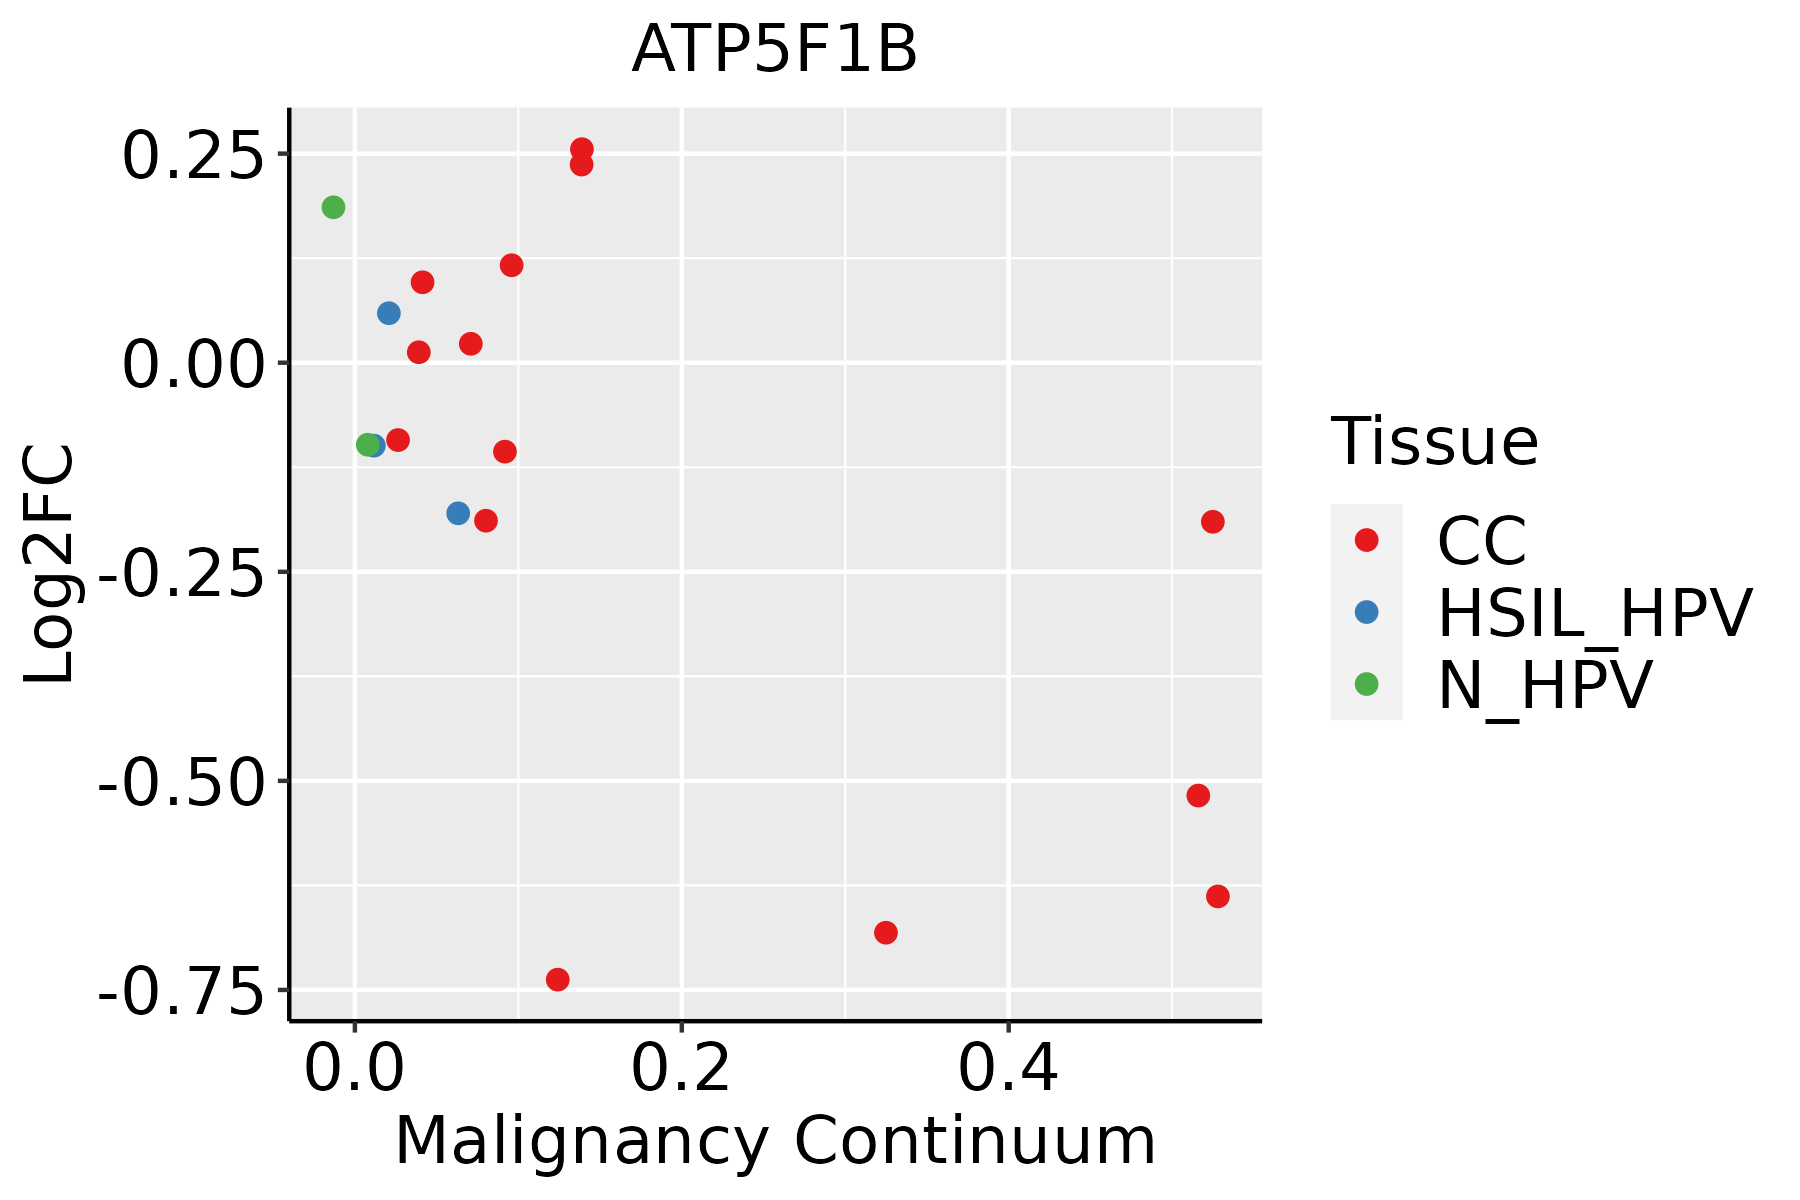 | CC: Cervix cancer |
| HSIL_HPV: HPV-infected high-grade squamous intraepithelial lesions | ||
| N_HPV: HPV-infected normal cervix | ||
| Colorectum (GSE201348) |  | FAP: Familial adenomatous polyposis |
| CRC: Colorectal cancer | ||
| Colorectum (HTA11) |  | AD: Adenomas |
| SER: Sessile serrated lesions | ||
| MSI-H: Microsatellite-high colorectal cancer | ||
| MSS: Microsatellite stable colorectal cancer | ||
| Endometrium | 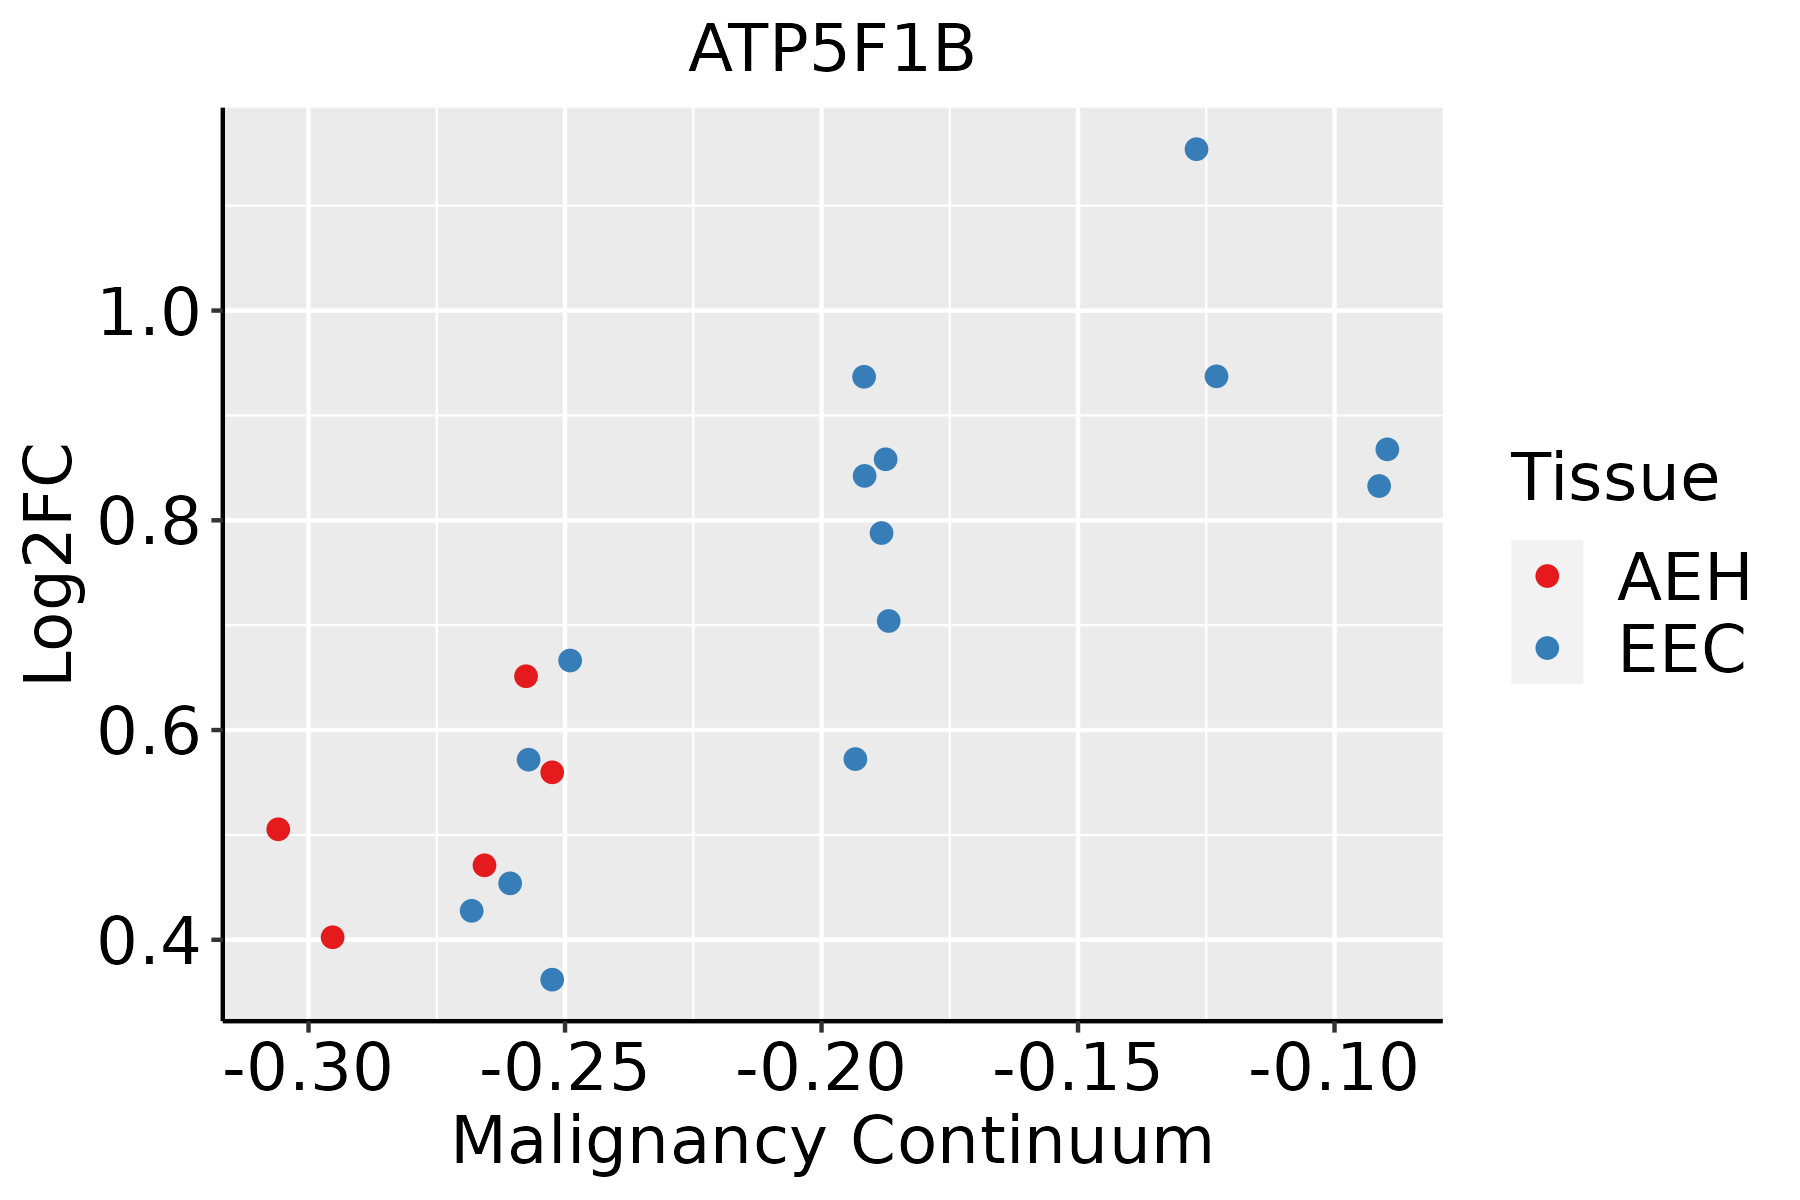 | AEH: Atypical endometrial hyperplasia |
| EEC: Endometrioid Cancer | ||
| Esophagus | 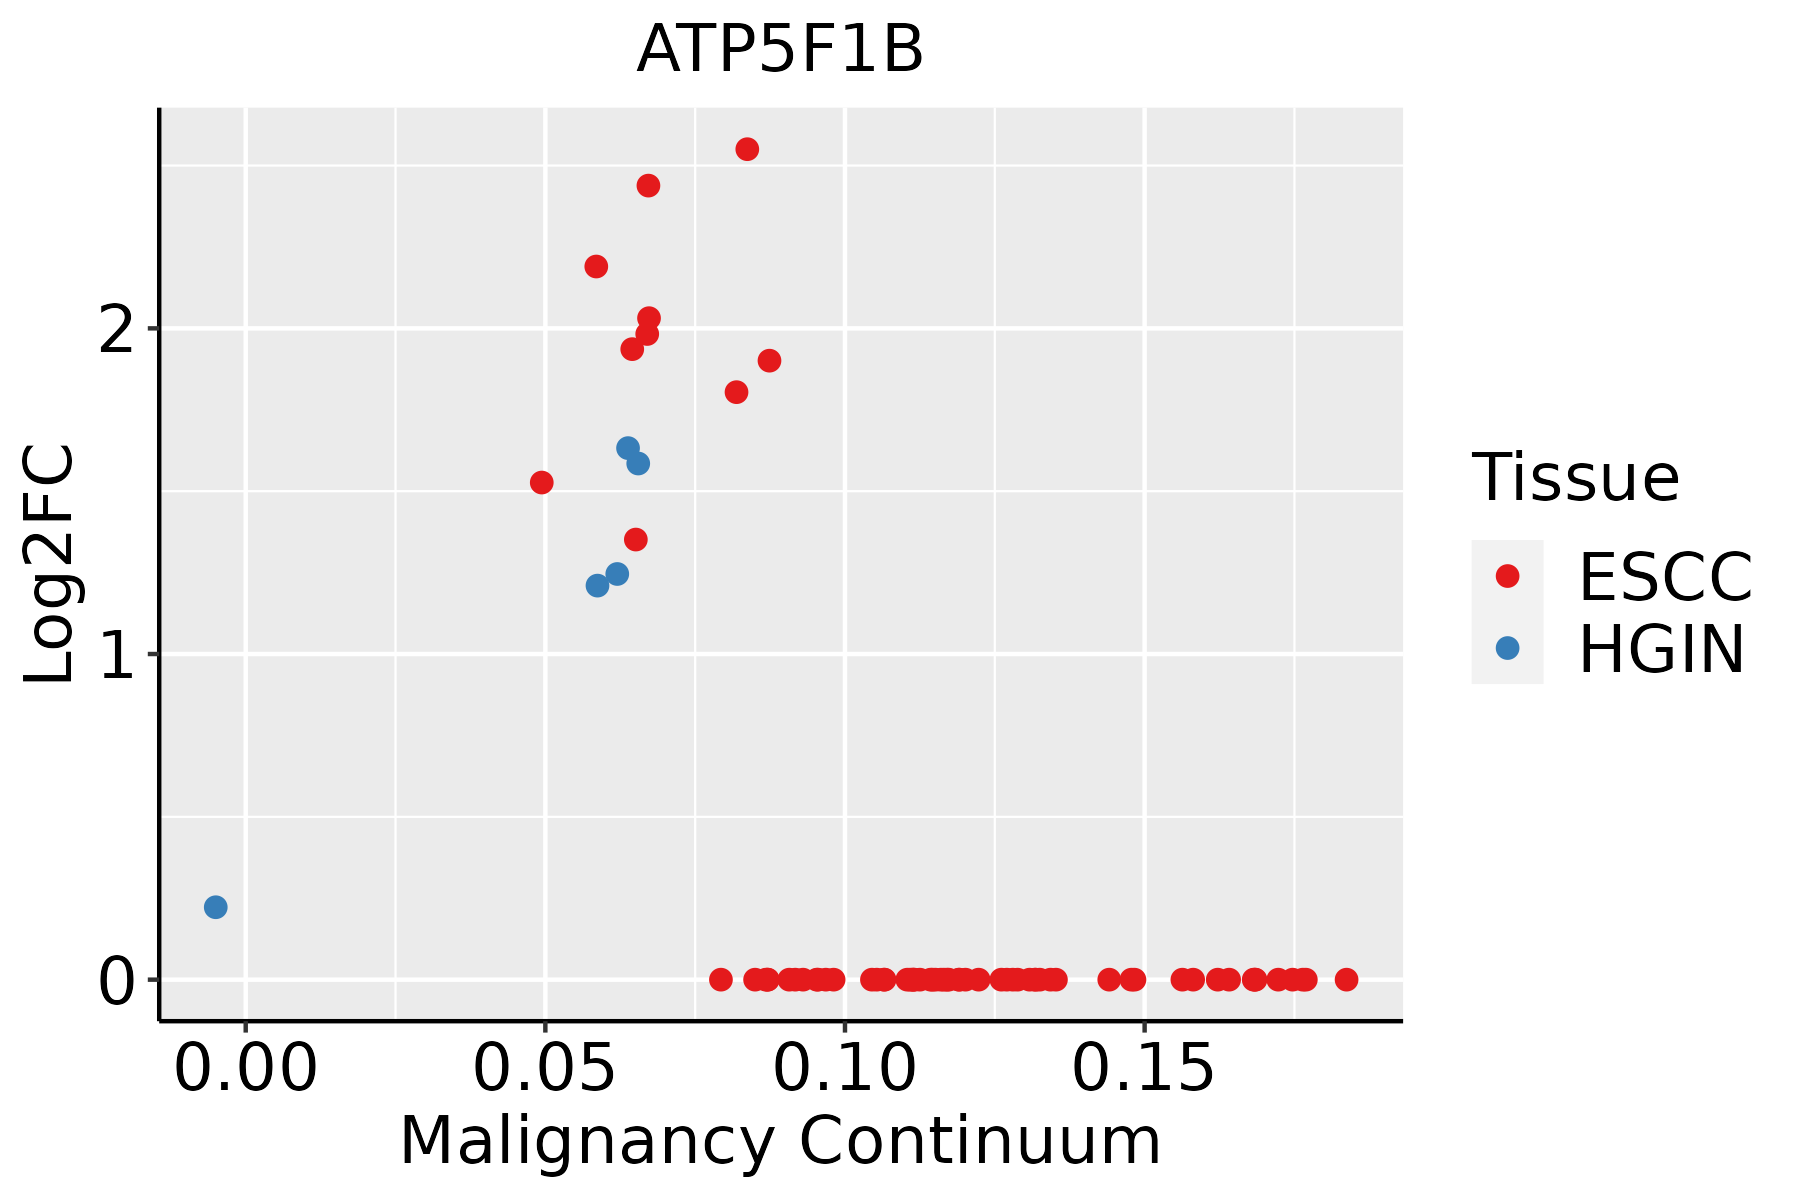 | ESCC: Esophageal squamous cell carcinoma |
| HGIN: High-grade intraepithelial neoplasias | ||
| LGIN: Low-grade intraepithelial neoplasias | ||
| GC | 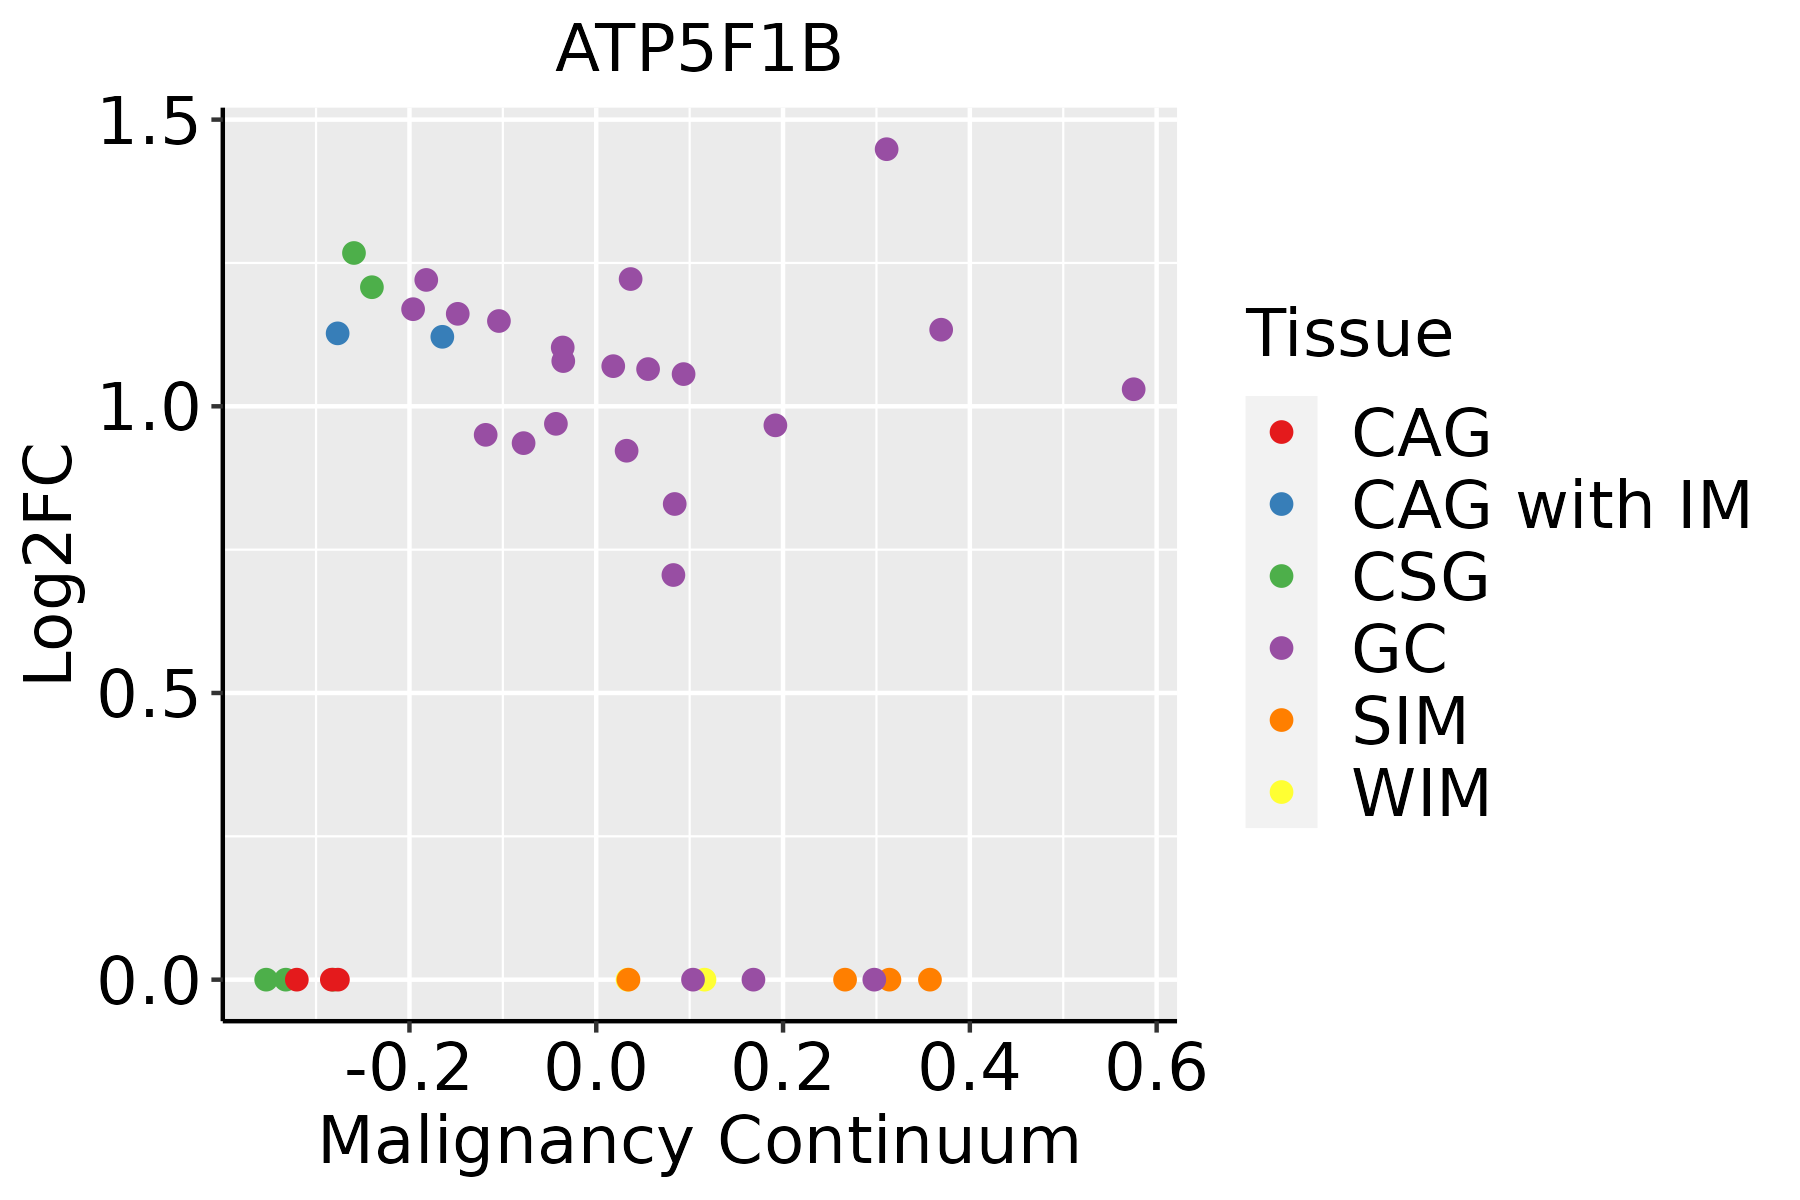 | CAG: Chronic atrophic gastritis |
| CAG with IM: Chronic atrophic gastritis with intestinal metaplasia | ||
| CSG: Chronic superficial gastritis | ||
| GC: Gastric cancer | ||
| SIM: Severe intestinal metaplasia | ||
| WIM: Wild intestinal metaplasia | ||
| Liver | 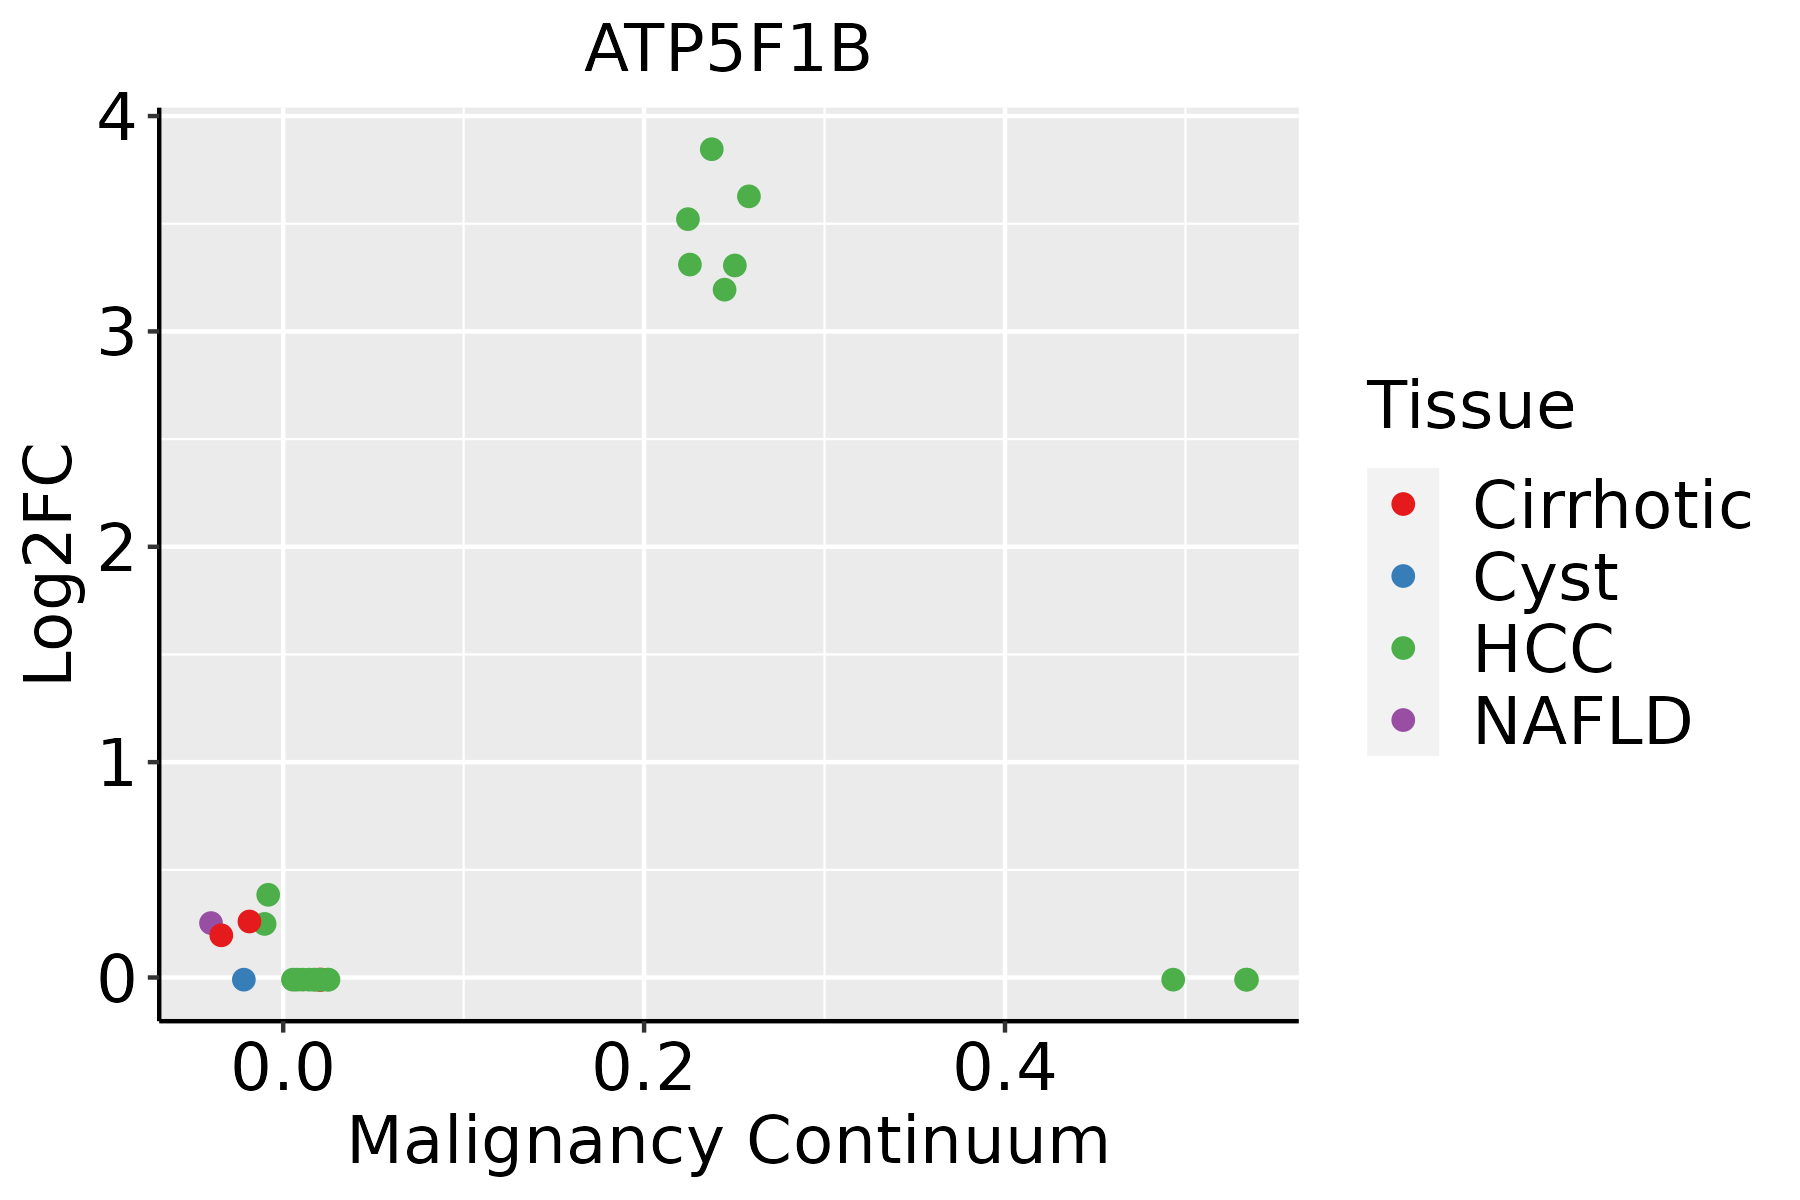 | HCC: Hepatocellular carcinoma |
| NAFLD: Non-alcoholic fatty liver disease | ||
| Lung | 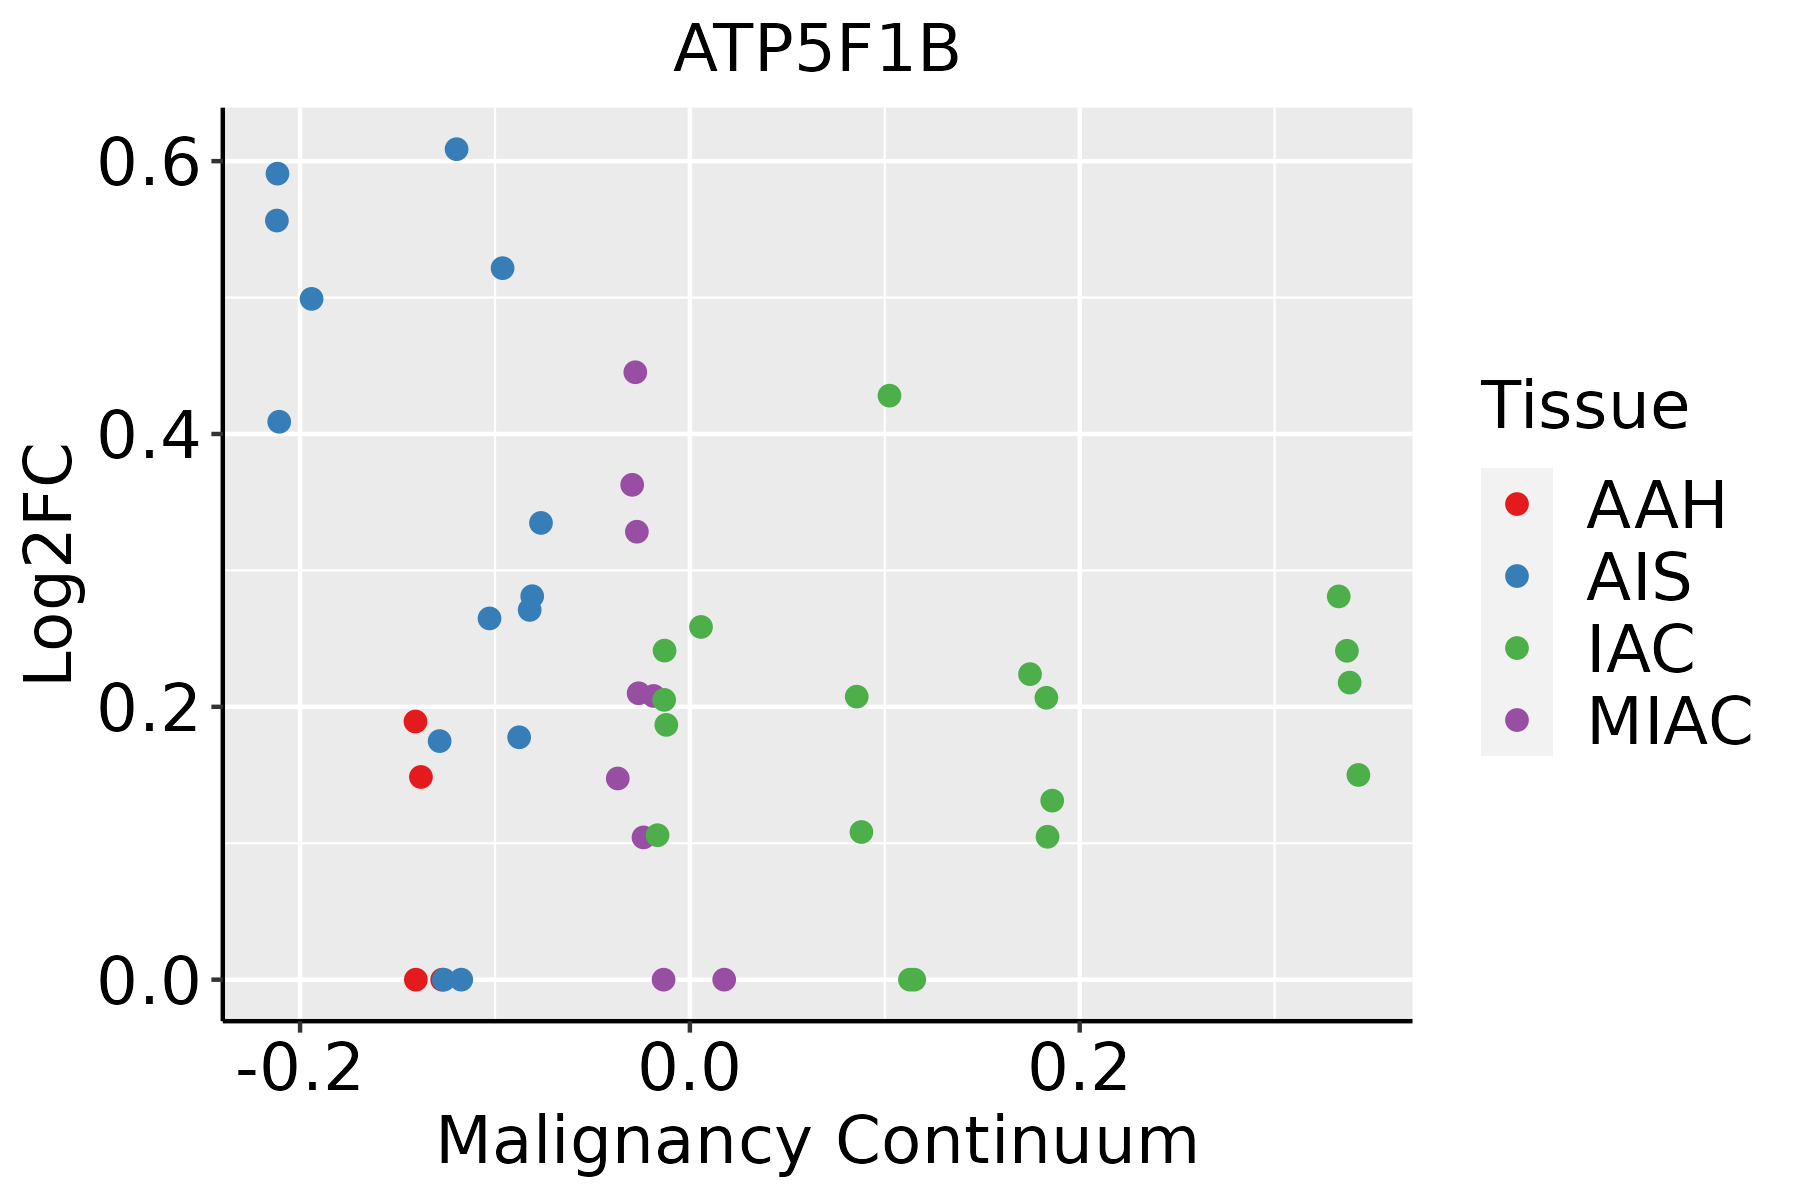 | AAH: Atypical adenomatous hyperplasia |
| AIS: Adenocarcinoma in situ | ||
| IAC: Invasive lung adenocarcinoma | ||
| MIA: Minimally invasive adenocarcinoma | ||
| Prostate | 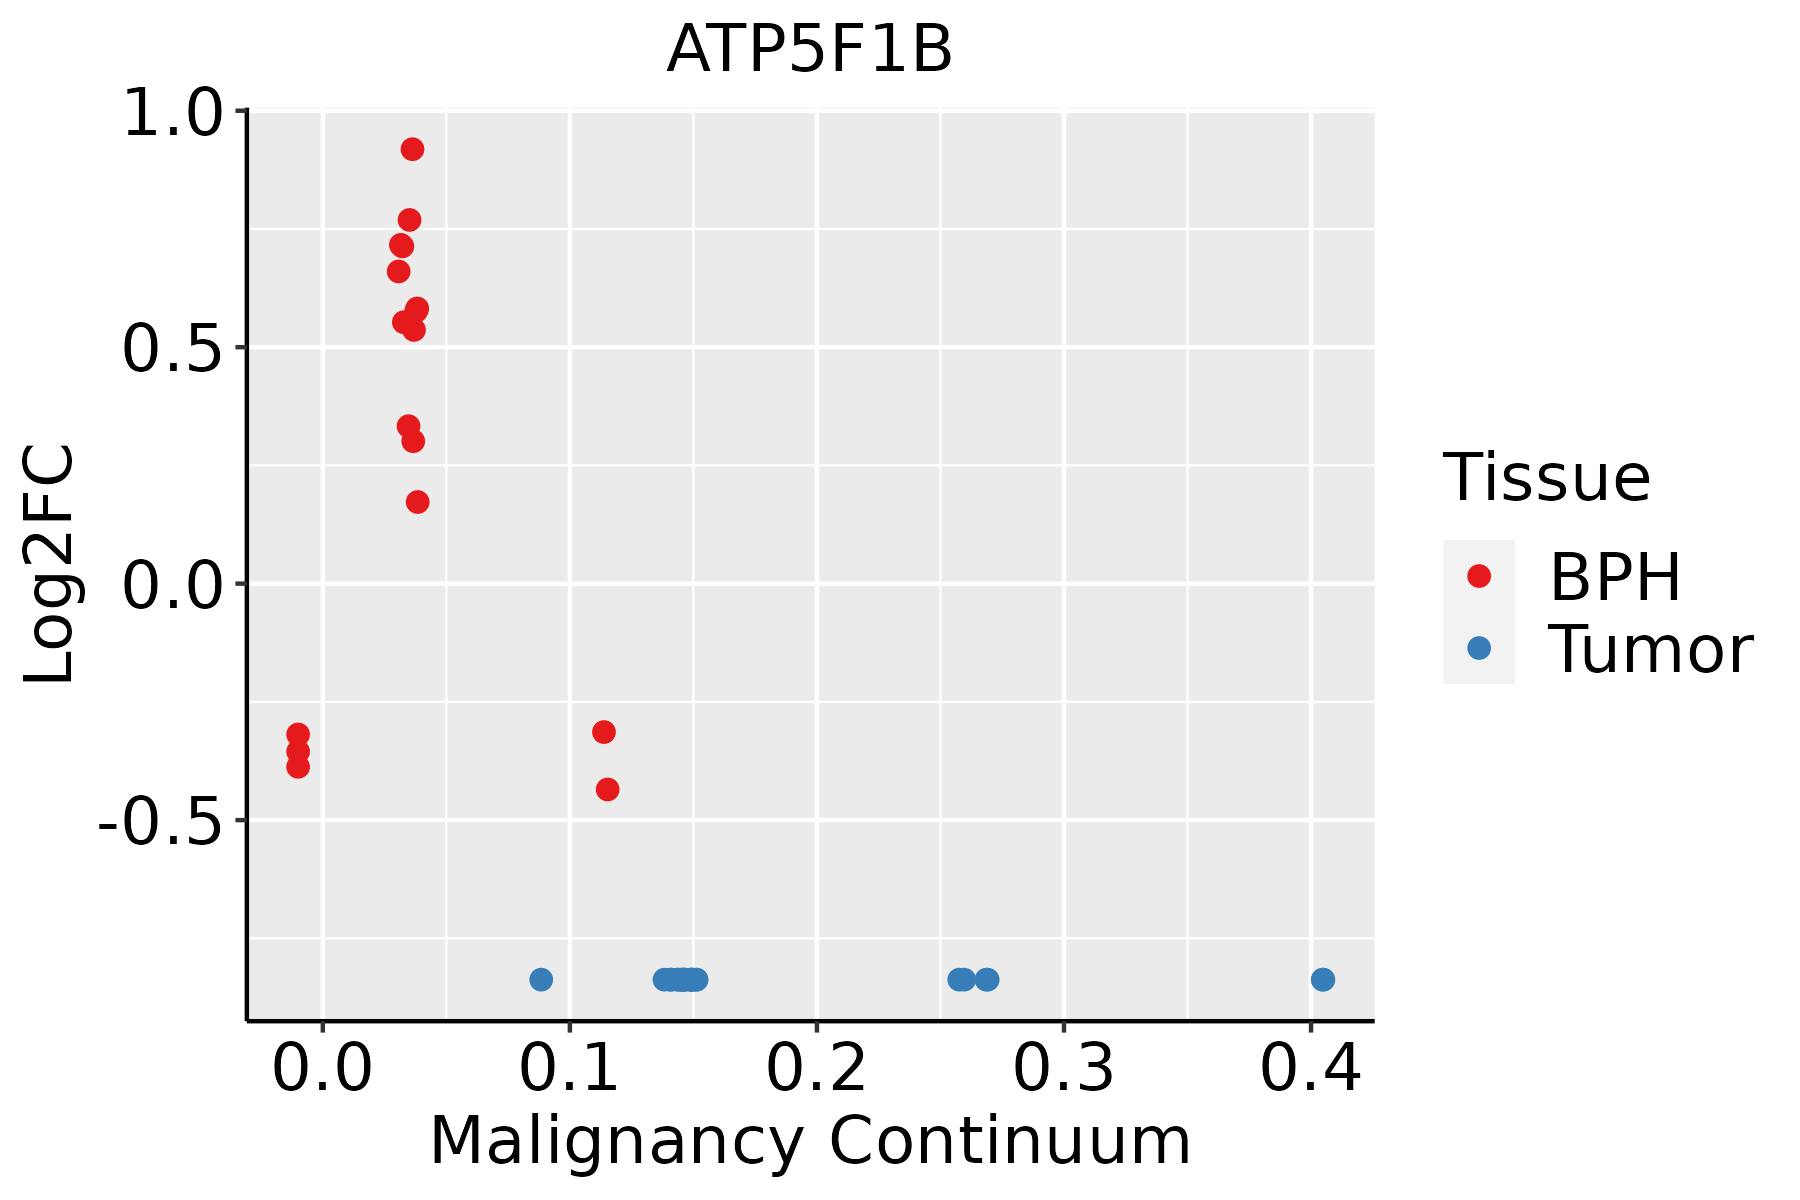 | BPH: Benign Prostatic Hyperplasia |
| Skin | 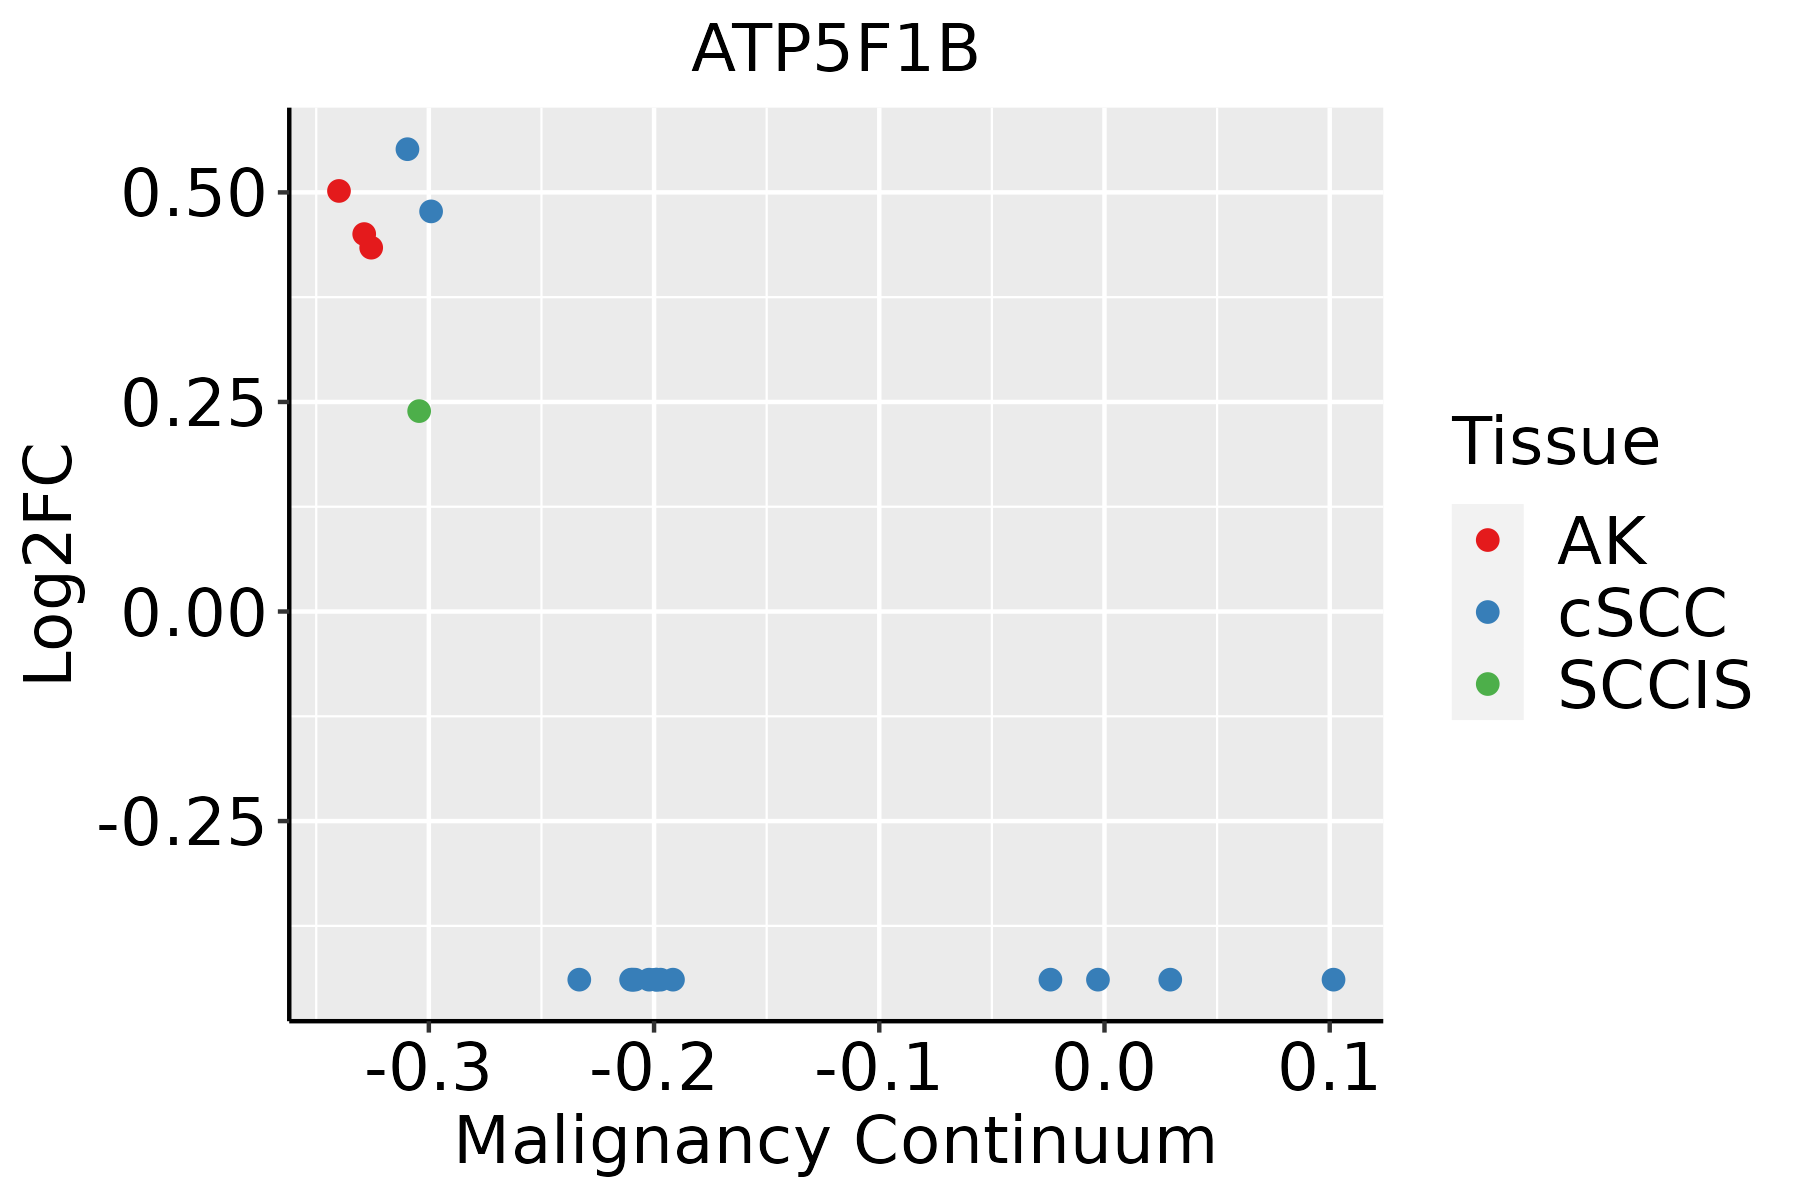 | AK: Actinic keratosis |
| cSCC: Cutaneous squamous cell carcinoma | ||
| SCCIS:squamous cell carcinoma in situ | ||
| Thyroid | 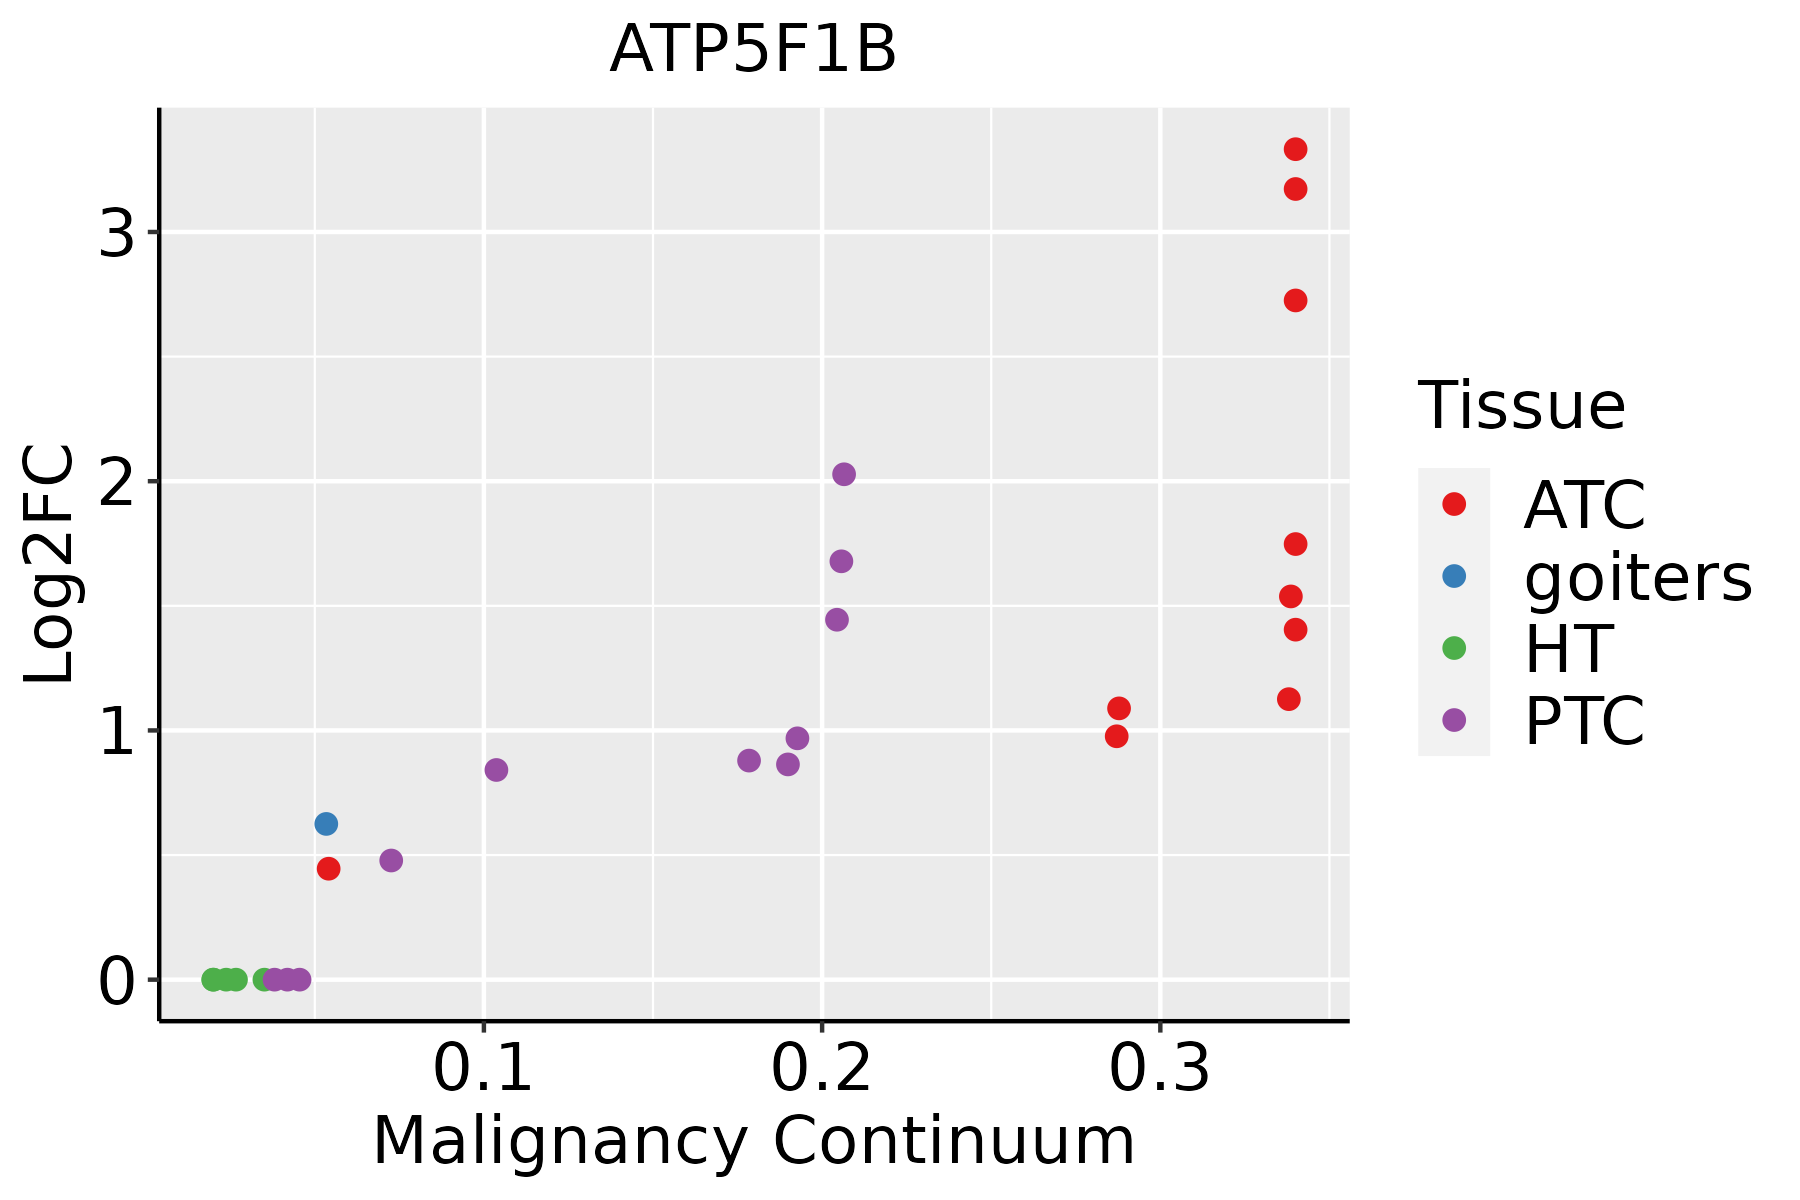 | ATC: Anaplastic thyroid cancer |
| HT: Hashimoto's thyroiditis | ||
| PTC: Papillary thyroid cancer |
| ∗log2FC in expression of this searched gene in stem-like cells from each diseased tissue sample relative to stem-like cells in normal samples in each tissue plotted against the malignancy continuum. Samples are colored based on if they are from different disease stage. |
Top |
Malignant transformation related pathway analysis |
| Find out the enriched GO biological processes and KEGG pathways involved in transition from healthy to precancer to cancer |
| Tissue | Disease Stage | Enriched GO biological Processes |
| Colorectum | AD |  |
| Colorectum | SER |  |
| Colorectum | MSS |  |
| Colorectum | MSI-H |  |
| Colorectum | FAP |  |
| ∗Top 15 enriched GO BP terms are showed in the bar plot of each disease state in each tissue. Each row represents a significant GO biological process which is colored according to the -log10(p.adjust). |
| Page: 1 2 3 4 5 6 7 8 9 |
| GO ID | Tissue | Disease Stage | Description | Gene Ratio | Bg Ratio | pvalue | p.adjust | Count |
| GO:00092014 | Stomach | GC | ribonucleoside triphosphate biosynthetic process | 22/1159 | 74/18723 | 3.53e-10 | 5.33e-08 | 22 |
| GO:00091506 | Stomach | GC | purine ribonucleotide metabolic process | 56/1159 | 368/18723 | 3.67e-10 | 5.39e-08 | 56 |
| GO:00091415 | Stomach | GC | nucleoside triphosphate metabolic process | 27/1159 | 112/18723 | 6.97e-10 | 9.97e-08 | 27 |
| GO:00061636 | Stomach | GC | purine nucleotide metabolic process | 58/1159 | 396/18723 | 7.97e-10 | 1.11e-07 | 58 |
| GO:00091424 | Stomach | GC | nucleoside triphosphate biosynthetic process | 23/1159 | 85/18723 | 1.12e-09 | 1.52e-07 | 23 |
| GO:00092595 | Stomach | GC | ribonucleotide metabolic process | 56/1159 | 385/18723 | 2.03e-09 | 2.69e-07 | 56 |
| GO:00068396 | Stomach | GC | mitochondrial transport | 42/1159 | 254/18723 | 4.95e-09 | 5.72e-07 | 42 |
| GO:00725216 | Stomach | GC | purine-containing compound metabolic process | 58/1159 | 416/18723 | 5.19e-09 | 5.76e-07 | 58 |
| GO:00196935 | Stomach | GC | ribose phosphate metabolic process | 56/1159 | 396/18723 | 5.72e-09 | 6.22e-07 | 56 |
| GO:00091176 | Stomach | GC | nucleotide metabolic process | 64/1159 | 489/18723 | 1.05e-08 | 9.84e-07 | 64 |
| GO:00067536 | Stomach | GC | nucleoside phosphate metabolic process | 64/1159 | 497/18723 | 1.97e-08 | 1.63e-06 | 64 |
| GO:00091525 | Stomach | GC | purine ribonucleotide biosynthetic process | 28/1159 | 169/18723 | 1.69e-06 | 7.67e-05 | 28 |
| GO:19905424 | Stomach | GC | mitochondrial transmembrane transport | 20/1159 | 102/18723 | 3.71e-06 | 1.49e-04 | 20 |
| GO:00092604 | Stomach | GC | ribonucleotide biosynthetic process | 28/1159 | 182/18723 | 7.38e-06 | 2.71e-04 | 28 |
| GO:00463904 | Stomach | GC | ribose phosphate biosynthetic process | 28/1159 | 190/18723 | 1.68e-05 | 5.32e-04 | 28 |
| GO:00061644 | Stomach | GC | purine nucleotide biosynthetic process | 28/1159 | 191/18723 | 1.86e-05 | 5.77e-04 | 28 |
| GO:00725224 | Stomach | GC | purine-containing compound biosynthetic process | 28/1159 | 200/18723 | 4.36e-05 | 1.06e-03 | 28 |
| GO:00091653 | Stomach | GC | nucleotide biosynthetic process | 31/1159 | 254/18723 | 2.35e-04 | 3.95e-03 | 31 |
| GO:19012933 | Stomach | GC | nucleoside phosphate biosynthetic process | 31/1159 | 256/18723 | 2.70e-04 | 4.44e-03 | 31 |
| GO:00016675 | Stomach | GC | ameboidal-type cell migration | 44/1159 | 475/18723 | 4.97e-03 | 3.96e-02 | 44 |
| Page: 1 2 3 4 5 6 7 8 9 10 11 12 13 14 15 16 17 18 19 20 21 22 23 24 25 26 27 28 29 30 31 32 33 34 35 36 37 38 39 40 41 42 43 44 45 46 47 48 49 50 51 52 53 54 55 56 57 |
| Pathway ID | Tissue | Disease Stage | Description | Gene Ratio | Bg Ratio | pvalue | p.adjust | qvalue | Count |
| hsa0501218 | Breast | Precancer | Parkinson disease | 99/684 | 266/8465 | 3.58e-42 | 5.65e-40 | 4.33e-40 | 99 |
| hsa0502016 | Breast | Precancer | Prion disease | 95/684 | 273/8465 | 1.39e-37 | 1.46e-35 | 1.12e-35 | 95 |
| hsa0501616 | Breast | Precancer | Huntington disease | 98/684 | 306/8465 | 2.85e-35 | 2.25e-33 | 1.72e-33 | 98 |
| hsa0019016 | Breast | Precancer | Oxidative phosphorylation | 59/684 | 134/8465 | 6.15e-30 | 3.24e-28 | 2.48e-28 | 59 |
| hsa0501016 | Breast | Precancer | Alzheimer disease | 103/684 | 384/8465 | 1.03e-29 | 4.66e-28 | 3.57e-28 | 103 |
| hsa0501416 | Breast | Precancer | Amyotrophic lateral sclerosis | 98/684 | 364/8465 | 2.13e-28 | 8.41e-27 | 6.44e-27 | 98 |
| hsa0502216 | Breast | Precancer | Pathways of neurodegeneration - multiple diseases | 112/684 | 476/8465 | 6.96e-27 | 2.44e-25 | 1.87e-25 | 112 |
| hsa0520818 | Breast | Precancer | Chemical carcinogenesis - reactive oxygen species | 68/684 | 223/8465 | 3.61e-23 | 1.14e-21 | 8.73e-22 | 68 |
| hsa0471418 | Breast | Precancer | Thermogenesis | 68/684 | 232/8465 | 4.40e-22 | 1.26e-20 | 9.69e-21 | 68 |
| hsa0541518 | Breast | Precancer | Diabetic cardiomyopathy | 63/684 | 203/8465 | 5.63e-22 | 1.48e-20 | 1.14e-20 | 63 |
| hsa0501219 | Breast | Precancer | Parkinson disease | 99/684 | 266/8465 | 3.58e-42 | 5.65e-40 | 4.33e-40 | 99 |
| hsa0502017 | Breast | Precancer | Prion disease | 95/684 | 273/8465 | 1.39e-37 | 1.46e-35 | 1.12e-35 | 95 |
| hsa0501617 | Breast | Precancer | Huntington disease | 98/684 | 306/8465 | 2.85e-35 | 2.25e-33 | 1.72e-33 | 98 |
| hsa0019017 | Breast | Precancer | Oxidative phosphorylation | 59/684 | 134/8465 | 6.15e-30 | 3.24e-28 | 2.48e-28 | 59 |
| hsa0501017 | Breast | Precancer | Alzheimer disease | 103/684 | 384/8465 | 1.03e-29 | 4.66e-28 | 3.57e-28 | 103 |
| hsa0501417 | Breast | Precancer | Amyotrophic lateral sclerosis | 98/684 | 364/8465 | 2.13e-28 | 8.41e-27 | 6.44e-27 | 98 |
| hsa0502217 | Breast | Precancer | Pathways of neurodegeneration - multiple diseases | 112/684 | 476/8465 | 6.96e-27 | 2.44e-25 | 1.87e-25 | 112 |
| hsa0520819 | Breast | Precancer | Chemical carcinogenesis - reactive oxygen species | 68/684 | 223/8465 | 3.61e-23 | 1.14e-21 | 8.73e-22 | 68 |
| hsa0471419 | Breast | Precancer | Thermogenesis | 68/684 | 232/8465 | 4.40e-22 | 1.26e-20 | 9.69e-21 | 68 |
| hsa0541519 | Breast | Precancer | Diabetic cardiomyopathy | 63/684 | 203/8465 | 5.63e-22 | 1.48e-20 | 1.14e-20 | 63 |
| Page: 1 2 3 4 5 6 7 8 9 10 11 12 13 14 15 16 17 18 19 |
Top |
Cell-cell communication analysis |
| Identification of potential cell-cell interactions between two cell types and their ligand-receptor pairs for different disease states |
| Ligand | Receptor | LRpair | Pathway | Tissue | Disease Stage |
| Page: 1 |
Top |
Single-cell gene regulatory network inference analysis |
| Find out the significant the regulons (TFs) and the target genes of each regulon across cell types for different disease states |
| TF | Cell Type | Tissue | Disease Stage | Target Gene | RSS | Regulon Activity |
| ∗The dot plots of a searched regulon are shown for all cell subpopulations in each disease state of each tissue based on the regulon specific score inferred using pySCENIC and by calculating the average expression. |
| Page: 1 |
Top |
Somatic mutation of malignant transformation related genes |
| Annotation of somatic variants for genes involved in malignant transformation |
| Hugo Symbol | Variant Class | Variant Classification | dbSNP RS | HGVSc | HGVSp | HGVSp Short | SWISSPROT | BIOTYPE | SIFT | PolyPhen | Tumor Sample Barcode | Tissue | Histology | Sex | Age | Stage | Therapy Types | Drugs | Outcome |
| Page: 1 |
Top |
Related drugs of malignant transformation related genes |
| Identification of chemicals and drugs interact with genes involved in malignant transfromation |
| (DGIdb 4.0) |
| Entrez ID | Symbol | Category | Interaction Types | Drug Claim Name | Drug Name | PMIDs |
| Page: 1 |

Copyright 2023-Present -The University of Texas Health Science Center at Houston |