| Tissue | Expression Dynamics | Abbreviation |
| Cervix | 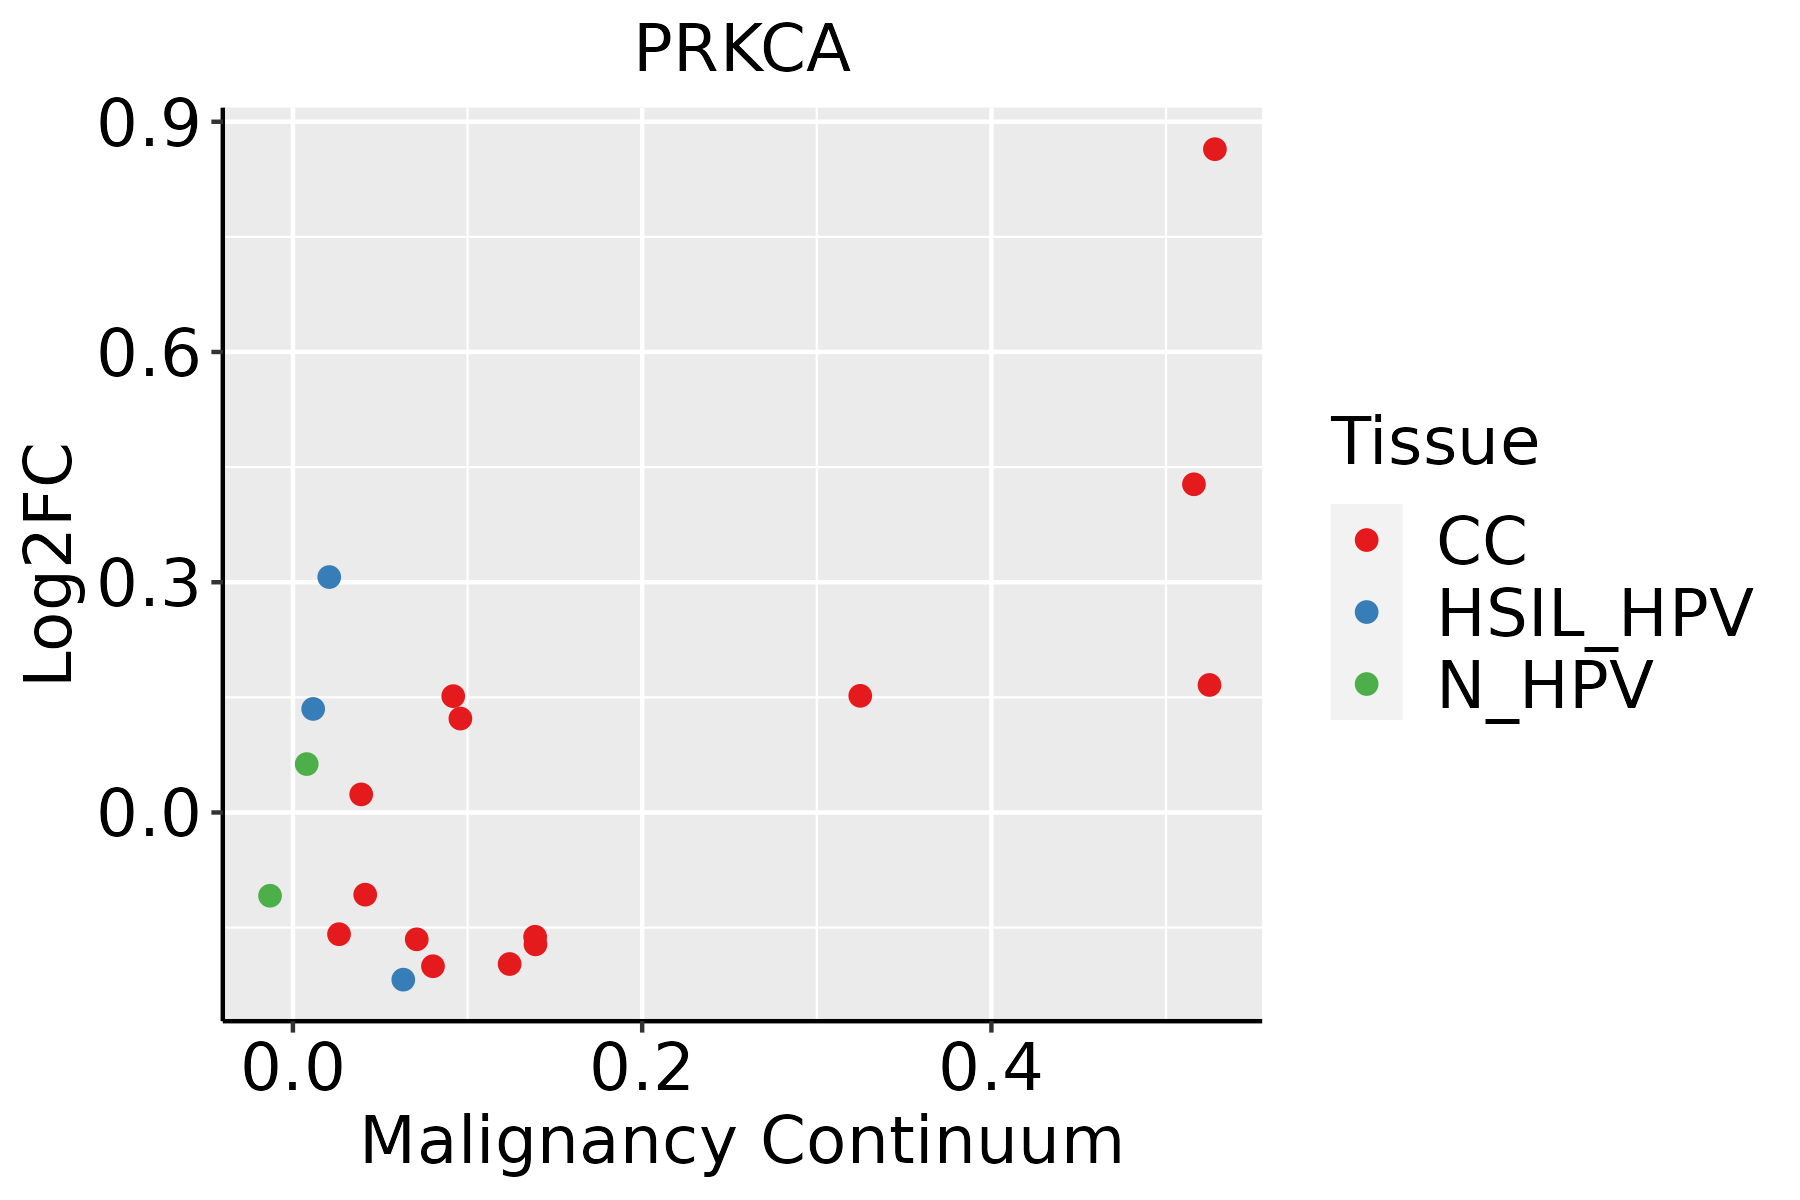 | CC: Cervix cancer |
| HSIL_HPV: HPV-infected high-grade squamous intraepithelial lesions |
| N_HPV: HPV-infected normal cervix |
| Colorectum (GSE201348) |  | FAP: Familial adenomatous polyposis |
| CRC: Colorectal cancer |
| Colorectum (HTA11) |  | AD: Adenomas |
| SER: Sessile serrated lesions |
| MSI-H: Microsatellite-high colorectal cancer |
| MSS: Microsatellite stable colorectal cancer |
| Endometrium |  | AEH: Atypical endometrial hyperplasia |
| EEC: Endometrioid Cancer |
| GC | 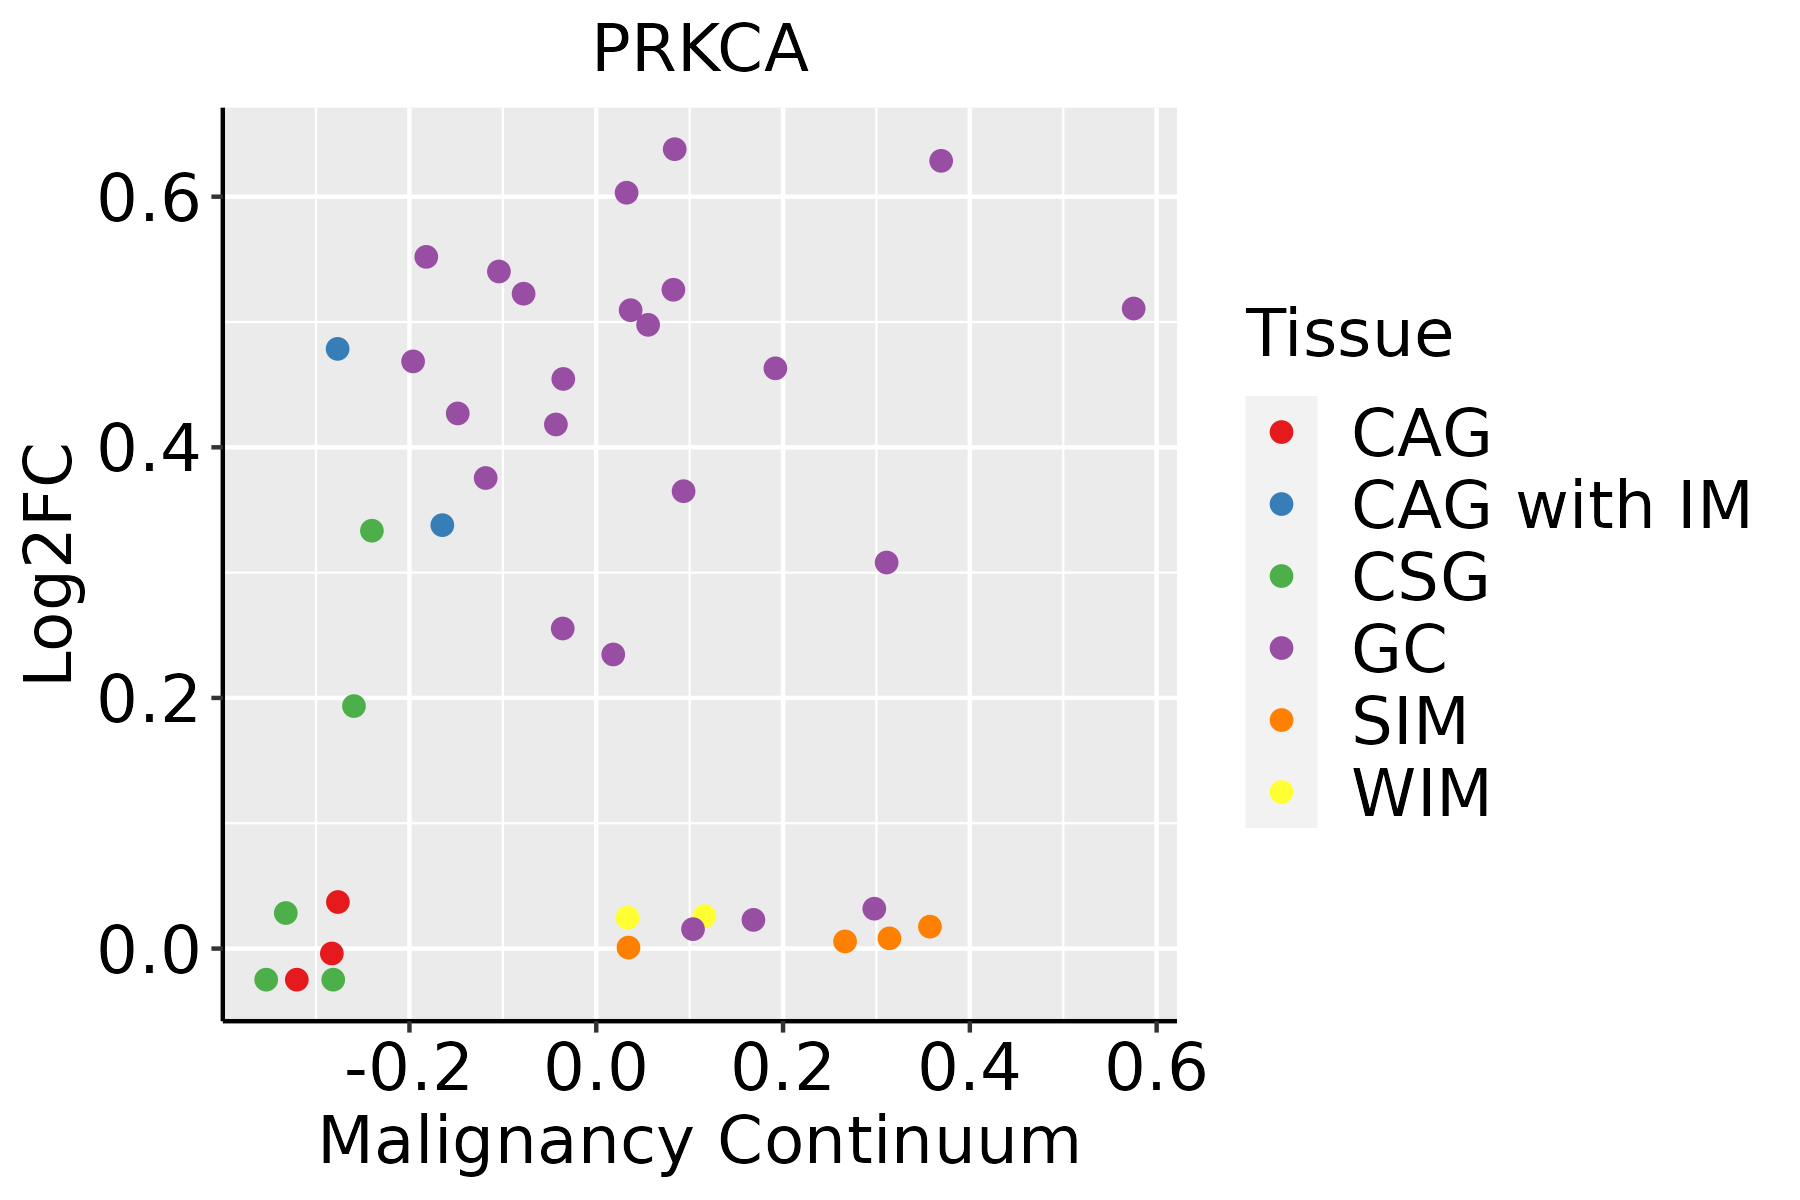 | CAG: Chronic atrophic gastritis |
| CAG with IM: Chronic atrophic gastritis with intestinal metaplasia |
| CSG: Chronic superficial gastritis |
| GC: Gastric cancer |
| SIM: Severe intestinal metaplasia |
| WIM: Wild intestinal metaplasia |
| Liver | 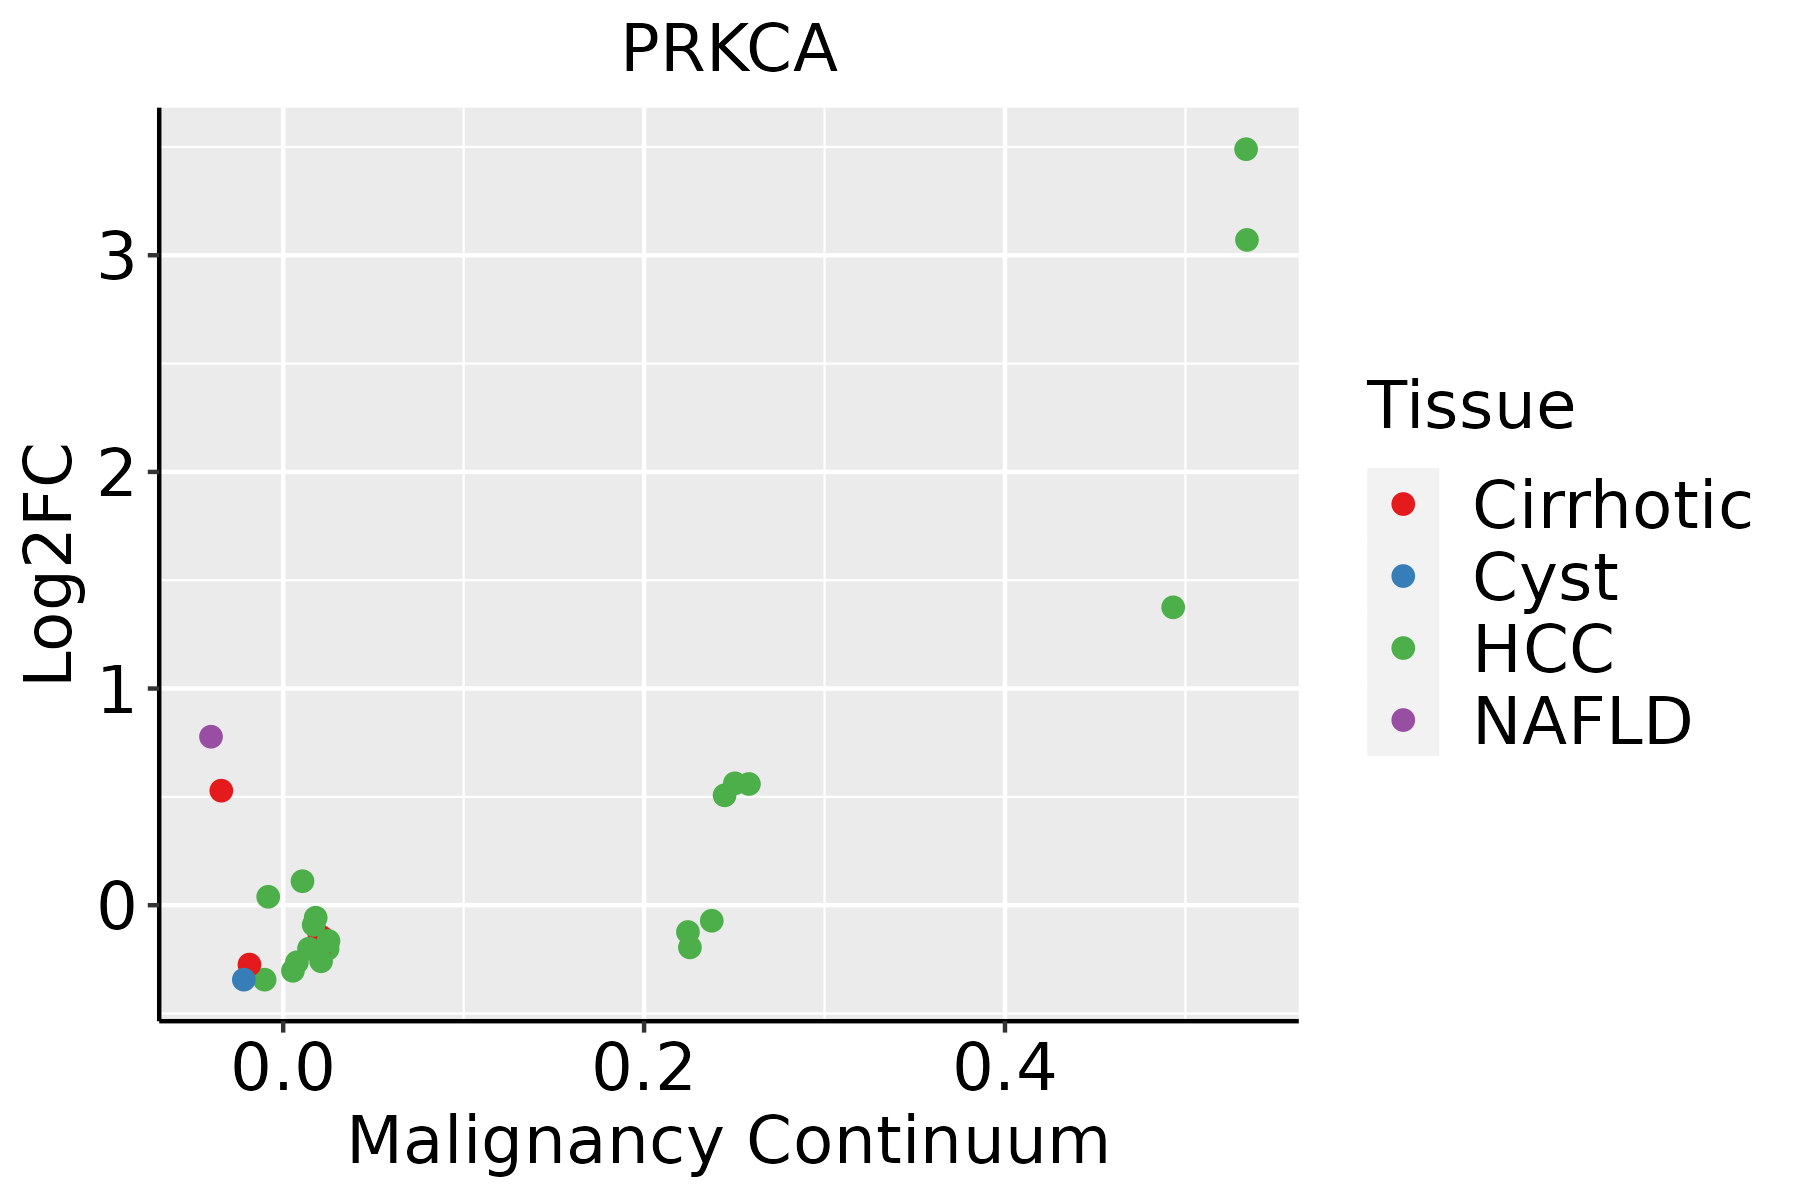 | HCC: Hepatocellular carcinoma |
| NAFLD: Non-alcoholic fatty liver disease |
| Lung | 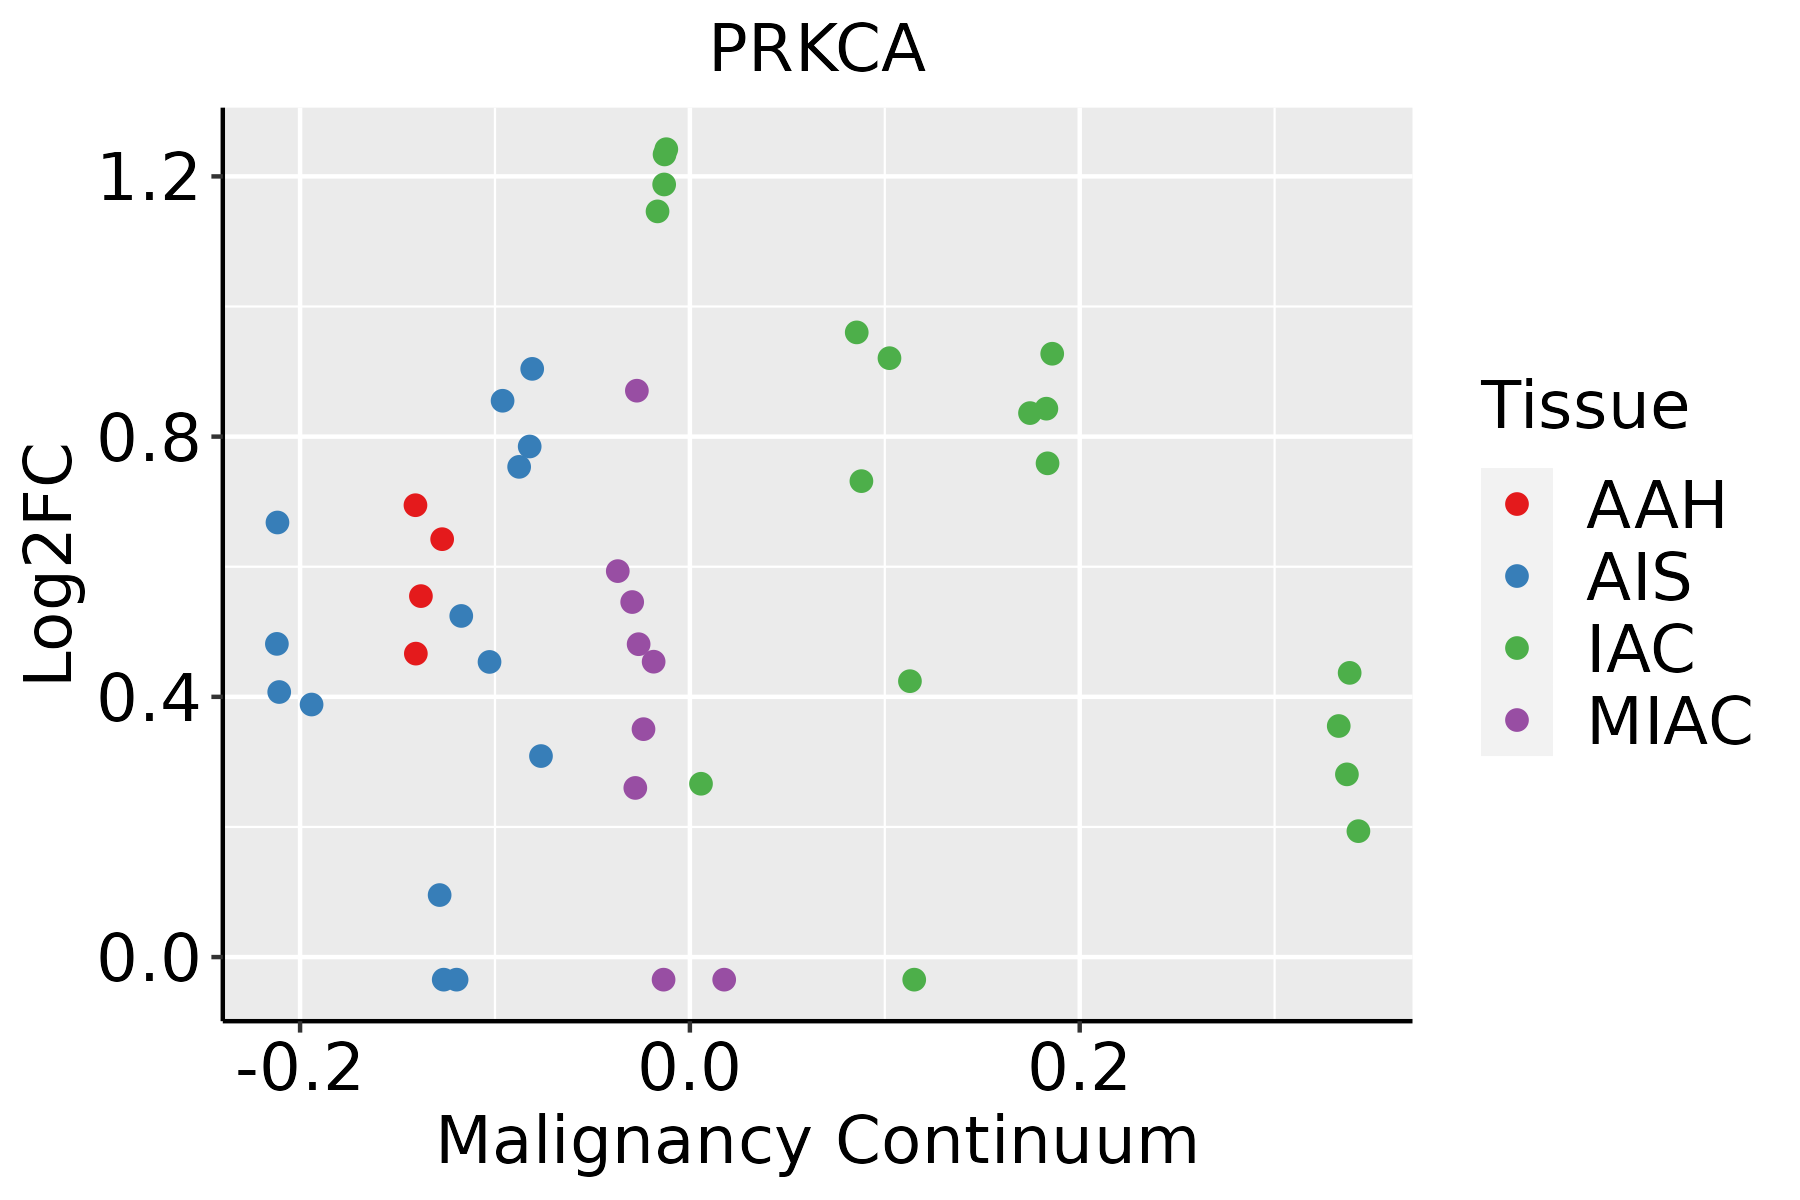 | AAH: Atypical adenomatous hyperplasia |
| AIS: Adenocarcinoma in situ |
| IAC: Invasive lung adenocarcinoma |
| MIA: Minimally invasive adenocarcinoma |
| Oral Cavity | 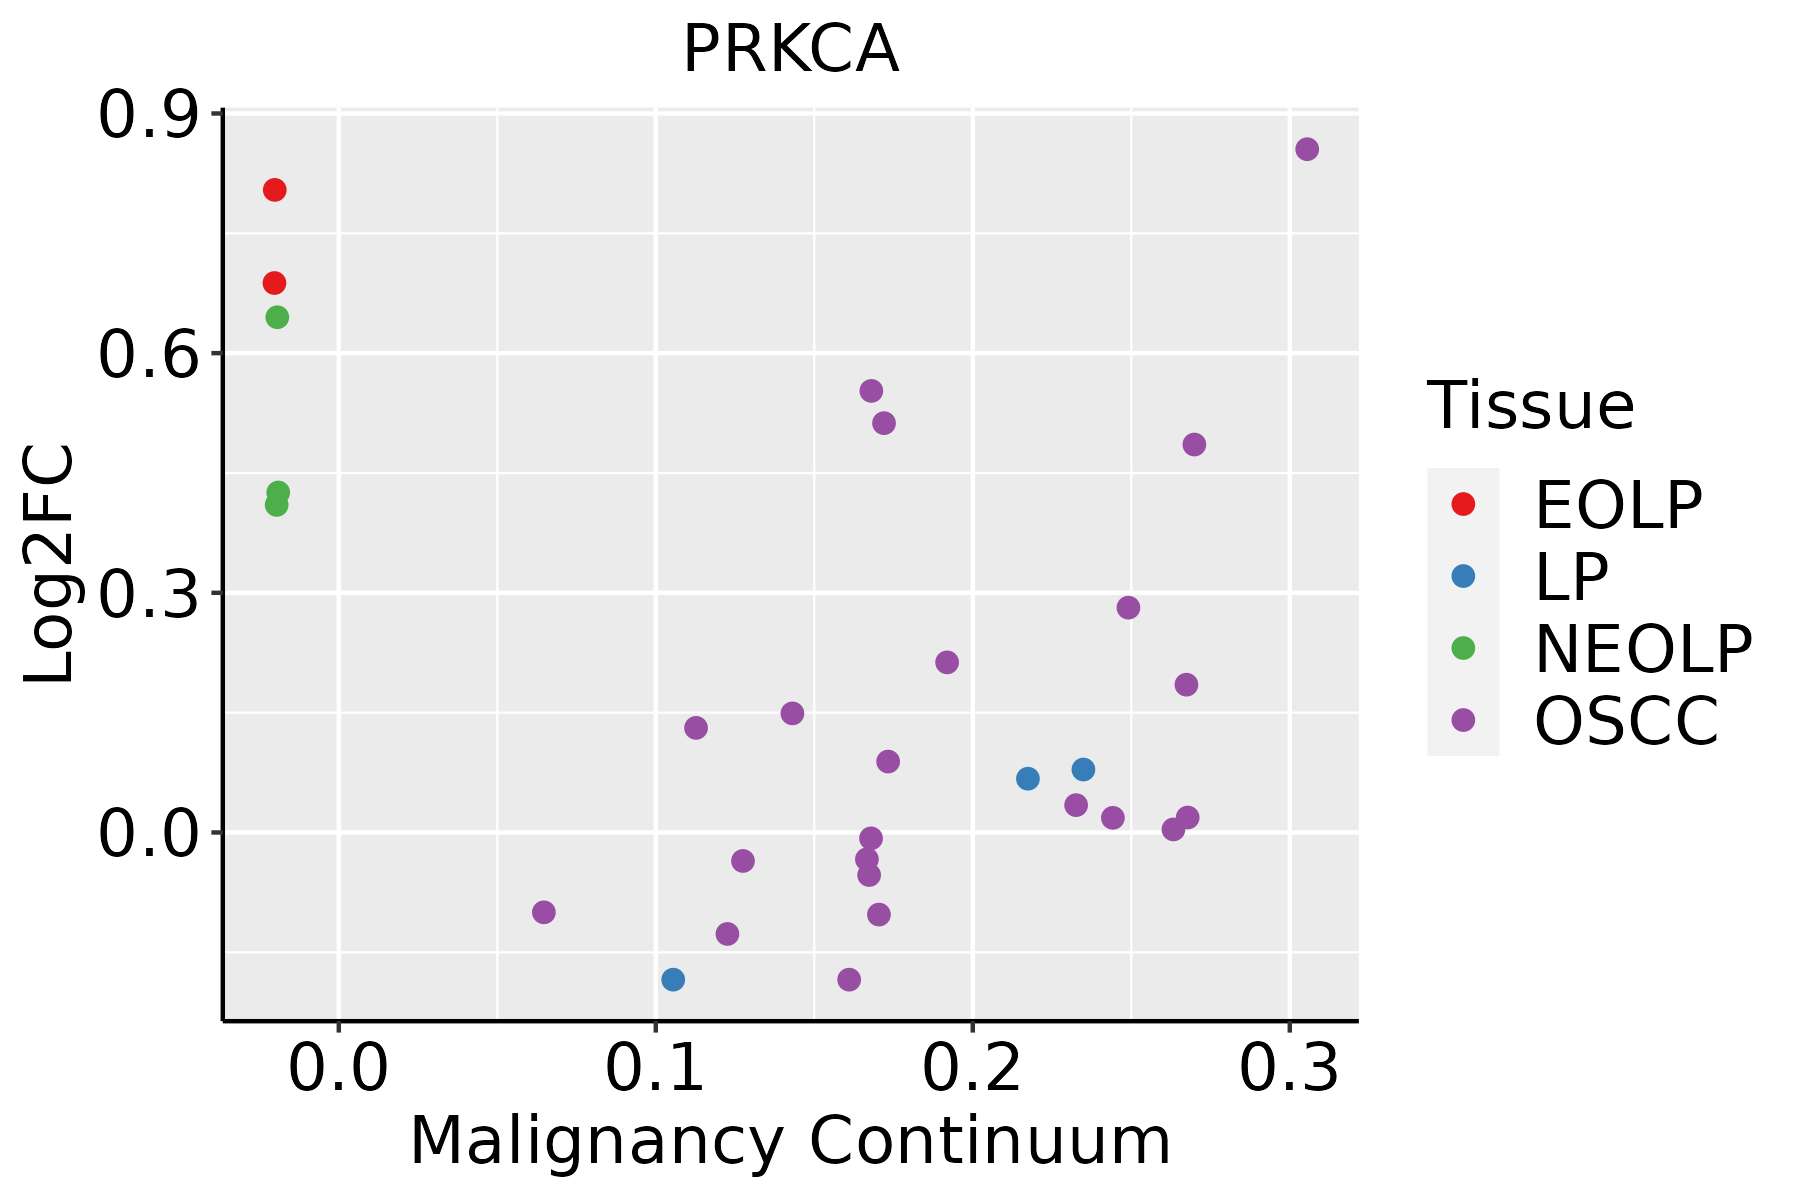 | EOLP: Erosive Oral lichen planus |
| LP: leukoplakia |
| NEOLP: Non-erosive oral lichen planus |
| OSCC: Oral squamous cell carcinoma |
| Prostate |  | BPH: Benign Prostatic Hyperplasia |
| Skin |  | AK: Actinic keratosis |
| cSCC: Cutaneous squamous cell carcinoma |
| SCCIS:squamous cell carcinoma in situ |
| Thyroid | 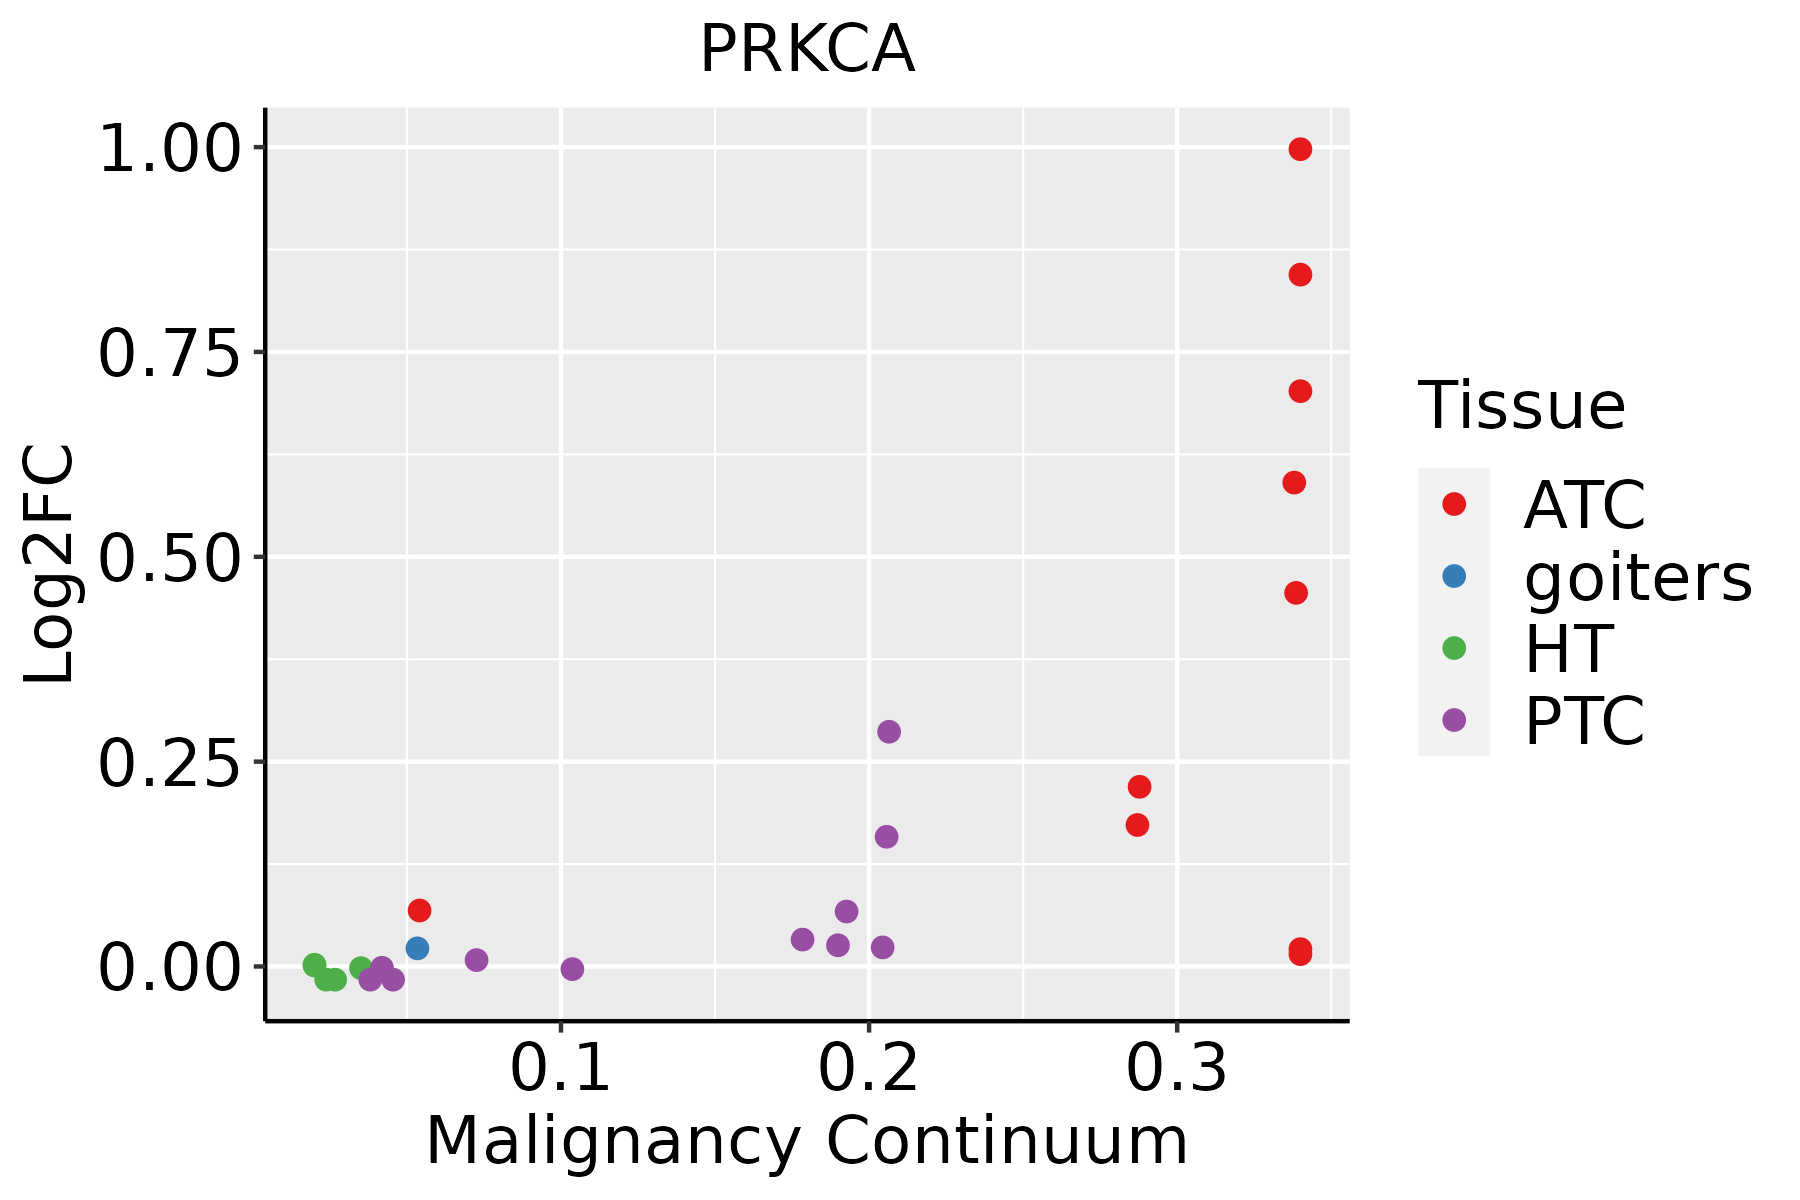 | ATC: Anaplastic thyroid cancer |
| HT: Hashimoto's thyroiditis |
| PTC: Papillary thyroid cancer |
| GO ID | Tissue | Disease Stage | Description | Gene Ratio | Bg Ratio | pvalue | p.adjust | Count |
| GO:003210323 | Oral cavity | NEOLP | positive regulation of response to external stimulus | 81/2005 | 427/18723 | 2.04e-07 | 6.74e-06 | 81 |
| GO:000283131 | Oral cavity | NEOLP | regulation of response to biotic stimulus | 65/2005 | 327/18723 | 5.93e-07 | 1.74e-05 | 65 |
| GO:007052722 | Oral cavity | NEOLP | platelet aggregation | 22/2005 | 67/18723 | 9.16e-07 | 2.46e-05 | 22 |
| GO:004348732 | Oral cavity | NEOLP | regulation of RNA stability | 40/2005 | 170/18723 | 1.20e-06 | 3.12e-05 | 40 |
| GO:005081722 | Oral cavity | NEOLP | coagulation | 48/2005 | 222/18723 | 1.51e-06 | 3.77e-05 | 48 |
| GO:002240724 | Oral cavity | NEOLP | regulation of cell-cell adhesion | 81/2005 | 448/18723 | 1.54e-06 | 3.83e-05 | 81 |
| GO:000759621 | Oral cavity | NEOLP | blood coagulation | 47/2005 | 217/18723 | 1.84e-06 | 4.44e-05 | 47 |
| GO:003249631 | Oral cavity | NEOLP | response to lipopolysaccharide | 65/2005 | 343/18723 | 3.30e-06 | 7.40e-05 | 65 |
| GO:000759921 | Oral cavity | NEOLP | hemostasis | 47/2005 | 222/18723 | 3.57e-06 | 7.85e-05 | 47 |
| GO:005087825 | Oral cavity | NEOLP | regulation of body fluid levels | 70/2005 | 379/18723 | 3.62e-06 | 7.94e-05 | 70 |
| GO:004354215 | Oral cavity | NEOLP | endothelial cell migration | 55/2005 | 279/18723 | 5.51e-06 | 1.13e-04 | 55 |
| GO:000223731 | Oral cavity | NEOLP | response to molecule of bacterial origin | 67/2005 | 363/18723 | 5.94e-06 | 1.20e-04 | 67 |
| GO:003465531 | Oral cavity | NEOLP | nucleobase-containing compound catabolic process | 73/2005 | 407/18723 | 6.69e-06 | 1.34e-04 | 73 |
| GO:004593131 | Oral cavity | NEOLP | positive regulation of mitotic cell cycle | 30/2005 | 121/18723 | 8.28e-06 | 1.60e-04 | 30 |
| GO:001063223 | Oral cavity | NEOLP | regulation of epithelial cell migration | 56/2005 | 292/18723 | 1.07e-05 | 1.98e-04 | 56 |
| GO:190370632 | Oral cavity | NEOLP | regulation of hemopoiesis | 66/2005 | 367/18723 | 1.67e-05 | 2.83e-04 | 66 |
| GO:000704318 | Oral cavity | NEOLP | cell-cell junction assembly | 33/2005 | 146/18723 | 2.42e-05 | 3.84e-04 | 33 |
| GO:001810722 | Oral cavity | NEOLP | peptidyl-threonine phosphorylation | 28/2005 | 116/18723 | 2.78e-05 | 4.31e-04 | 28 |
| GO:003016812 | Oral cavity | NEOLP | platelet activation | 29/2005 | 123/18723 | 3.23e-05 | 4.84e-04 | 29 |
| GO:001063424 | Oral cavity | NEOLP | positive regulation of epithelial cell migration | 37/2005 | 176/18723 | 4.37e-05 | 6.14e-04 | 37 |
| Pathway ID | Tissue | Disease Stage | Description | Gene Ratio | Bg Ratio | pvalue | p.adjust | qvalue | Count |
| hsa0517120 | Cervix | CC | Coronavirus disease - COVID-19 | 111/1267 | 232/8465 | 1.82e-33 | 5.90e-31 | 3.49e-31 | 111 |
| hsa0541520 | Cervix | CC | Diabetic cardiomyopathy | 76/1267 | 203/8465 | 1.40e-15 | 6.46e-14 | 3.82e-14 | 76 |
| hsa0502218 | Cervix | CC | Pathways of neurodegeneration - multiple diseases | 128/1267 | 476/8465 | 2.87e-12 | 9.29e-11 | 5.50e-11 | 128 |
| hsa0541720 | Cervix | CC | Lipid and atherosclerosis | 65/1267 | 215/8465 | 6.47e-09 | 1.10e-07 | 6.52e-08 | 65 |
| hsa0516318 | Cervix | CC | Human cytomegalovirus infection | 65/1267 | 225/8465 | 4.59e-08 | 6.47e-07 | 3.83e-07 | 65 |
| hsa0520516 | Cervix | CC | Proteoglycans in cancer | 60/1267 | 205/8465 | 9.13e-08 | 1.18e-06 | 7.00e-07 | 60 |
| hsa0451010 | Cervix | CC | Focal adhesion | 59/1267 | 203/8465 | 1.53e-07 | 1.84e-06 | 1.09e-06 | 59 |
| hsa0467020 | Cervix | CC | Leukocyte transendothelial migration | 36/1267 | 114/8465 | 5.22e-06 | 4.83e-05 | 2.86e-05 | 36 |
| hsa0401512 | Cervix | CC | Rap1 signaling pathway | 56/1267 | 210/8465 | 6.23e-06 | 5.61e-05 | 3.32e-05 | 56 |
| hsa0466612 | Cervix | CC | Fc gamma R-mediated phagocytosis | 31/1267 | 97/8465 | 1.78e-05 | 1.42e-04 | 8.40e-05 | 31 |
| hsa0472318 | Cervix | CC | Retrograde endocannabinoid signaling | 42/1267 | 148/8465 | 1.79e-05 | 1.42e-04 | 8.40e-05 | 42 |
| hsa0517016 | Cervix | CC | Human immunodeficiency virus 1 infection | 55/1267 | 212/8465 | 1.80e-05 | 1.42e-04 | 8.40e-05 | 55 |
| hsa0401210 | Cervix | CC | ErbB signaling pathway | 28/1267 | 85/8465 | 2.40e-05 | 1.82e-04 | 1.08e-04 | 28 |
| hsa0407110 | Cervix | CC | Sphingolipid signaling pathway | 35/1267 | 121/8465 | 5.70e-05 | 3.93e-04 | 2.32e-04 | 35 |
| hsa043609 | Cervix | CC | Axon guidance | 47/1267 | 182/8465 | 8.13e-05 | 5.38e-04 | 3.18e-04 | 47 |
| hsa052148 | Cervix | CC | Glioma | 24/1267 | 75/8465 | 1.51e-04 | 9.20e-04 | 5.44e-04 | 24 |
| hsa0511016 | Cervix | CC | Vibrio cholerae infection | 18/1267 | 50/8465 | 1.91e-04 | 1.11e-03 | 6.55e-04 | 18 |
| hsa04664 | Cervix | CC | Fc epsilon RI signaling pathway | 22/1267 | 68/8465 | 2.35e-04 | 1.31e-03 | 7.77e-04 | 22 |
| hsa043109 | Cervix | CC | Wnt signaling pathway | 43/1267 | 171/8465 | 3.03e-04 | 1.64e-03 | 9.68e-04 | 43 |
| hsa0516414 | Cervix | CC | Influenza A | 43/1267 | 171/8465 | 3.03e-04 | 1.64e-03 | 9.68e-04 | 43 |
| Hugo Symbol | Variant Class | Variant Classification | dbSNP RS | HGVSc | HGVSp | HGVSp Short | SWISSPROT | BIOTYPE | SIFT | PolyPhen | Tumor Sample Barcode | Tissue | Histology | Sex | Age | Stage | Therapy Types | Drugs | Outcome |
| PRKCA | SNV | Missense_Mutation | novel | c.756N>T | p.Arg252Ser | p.R252S | P17252 | protein_coding | tolerated(0.14) | benign(0.1) | TCGA-A2-A25A-01 | Breast | breast invasive carcinoma | Female | <65 | I/II | Unspecific | Cytoxan | SD |
| PRKCA | SNV | Missense_Mutation | rs776243082 | c.430N>A | p.Val144Ile | p.V144I | P17252 | protein_coding | tolerated(0.19) | benign(0.059) | TCGA-A8-A06O-01 | Breast | breast invasive carcinoma | Female | <65 | I/II | Hormone Therapy | letrozole | SD |
| PRKCA | SNV | Missense_Mutation | novel | c.1621N>A | p.Glu541Lys | p.E541K | P17252 | protein_coding | deleterious(0.01) | benign(0.397) | TCGA-AN-A0FZ-01 | Breast | breast invasive carcinoma | Female | <65 | III/IV | Unknown | Unknown | SD |
| PRKCA | insertion | Frame_Shift_Ins | novel | c.788_789insGGCA | p.Ser264AlafsTer17 | p.S264Afs*17 | P17252 | protein_coding | | | TCGA-AO-A0JF-01 | Breast | breast invasive carcinoma | Female | >=65 | I/II | Chemotherapy | doxorubicin | SD |
| PRKCA | insertion | Frame_Shift_Ins | novel | c.789_790insGATCTCAGCTCACTGCAGCCTCCGCC | p.Ser264AspfsTer12 | p.S264Dfs*12 | P17252 | protein_coding | | | TCGA-AO-A0JF-01 | Breast | breast invasive carcinoma | Female | >=65 | I/II | Chemotherapy | doxorubicin | SD |
| PRKCA | insertion | Nonsense_Mutation | novel | c.353_354insAATGATCCATTTAGGGTTGTTCTGTTCACTTCACAAACACACCGATT | p.Cys118Ter | p.C118* | P17252 | protein_coding | | | TCGA-BH-A1FD-01 | Breast | breast invasive carcinoma | Female | >=65 | I/II | Unknown | Unknown | PD |
| PRKCA | SNV | Missense_Mutation | novel | c.1663N>A | p.Val555Ile | p.V555I | P17252 | protein_coding | tolerated(0.07) | benign(0.213) | TCGA-HM-A3JJ-01 | Cervix | cervical & endocervical cancer | Female | <65 | I/II | Chemotherapy | cisplatin | PD |
| PRKCA | SNV | Missense_Mutation | rs140466753 | c.1895G>A | p.Arg632Gln | p.R632Q | P17252 | protein_coding | tolerated(0.07) | benign(0.029) | TCGA-IR-A3LL-01 | Cervix | cervical & endocervical cancer | Female | <65 | I/II | Chemotherapy | cisplatin | CR |
| PRKCA | SNV | Missense_Mutation | novel | c.1627G>A | p.Glu543Lys | p.E543K | P17252 | protein_coding | deleterious(0) | probably_damaging(0.997) | TCGA-JW-A5VL-01 | Cervix | cervical & endocervical cancer | Female | <65 | I/II | Unknown | Unknown | SD |
| PRKCA | SNV | Missense_Mutation | | c.916N>A | p.Glu306Lys | p.E306K | P17252 | protein_coding | tolerated(0.15) | benign(0.014) | TCGA-UC-A7PF-01 | Cervix | cervical & endocervical cancer | Female | <65 | I/II | Unknown | Unknown | SD |
| Entrez ID | Symbol | Category | Interaction Types | Drug Claim Name | Drug Name | PMIDs |
| 5578 | PRKCA | DRUGGABLE GENOME, KINASE, SERINE THREONINE KINASE, CLINICALLY ACTIONABLE, ENZYME | inhibitor | 178102320 | ENZASTAURIN | |
| 5578 | PRKCA | DRUGGABLE GENOME, KINASE, SERINE THREONINE KINASE, CLINICALLY ACTIONABLE, ENZYME | | BRYOSTATIN | BRYOSTATIN | 22579485 |
| 5578 | PRKCA | DRUGGABLE GENOME, KINASE, SERINE THREONINE KINASE, CLINICALLY ACTIONABLE, ENZYME | inhibitor | SOPHORETIN | QUERCETIN | |
| 5578 | PRKCA | DRUGGABLE GENOME, KINASE, SERINE THREONINE KINASE, CLINICALLY ACTIONABLE, ENZYME | | Sodium phenylbutyrate | | |
| 5578 | PRKCA | DRUGGABLE GENOME, KINASE, SERINE THREONINE KINASE, CLINICALLY ACTIONABLE, ENZYME | inhibitor | 178101880 | | |
| 5578 | PRKCA | DRUGGABLE GENOME, KINASE, SERINE THREONINE KINASE, CLINICALLY ACTIONABLE, ENZYME | | hydrochlorothiazide | HYDROCHLOROTHIAZIDE | |
| 5578 | PRKCA | DRUGGABLE GENOME, KINASE, SERINE THREONINE KINASE, CLINICALLY ACTIONABLE, ENZYME | inhibitor | MIDOSTAURIN | MIDOSTAURIN | |
| 5578 | PRKCA | DRUGGABLE GENOME, KINASE, SERINE THREONINE KINASE, CLINICALLY ACTIONABLE, ENZYME | | BRYOSTATIN-1 | | |
| 5578 | PRKCA | DRUGGABLE GENOME, KINASE, SERINE THREONINE KINASE, CLINICALLY ACTIONABLE, ENZYME | inhibitor | 178102596 | | |
| 5578 | PRKCA | DRUGGABLE GENOME, KINASE, SERINE THREONINE KINASE, CLINICALLY ACTIONABLE, ENZYME | | ENOXOLONE | ENOXOLONE | 24461294 |


