| Tissue | Expression Dynamics | Abbreviation |
| Colorectum (GSE201348) |  | FAP: Familial adenomatous polyposis |
| CRC: Colorectal cancer |
| Colorectum (HTA11) | 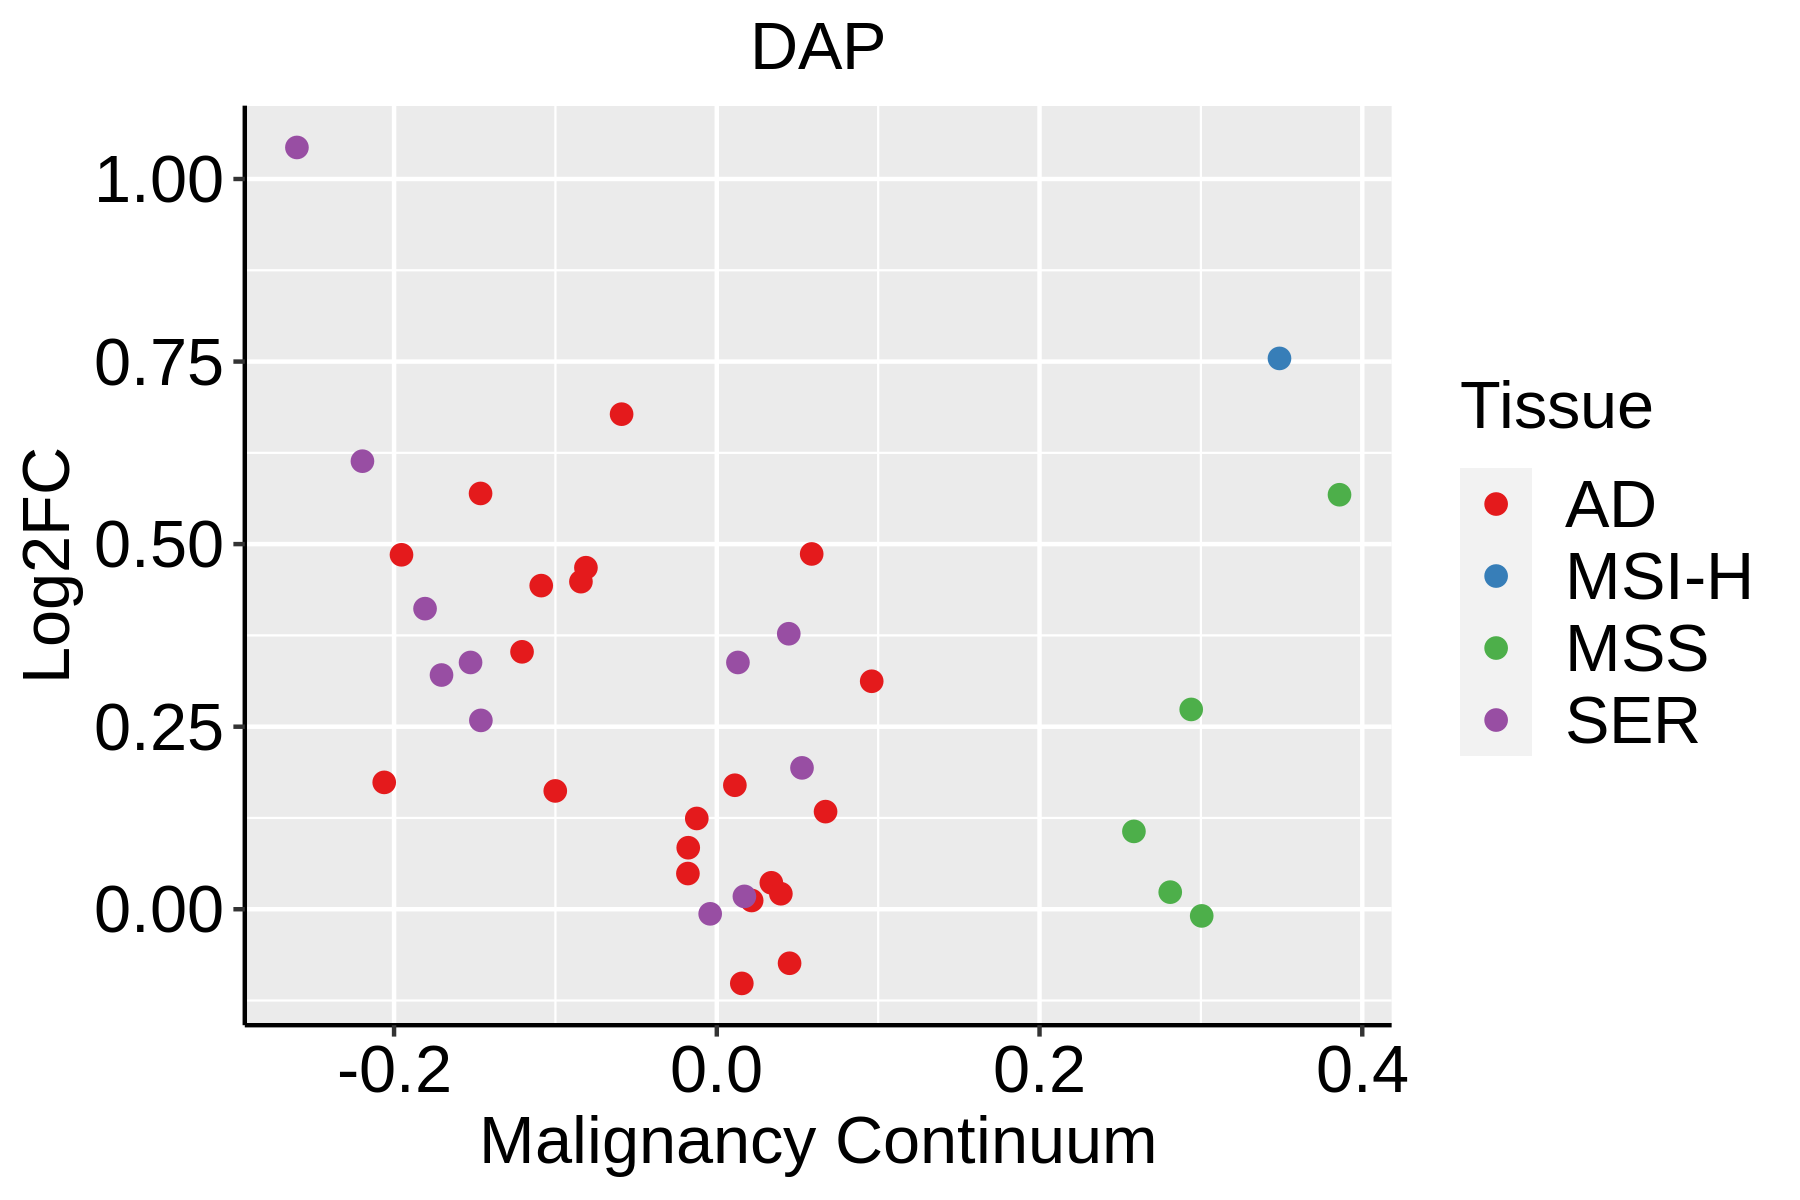 | AD: Adenomas |
| SER: Sessile serrated lesions |
| MSI-H: Microsatellite-high colorectal cancer |
| MSS: Microsatellite stable colorectal cancer |
| Esophagus |  | ESCC: Esophageal squamous cell carcinoma |
| HGIN: High-grade intraepithelial neoplasias |
| LGIN: Low-grade intraepithelial neoplasias |
| Liver | 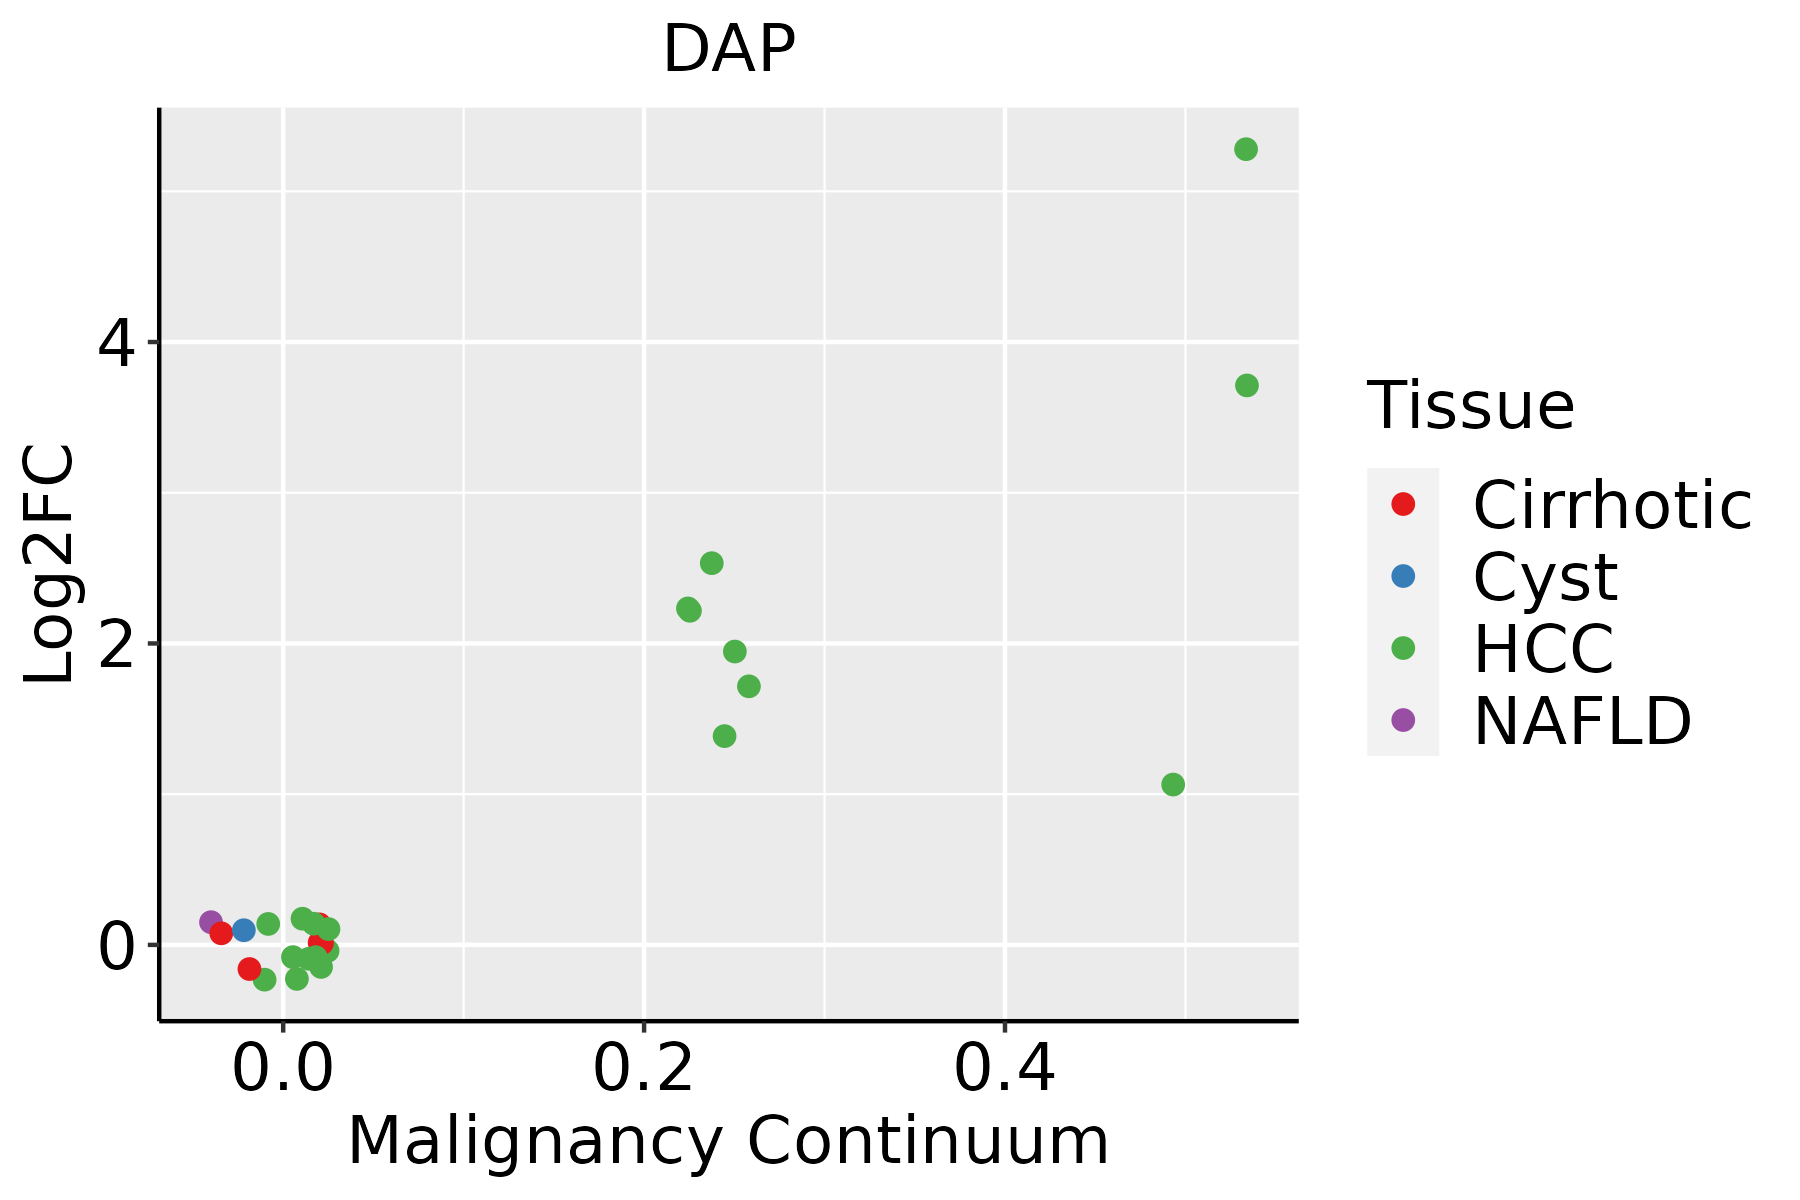 | HCC: Hepatocellular carcinoma |
| NAFLD: Non-alcoholic fatty liver disease |
| Lung |  | AAH: Atypical adenomatous hyperplasia |
| AIS: Adenocarcinoma in situ |
| IAC: Invasive lung adenocarcinoma |
| MIA: Minimally invasive adenocarcinoma |
| Oral Cavity | 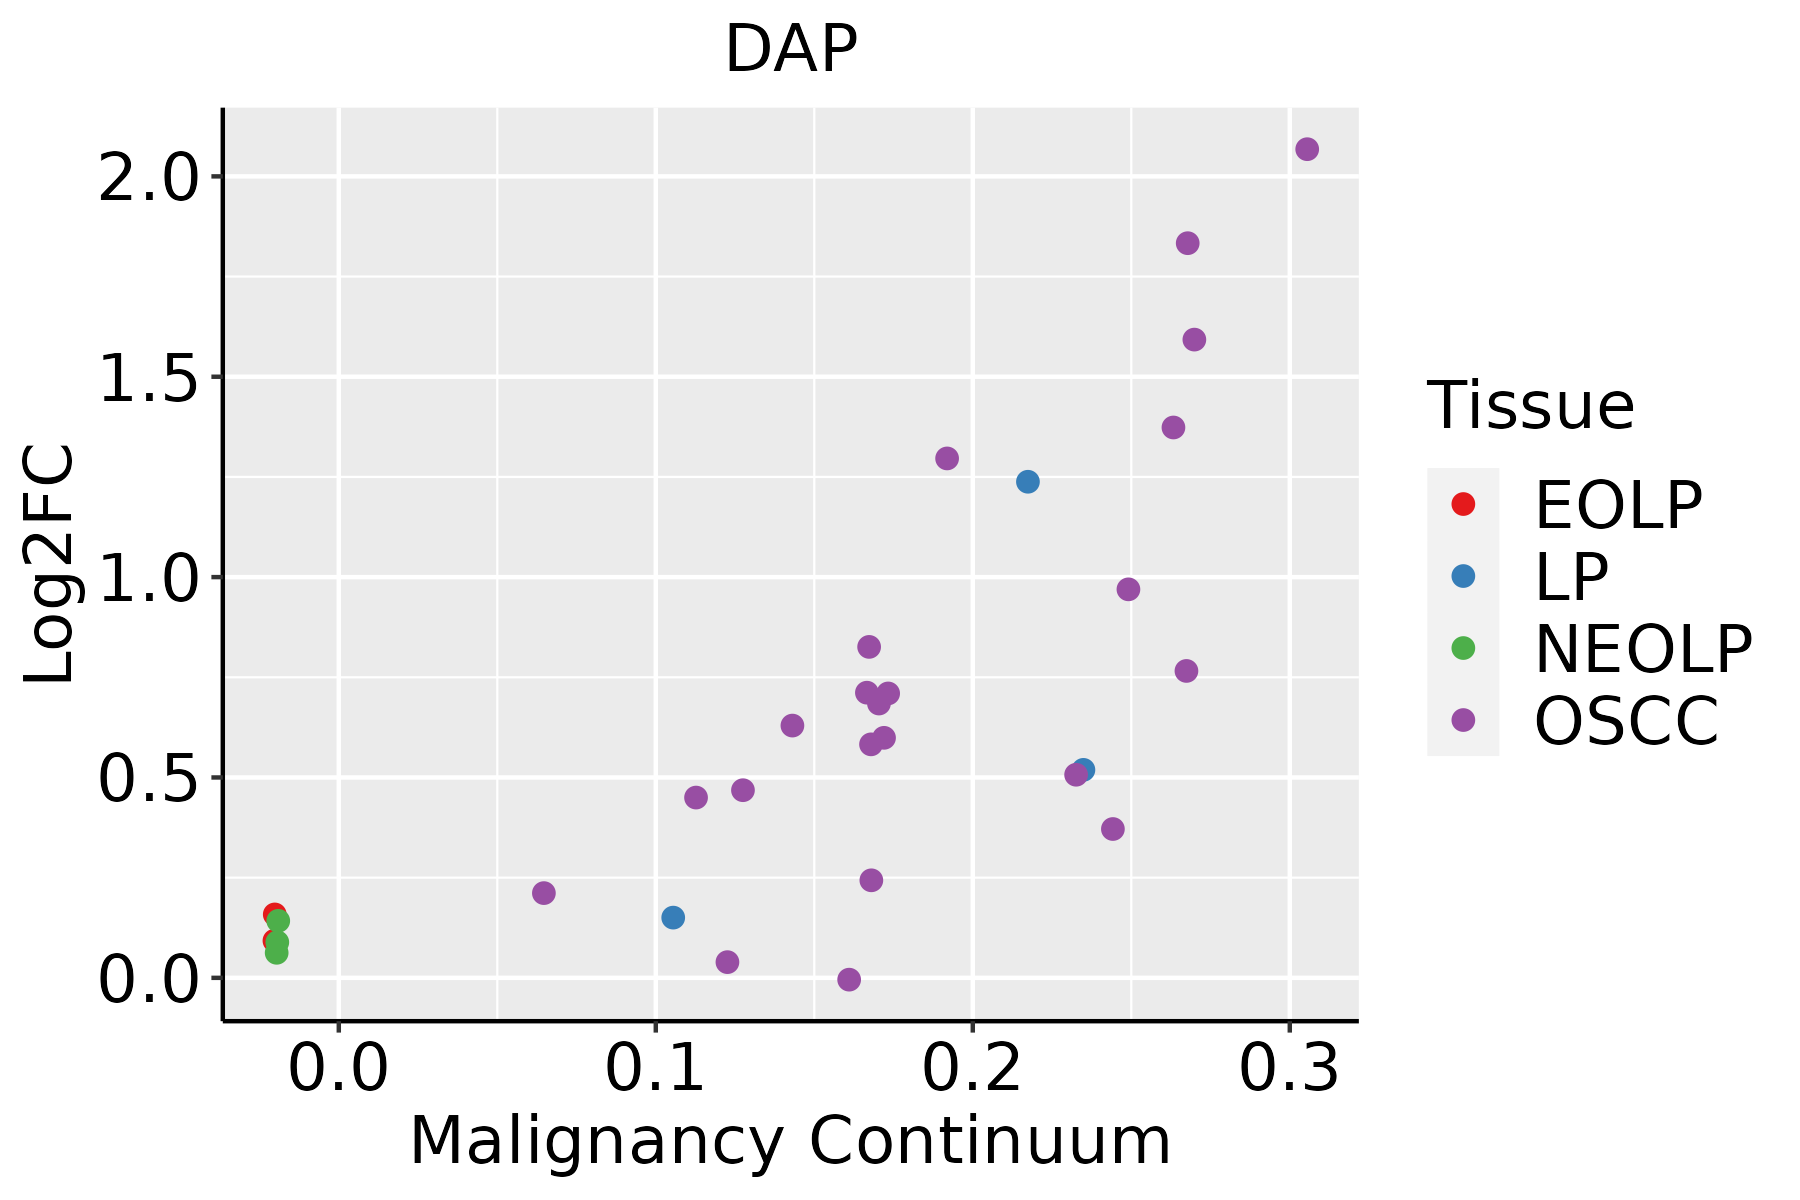 | EOLP: Erosive Oral lichen planus |
| LP: leukoplakia |
| NEOLP: Non-erosive oral lichen planus |
| OSCC: Oral squamous cell carcinoma |
| Skin | 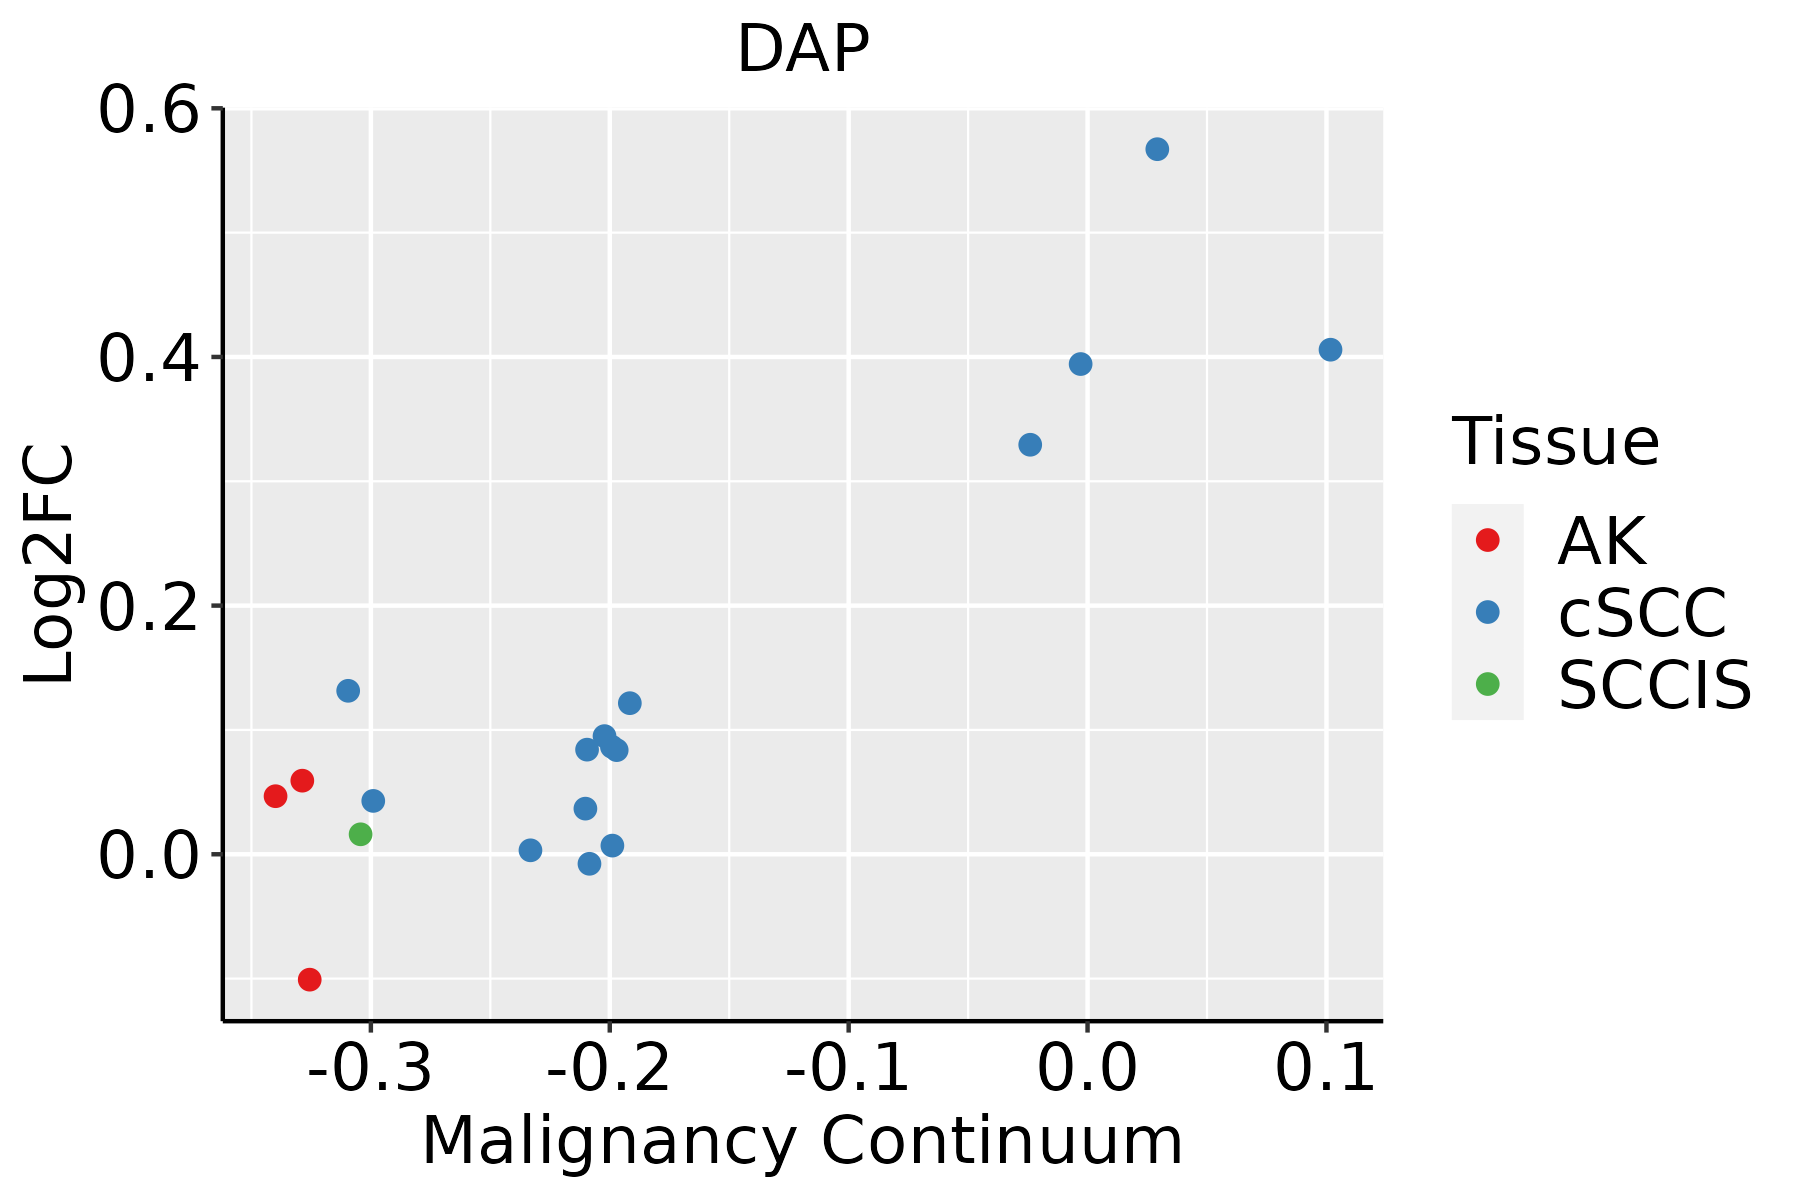 | AK: Actinic keratosis |
| cSCC: Cutaneous squamous cell carcinoma |
| SCCIS:squamous cell carcinoma in situ |
| Thyroid |  | ATC: Anaplastic thyroid cancer |
| HT: Hashimoto's thyroiditis |
| PTC: Papillary thyroid cancer |
| GO ID | Tissue | Disease Stage | Description | Gene Ratio | Bg Ratio | pvalue | p.adjust | Count |
| GO:000704425 | Skin | cSCC | cell-substrate junction assembly | 48/4864 | 95/18723 | 2.57e-07 | 5.33e-06 | 48 |
| GO:200123628 | Skin | cSCC | regulation of extrinsic apoptotic signaling pathway | 68/4864 | 151/18723 | 3.01e-07 | 6.12e-06 | 68 |
| GO:009719128 | Skin | cSCC | extrinsic apoptotic signaling pathway | 91/4864 | 219/18723 | 3.31e-07 | 6.63e-06 | 91 |
| GO:015011625 | Skin | cSCC | regulation of cell-substrate junction organization | 37/4864 | 71/18723 | 2.28e-06 | 3.70e-05 | 37 |
| GO:001605524 | Skin | cSCC | Wnt signaling pathway | 158/4864 | 444/18723 | 3.80e-06 | 5.70e-05 | 158 |
| GO:000195224 | Skin | cSCC | regulation of cell-matrix adhesion | 57/4864 | 128/18723 | 4.07e-06 | 6.07e-05 | 57 |
| GO:001081027 | Skin | cSCC | regulation of cell-substrate adhesion | 88/4864 | 221/18723 | 4.26e-06 | 6.32e-05 | 88 |
| GO:000632519 | Skin | cSCC | chromatin organization | 147/4864 | 409/18723 | 4.41e-06 | 6.52e-05 | 147 |
| GO:0010950112 | Skin | cSCC | positive regulation of endopeptidase activity | 74/4864 | 179/18723 | 4.98e-06 | 7.25e-05 | 74 |
| GO:019873824 | Skin | cSCC | cell-cell signaling by wnt | 158/4864 | 446/18723 | 5.08e-06 | 7.38e-05 | 158 |
| GO:003424915 | Skin | cSCC | negative regulation of cellular amide metabolic process | 104/4864 | 273/18723 | 6.44e-06 | 9.00e-05 | 104 |
| GO:005189324 | Skin | cSCC | regulation of focal adhesion assembly | 34/4864 | 66/18723 | 8.09e-06 | 1.09e-04 | 34 |
| GO:009010924 | Skin | cSCC | regulation of cell-substrate junction assembly | 34/4864 | 66/18723 | 8.09e-06 | 1.09e-04 | 34 |
| GO:200123822 | Skin | cSCC | positive regulation of extrinsic apoptotic signaling pathway | 27/4864 | 48/18723 | 8.24e-06 | 1.10e-04 | 27 |
| GO:003297029 | Skin | cSCC | regulation of actin filament-based process | 142/4864 | 397/18723 | 8.50e-06 | 1.13e-04 | 142 |
| GO:002260427 | Skin | cSCC | regulation of cell morphogenesis | 114/4864 | 309/18723 | 1.34e-05 | 1.68e-04 | 114 |
| GO:003166825 | Skin | cSCC | cellular response to extracellular stimulus | 94/4864 | 246/18723 | 1.52e-05 | 1.87e-04 | 94 |
| GO:004804124 | Skin | cSCC | focal adhesion assembly | 41/4864 | 87/18723 | 1.71e-05 | 2.07e-04 | 41 |
| GO:003158926 | Skin | cSCC | cell-substrate adhesion | 130/4864 | 363/18723 | 1.87e-05 | 2.23e-04 | 130 |
| GO:001714814 | Skin | cSCC | negative regulation of translation | 93/4864 | 245/18723 | 2.28e-05 | 2.63e-04 | 93 |
| Hugo Symbol | Variant Class | Variant Classification | dbSNP RS | HGVSc | HGVSp | HGVSp Short | SWISSPROT | BIOTYPE | SIFT | PolyPhen | Tumor Sample Barcode | Tissue | Histology | Sex | Age | Stage | Therapy Types | Drugs | Outcome |
| DAP | SNV | Missense_Mutation | | c.235G>C | p.Glu79Gln | p.E79Q | | protein_coding | deleterious_low_confidence(0.02) | benign(0.015) | TCGA-E2-A1IN-01 | Breast | breast invasive carcinoma | Female | <65 | I/II | Hormone Therapy | arimidex | SD |
| DAP | SNV | Missense_Mutation | rs753757154 | c.278N>C | p.His93Pro | p.H93P | | protein_coding | deleterious_low_confidence(0) | benign(0.01) | TCGA-E2-A1L8-01 | Breast | breast invasive carcinoma | Female | <65 | I/II | Chemotherapy | cyclophosphamide | SD |
| DAP | SNV | Missense_Mutation | rs77265616 | c.173G>A | p.Arg58Gln | p.R58Q | | protein_coding | tolerated_low_confidence(0.08) | benign(0.029) | TCGA-5M-AAT4-01 | Colorectum | colon adenocarcinoma | Male | >=65 | III/IV | Unknown | Unknown | PD |
| DAP | SNV | Missense_Mutation | rs759102630 | c.127N>A | p.Asp43Asn | p.D43N | | protein_coding | deleterious_low_confidence(0.01) | probably_damaging(0.984) | TCGA-AZ-4315-01 | Colorectum | colon adenocarcinoma | Male | <65 | I/II | Unknown | Unknown | SD |
| DAP | SNV | Missense_Mutation | novel | c.167C>T | p.Ser56Phe | p.S56F | | protein_coding | deleterious_low_confidence(0) | benign(0.036) | TCGA-NH-A5IV-01 | Colorectum | colon adenocarcinoma | Female | >=65 | I/II | Unknown | Unknown | SD |
| DAP | SNV | Missense_Mutation | | c.74G>A | p.Arg25Gln | p.R25Q | | protein_coding | deleterious_low_confidence(0) | possibly_damaging(0.643) | TCGA-AG-A002-01 | Colorectum | rectum adenocarcinoma | Male | <65 | I/II | Unknown | Unknown | SD |
| DAP | SNV | Missense_Mutation | novel | c.373C>A | p.Leu125Ile | p.L125I | | protein_coding | deleterious_low_confidence(0) | possibly_damaging(0.534) | TCGA-AJ-A3EK-01 | Endometrium | uterine corpus endometrioid carcinoma | Female | <65 | I/II | Chemotherapy | carboplatin | CR |
| DAP | SNV | Missense_Mutation | novel | c.391N>T | p.Leu131Phe | p.L131F | | protein_coding | deleterious_low_confidence(0) | benign(0.003) | TCGA-AP-A1DV-01 | Endometrium | uterine corpus endometrioid carcinoma | Female | <65 | I/II | Unknown | Unknown | SD |
| DAP | SNV | Missense_Mutation | rs753757154 | c.278N>C | p.His93Pro | p.H93P | | protein_coding | deleterious_low_confidence(0) | benign(0.01) | TCGA-BG-A0VZ-01 | Endometrium | uterine corpus endometrioid carcinoma | Female | <65 | III/IV | Chemotherapy | cisplatin | CR |
| DAP | SNV | Missense_Mutation | rs370396587 | c.182G>A | p.Arg61His | p.R61H | | protein_coding | tolerated_low_confidence(0.16) | benign(0.009) | TCGA-D1-A17U-01 | Endometrium | uterine corpus endometrioid carcinoma | Female | <65 | III/IV | Chemotherapy | carboplatin | SD |


