| Tissue | Expression Dynamics | Abbreviation |
| Colorectum (GSE201348) |  | FAP: Familial adenomatous polyposis |
| CRC: Colorectal cancer |
| Colorectum (HTA11) |  | AD: Adenomas |
| SER: Sessile serrated lesions |
| MSI-H: Microsatellite-high colorectal cancer |
| MSS: Microsatellite stable colorectal cancer |
| Esophagus |  | ESCC: Esophageal squamous cell carcinoma |
| HGIN: High-grade intraepithelial neoplasias |
| LGIN: Low-grade intraepithelial neoplasias |
| Liver | 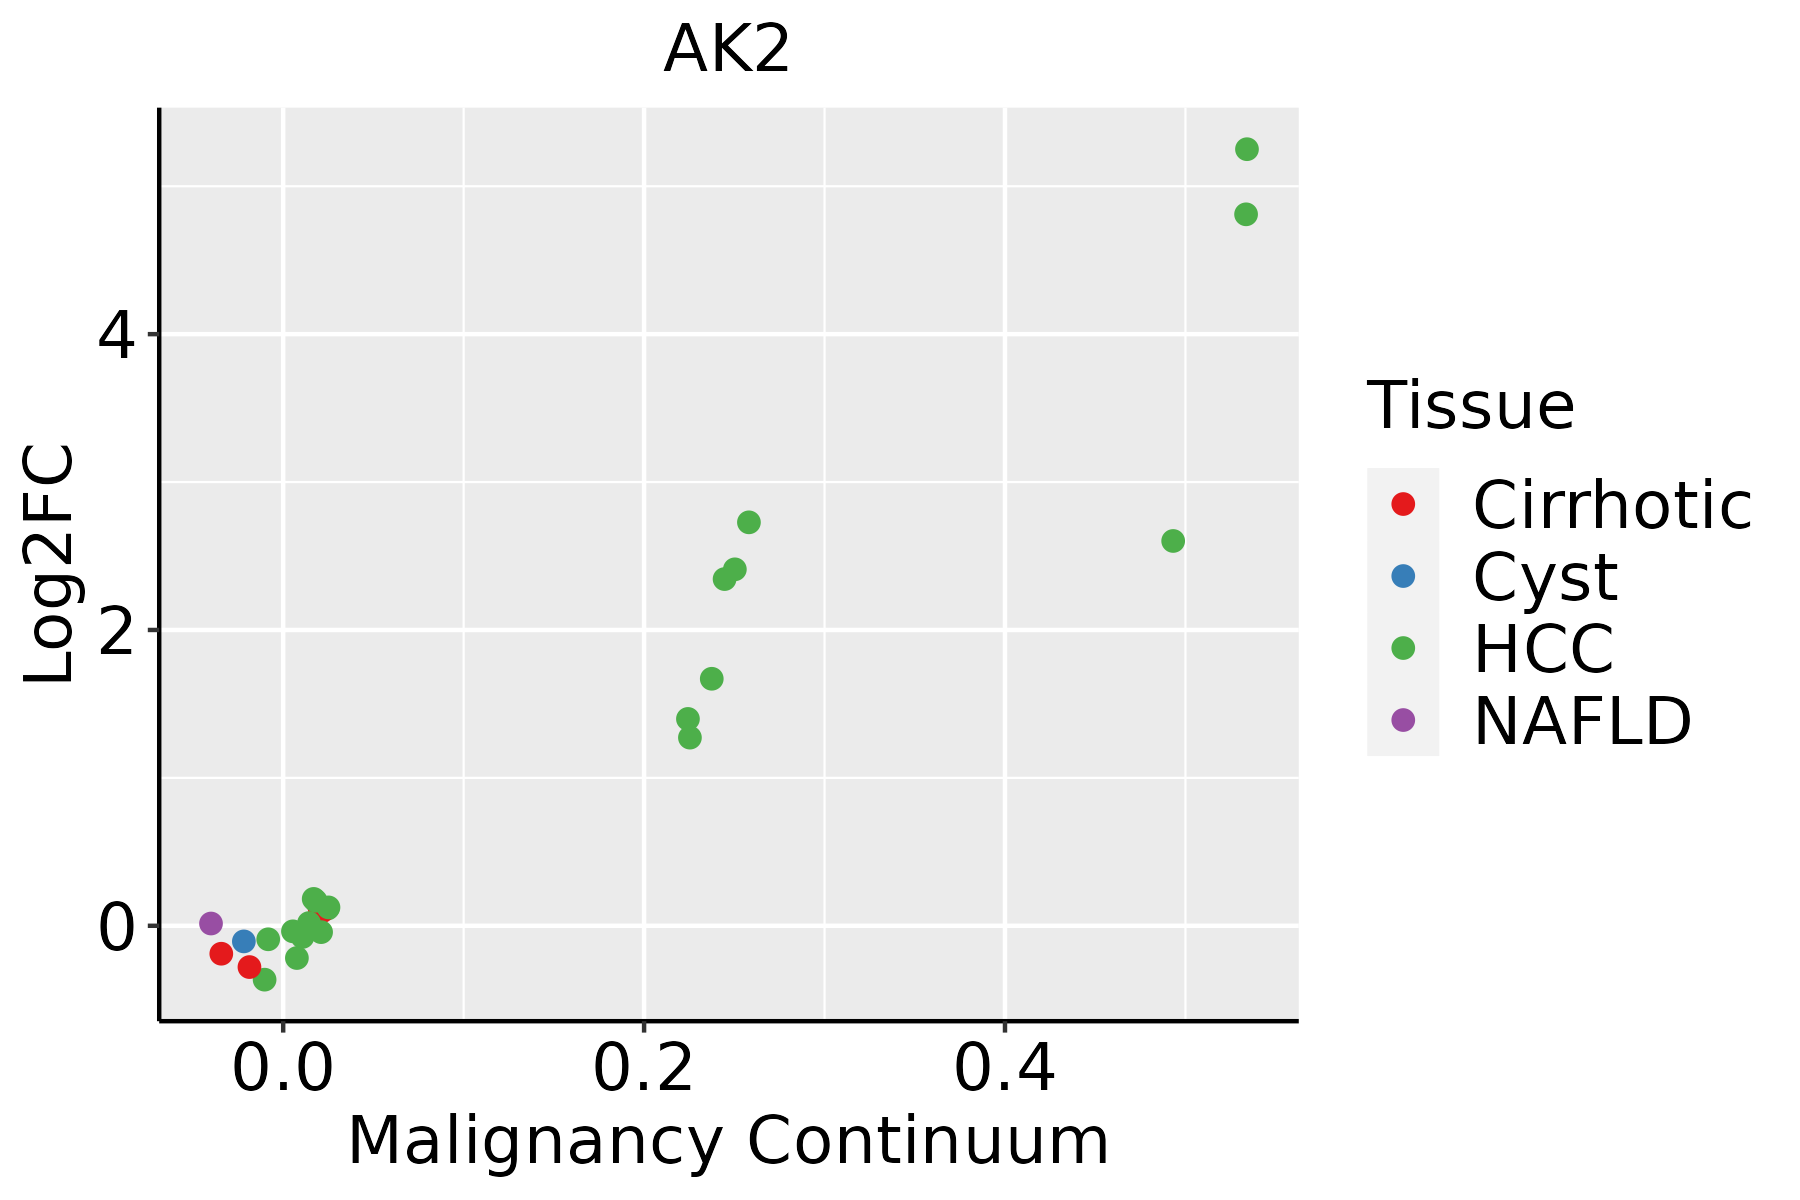 | HCC: Hepatocellular carcinoma |
| NAFLD: Non-alcoholic fatty liver disease |
| Oral Cavity | 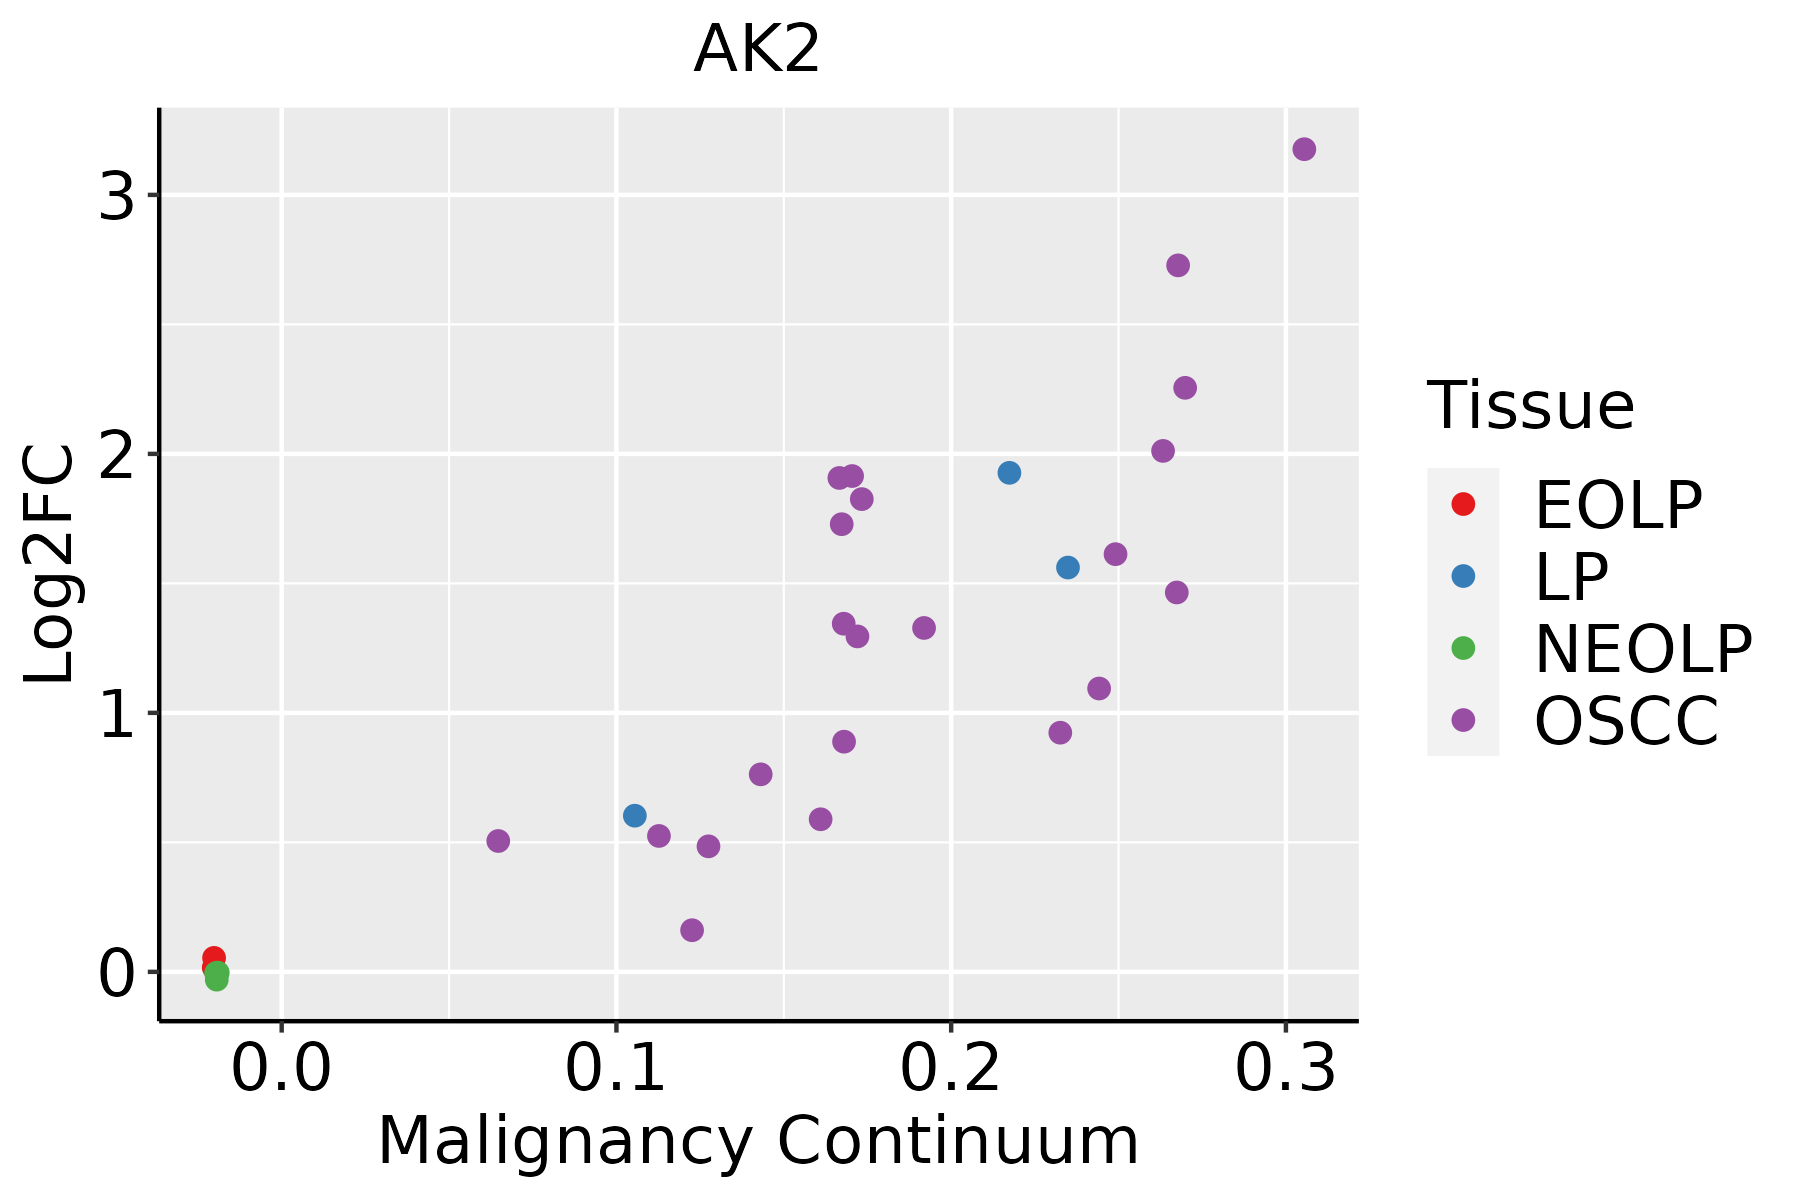 | EOLP: Erosive Oral lichen planus |
| LP: leukoplakia |
| NEOLP: Non-erosive oral lichen planus |
| OSCC: Oral squamous cell carcinoma |
| Skin |  | AK: Actinic keratosis |
| cSCC: Cutaneous squamous cell carcinoma |
| SCCIS:squamous cell carcinoma in situ |
| Thyroid | 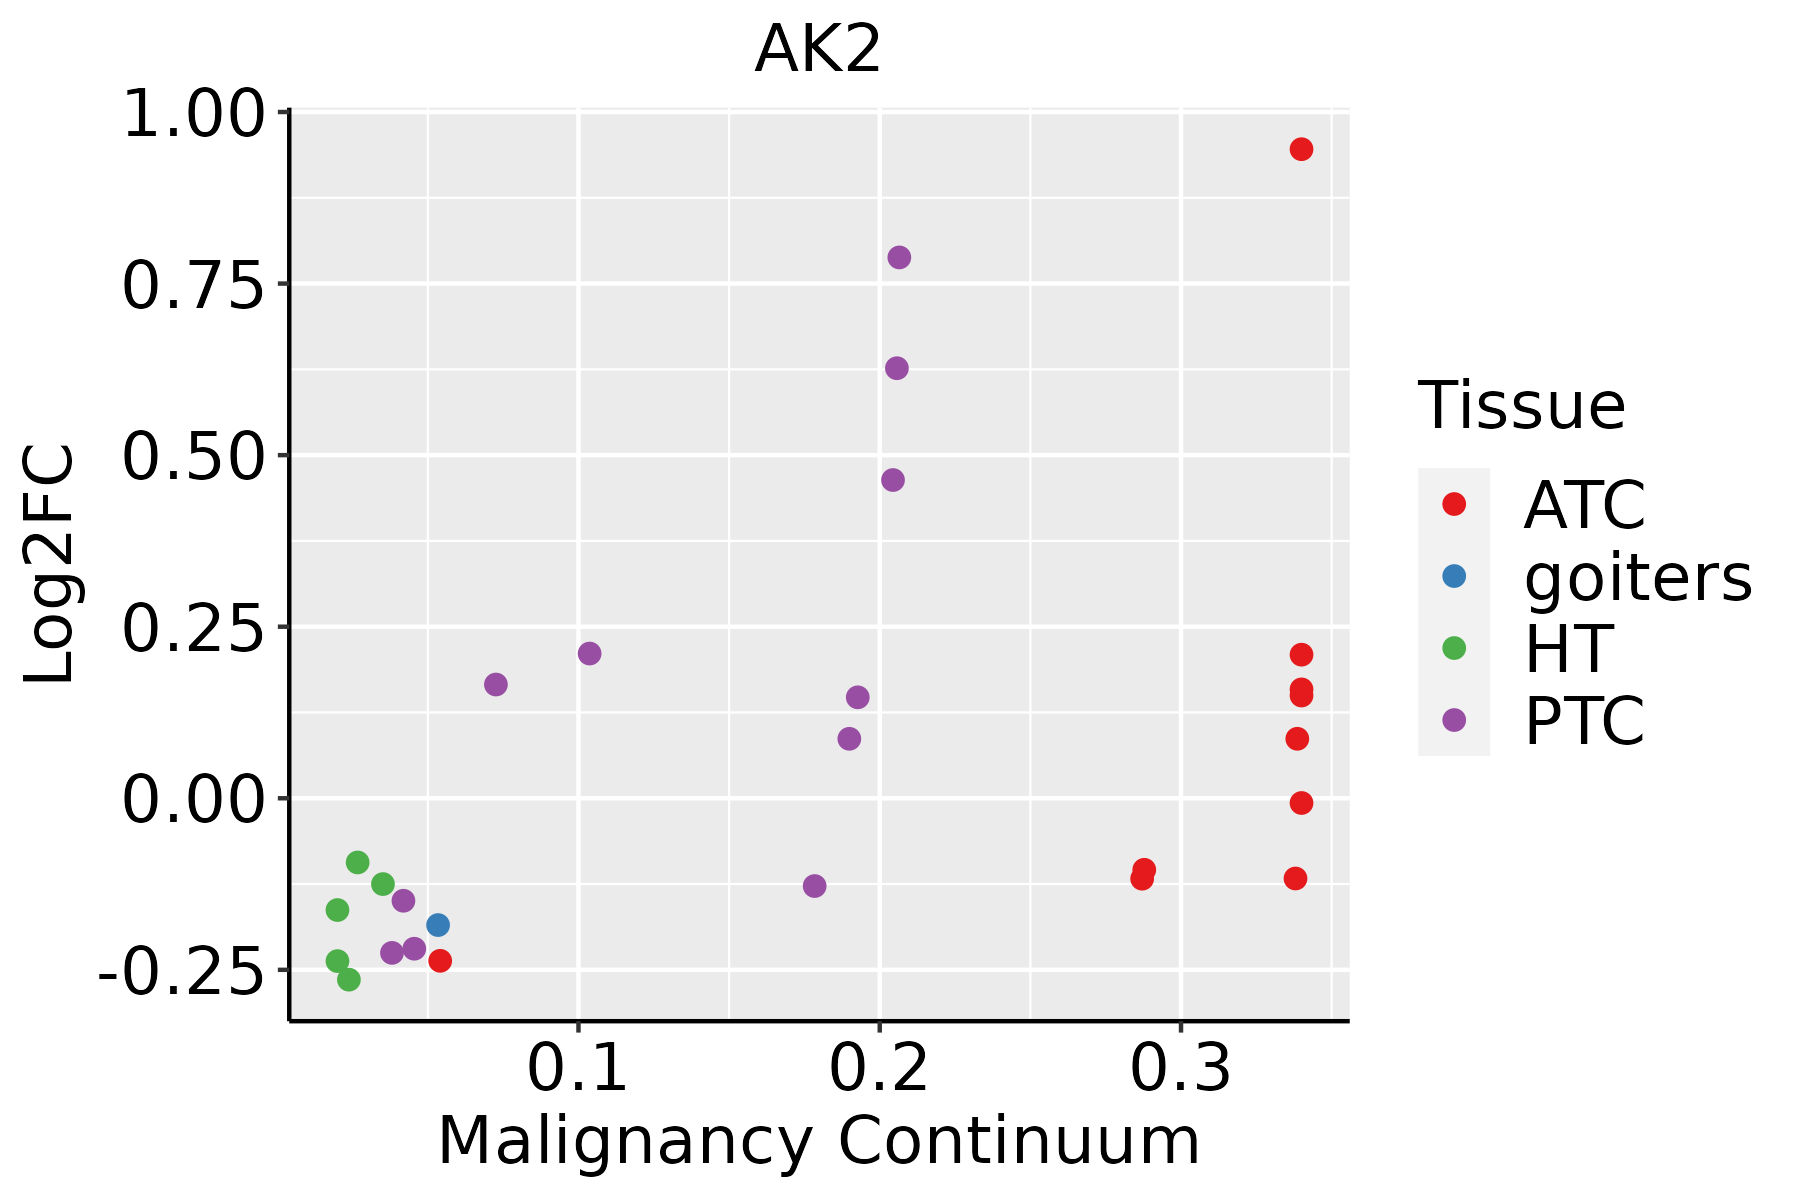 | ATC: Anaplastic thyroid cancer |
| HT: Hashimoto's thyroiditis |
| PTC: Papillary thyroid cancer |
| GO ID | Tissue | Disease Stage | Description | Gene Ratio | Bg Ratio | pvalue | p.adjust | Count |
| GO:00066064 | Colorectum | FAP | protein import into nucleus | 38/2622 | 155/18723 | 3.23e-04 | 4.15e-03 | 38 |
| GO:00092603 | Colorectum | FAP | ribonucleotide biosynthetic process | 43/2622 | 182/18723 | 3.23e-04 | 4.15e-03 | 43 |
| GO:19012144 | Colorectum | FAP | regulation of neuron death | 67/2622 | 319/18723 | 3.73e-04 | 4.63e-03 | 67 |
| GO:00170384 | Colorectum | FAP | protein import | 47/2622 | 206/18723 | 4.10e-04 | 4.94e-03 | 47 |
| GO:00364734 | Colorectum | FAP | cell death in response to oxidative stress | 26/2622 | 95/18723 | 4.63e-04 | 5.39e-03 | 26 |
| GO:00902763 | Colorectum | FAP | regulation of peptide hormone secretion | 45/2622 | 196/18723 | 4.66e-04 | 5.41e-03 | 45 |
| GO:00900873 | Colorectum | FAP | regulation of peptide transport | 46/2622 | 202/18723 | 4.91e-04 | 5.66e-03 | 46 |
| GO:00061643 | Colorectum | FAP | purine nucleotide biosynthetic process | 44/2622 | 191/18723 | 4.96e-04 | 5.71e-03 | 44 |
| GO:00507142 | Colorectum | FAP | positive regulation of protein secretion | 34/2622 | 137/18723 | 5.11e-04 | 5.82e-03 | 34 |
| GO:00068092 | Colorectum | FAP | nitric oxide biosynthetic process | 22/2622 | 76/18723 | 5.36e-04 | 6.06e-03 | 22 |
| GO:00462092 | Colorectum | FAP | nitric oxide metabolic process | 23/2622 | 81/18723 | 5.48e-04 | 6.15e-03 | 23 |
| GO:00603902 | Colorectum | FAP | regulation of SMAD protein signal transduction | 12/2622 | 31/18723 | 5.86e-04 | 6.51e-03 | 12 |
| GO:20010572 | Colorectum | FAP | reactive nitrogen species metabolic process | 23/2622 | 82/18723 | 6.62e-04 | 7.21e-03 | 23 |
| GO:19001824 | Colorectum | FAP | positive regulation of protein localization to nucleus | 24/2622 | 87/18723 | 6.65e-04 | 7.22e-03 | 24 |
| GO:00458604 | Colorectum | FAP | positive regulation of protein kinase activity | 77/2622 | 386/18723 | 7.31e-04 | 7.81e-03 | 77 |
| GO:00027913 | Colorectum | FAP | regulation of peptide secretion | 45/2622 | 200/18723 | 7.36e-04 | 7.83e-03 | 45 |
| GO:00086314 | Colorectum | FAP | intrinsic apoptotic signaling pathway in response to oxidative stress | 15/2622 | 45/18723 | 8.14e-04 | 8.51e-03 | 15 |
| GO:00463903 | Colorectum | FAP | ribose phosphate biosynthetic process | 43/2622 | 190/18723 | 8.40e-04 | 8.72e-03 | 43 |
| GO:00300722 | Colorectum | FAP | peptide hormone secretion | 51/2622 | 236/18723 | 9.09e-04 | 9.19e-03 | 51 |
| GO:19012153 | Colorectum | FAP | negative regulation of neuron death | 46/2622 | 208/18723 | 9.52e-04 | 9.42e-03 | 46 |
| Pathway ID | Tissue | Disease Stage | Description | Gene Ratio | Bg Ratio | pvalue | p.adjust | qvalue | Count |
| hsa012325 | Esophagus | ESCC | Nucleotide metabolism | 59/4205 | 85/8465 | 1.67e-04 | 6.58e-04 | 3.37e-04 | 59 |
| hsa012405 | Esophagus | ESCC | Biosynthesis of cofactors | 97/4205 | 153/8465 | 3.88e-04 | 1.35e-03 | 6.94e-04 | 97 |
| hsa0123212 | Esophagus | ESCC | Nucleotide metabolism | 59/4205 | 85/8465 | 1.67e-04 | 6.58e-04 | 3.37e-04 | 59 |
| hsa0124012 | Esophagus | ESCC | Biosynthesis of cofactors | 97/4205 | 153/8465 | 3.88e-04 | 1.35e-03 | 6.94e-04 | 97 |
| hsa01240 | Liver | Cirrhotic | Biosynthesis of cofactors | 66/2530 | 153/8465 | 3.11e-04 | 1.99e-03 | 1.23e-03 | 66 |
| hsa01232 | Liver | Cirrhotic | Nucleotide metabolism | 39/2530 | 85/8465 | 1.27e-03 | 6.73e-03 | 4.15e-03 | 39 |
| hsa012401 | Liver | Cirrhotic | Biosynthesis of cofactors | 66/2530 | 153/8465 | 3.11e-04 | 1.99e-03 | 1.23e-03 | 66 |
| hsa012321 | Liver | Cirrhotic | Nucleotide metabolism | 39/2530 | 85/8465 | 1.27e-03 | 6.73e-03 | 4.15e-03 | 39 |
| hsa012402 | Liver | HCC | Biosynthesis of cofactors | 103/4020 | 153/8465 | 4.67e-07 | 5.05e-06 | 2.81e-06 | 103 |
| hsa012322 | Liver | HCC | Nucleotide metabolism | 59/4020 | 85/8465 | 3.30e-05 | 1.88e-04 | 1.04e-04 | 59 |
| hsa012403 | Liver | HCC | Biosynthesis of cofactors | 103/4020 | 153/8465 | 4.67e-07 | 5.05e-06 | 2.81e-06 | 103 |
| hsa012323 | Liver | HCC | Nucleotide metabolism | 59/4020 | 85/8465 | 3.30e-05 | 1.88e-04 | 1.04e-04 | 59 |
| hsa012324 | Oral cavity | OSCC | Nucleotide metabolism | 54/3704 | 85/8465 | 1.78e-04 | 5.95e-04 | 3.03e-04 | 54 |
| hsa012404 | Oral cavity | OSCC | Biosynthesis of cofactors | 88/3704 | 153/8465 | 3.84e-04 | 1.20e-03 | 6.12e-04 | 88 |
| hsa0123211 | Oral cavity | OSCC | Nucleotide metabolism | 54/3704 | 85/8465 | 1.78e-04 | 5.95e-04 | 3.03e-04 | 54 |
| hsa0124011 | Oral cavity | OSCC | Biosynthesis of cofactors | 88/3704 | 153/8465 | 3.84e-04 | 1.20e-03 | 6.12e-04 | 88 |
| hsa0123221 | Oral cavity | LP | Nucleotide metabolism | 42/2418 | 85/8465 | 3.62e-05 | 2.36e-04 | 1.52e-04 | 42 |
| hsa0124021 | Oral cavity | LP | Biosynthesis of cofactors | 57/2418 | 153/8465 | 1.17e-02 | 3.91e-02 | 2.52e-02 | 57 |
| hsa0123231 | Oral cavity | LP | Nucleotide metabolism | 42/2418 | 85/8465 | 3.62e-05 | 2.36e-04 | 1.52e-04 | 42 |
| hsa0124031 | Oral cavity | LP | Biosynthesis of cofactors | 57/2418 | 153/8465 | 1.17e-02 | 3.91e-02 | 2.52e-02 | 57 |
| Hugo Symbol | Variant Class | Variant Classification | dbSNP RS | HGVSc | HGVSp | HGVSp Short | SWISSPROT | BIOTYPE | SIFT | PolyPhen | Tumor Sample Barcode | Tissue | Histology | Sex | Age | Stage | Therapy Types | Drugs | Outcome |
| AK2 | insertion | In_Frame_Ins | novel | c.499-1_499insCCCATGAAAGATGAC | p.Pro162_Asp166dup | p.P162_D166dup | P54819 | protein_coding | | | TCGA-AC-A3YI-01 | Breast | breast invasive carcinoma | Female | >=65 | III/IV | Chemotherapy | cytoxan | CR |
| AK2 | insertion | Frame_Shift_Ins | novel | c.298_299insATAACACCTGCTTTGAGAA | p.Gly100AspfsTer20 | p.G100Dfs*20 | P54819 | protein_coding | | | TCGA-BH-A0HQ-01 | Breast | breast invasive carcinoma | Female | <65 | I/II | Hormone Therapy | arimidex | SD |
| AK2 | insertion | In_Frame_Ins | novel | c.499-1_499insCCCATGAAAGATGAC | p.Pro162_Asp166dup | p.P162_D166dup | P54819 | protein_coding | | | TCGA-D8-A1JG-01 | Breast | breast invasive carcinoma | Female | <65 | I/II | Chemotherapy | doxorubicin | SD |
| AK2 | SNV | Missense_Mutation | novel | c.98N>T | p.Pro33Leu | p.P33L | P54819 | protein_coding | deleterious(0.01) | benign(0.074) | TCGA-A5-A0G2-01 | Endometrium | uterine corpus endometrioid carcinoma | Female | <65 | III/IV | Unknown | Unknown | SD |
| AK2 | SNV | Missense_Mutation | novel | c.353N>T | p.Arg118Met | p.R118M | P54819 | protein_coding | deleterious(0.01) | probably_damaging(0.988) | TCGA-AP-A059-01 | Endometrium | uterine corpus endometrioid carcinoma | Female | >=65 | I/II | Unknown | Unknown | SD |
| AK2 | SNV | Missense_Mutation | rs770292274 | c.368N>G | p.Asp123Gly | p.D123G | P54819 | protein_coding | deleterious(0) | benign(0.399) | TCGA-AP-A1DK-01 | Endometrium | uterine corpus endometrioid carcinoma | Female | <65 | I/II | Unknown | Unknown | SD |
| AK2 | SNV | Missense_Mutation | | c.231N>C | p.Glu77Asp | p.E77D | P54819 | protein_coding | tolerated(1) | benign(0.005) | TCGA-BS-A0UV-01 | Endometrium | uterine corpus endometrioid carcinoma | Female | <65 | III/IV | Unknown | Unknown | SD |
| AK2 | SNV | Missense_Mutation | rs370429097 | c.610N>T | p.Arg204Trp | p.R204W | P54819 | protein_coding | deleterious(0) | possibly_damaging(0.885) | TCGA-D1-A16G-01 | Endometrium | uterine corpus endometrioid carcinoma | Female | >=65 | III/IV | Chemotherapy | taxol | PD |
| AK2 | SNV | Missense_Mutation | rs765991265 | c.334G>A | p.Asp112Asn | p.D112N | P54819 | protein_coding | deleterious(0.01) | possibly_damaging(0.844) | TCGA-EY-A1G8-01 | Endometrium | uterine corpus endometrioid carcinoma | Female | >=65 | I/II | Unknown | Unknown | SD |
| AK2 | SNV | Missense_Mutation | | c.524G>A | p.Arg175Gln | p.R175Q | P54819 | protein_coding | deleterious(0.01) | probably_damaging(1) | TCGA-BC-A10W-01 | Liver | liver hepatocellular carcinoma | Male | <65 | III/IV | Chemotherapy | unknown | PD |


