| Tissue | Expression Dynamics | Abbreviation |
| Breast | 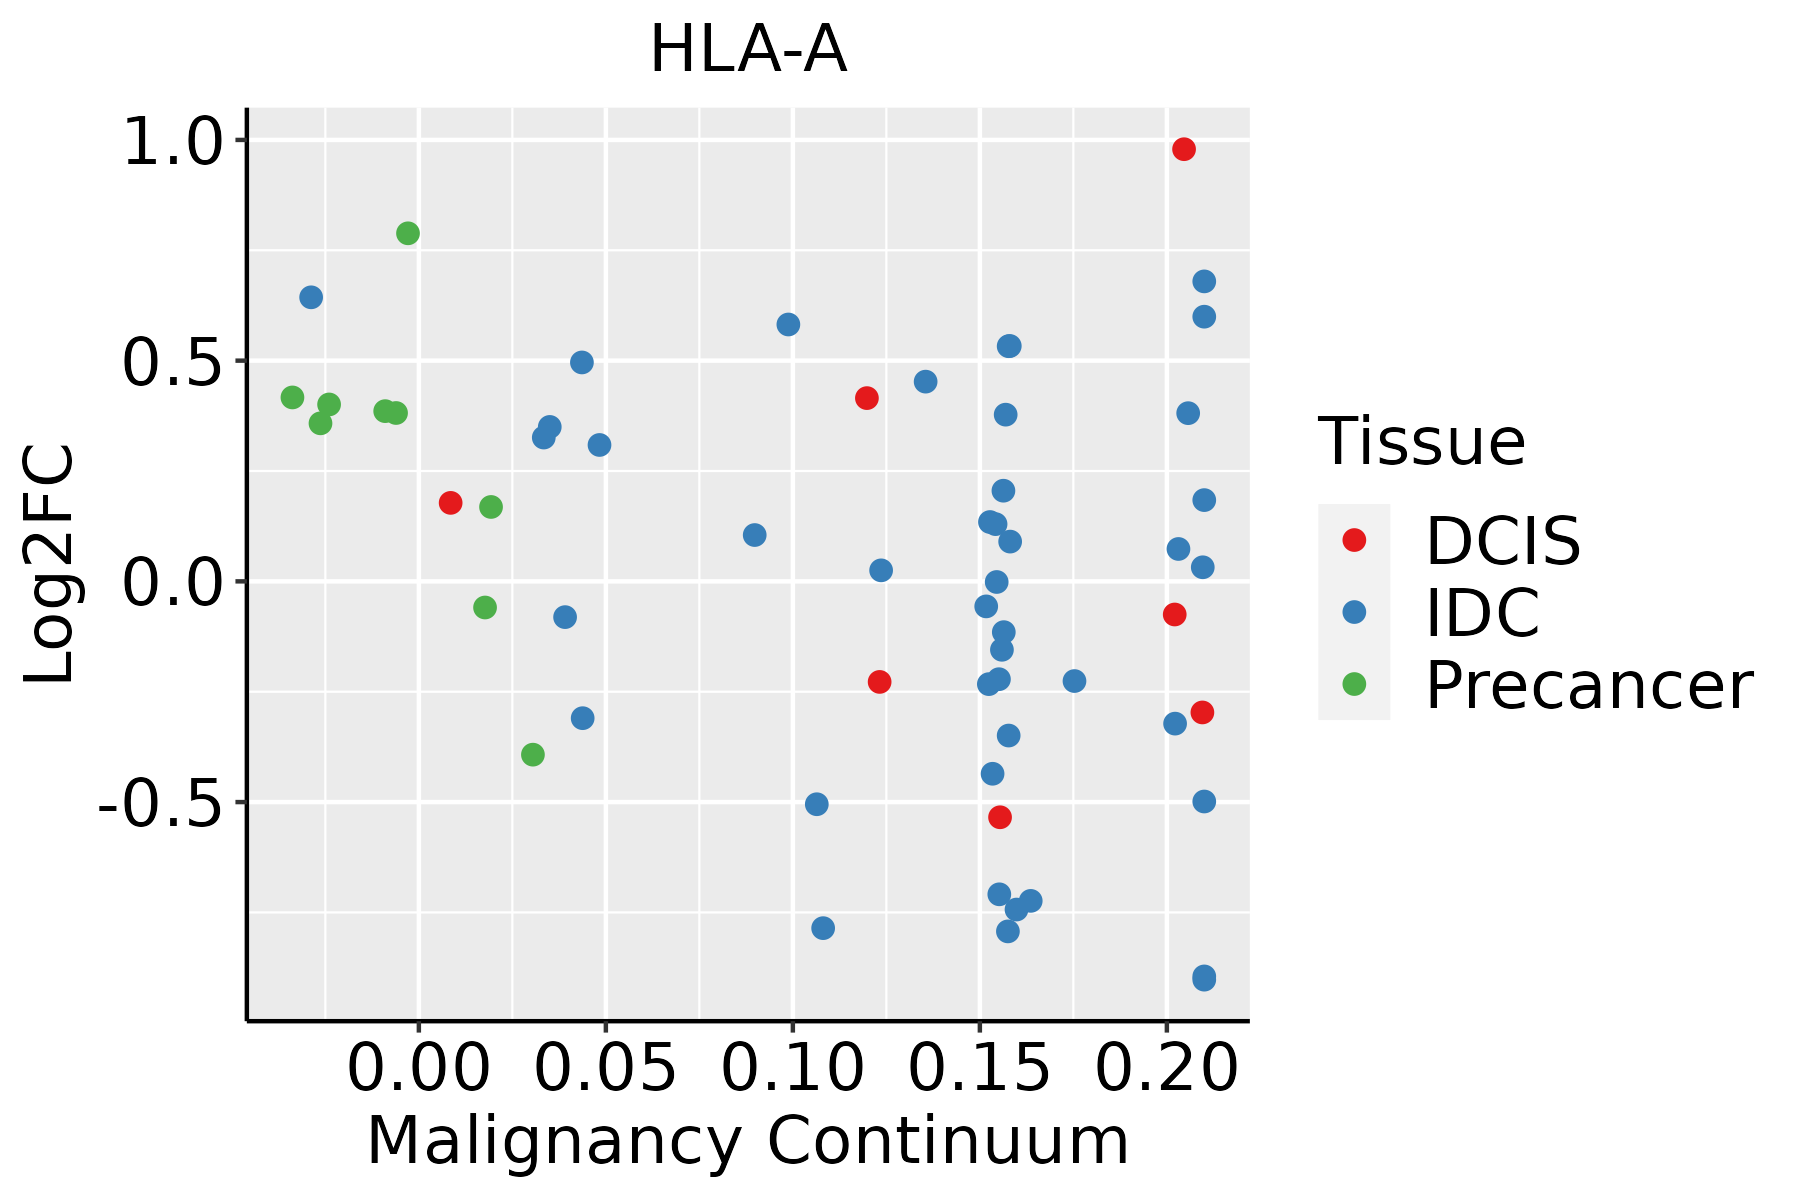 | IDC: Invasive ductal carcinoma |
| DCIS: Ductal carcinoma in situ |
| Precancer(BRCA1-mut): Precancerous lesion from BRCA1 mutation carriers |
| Cervix | 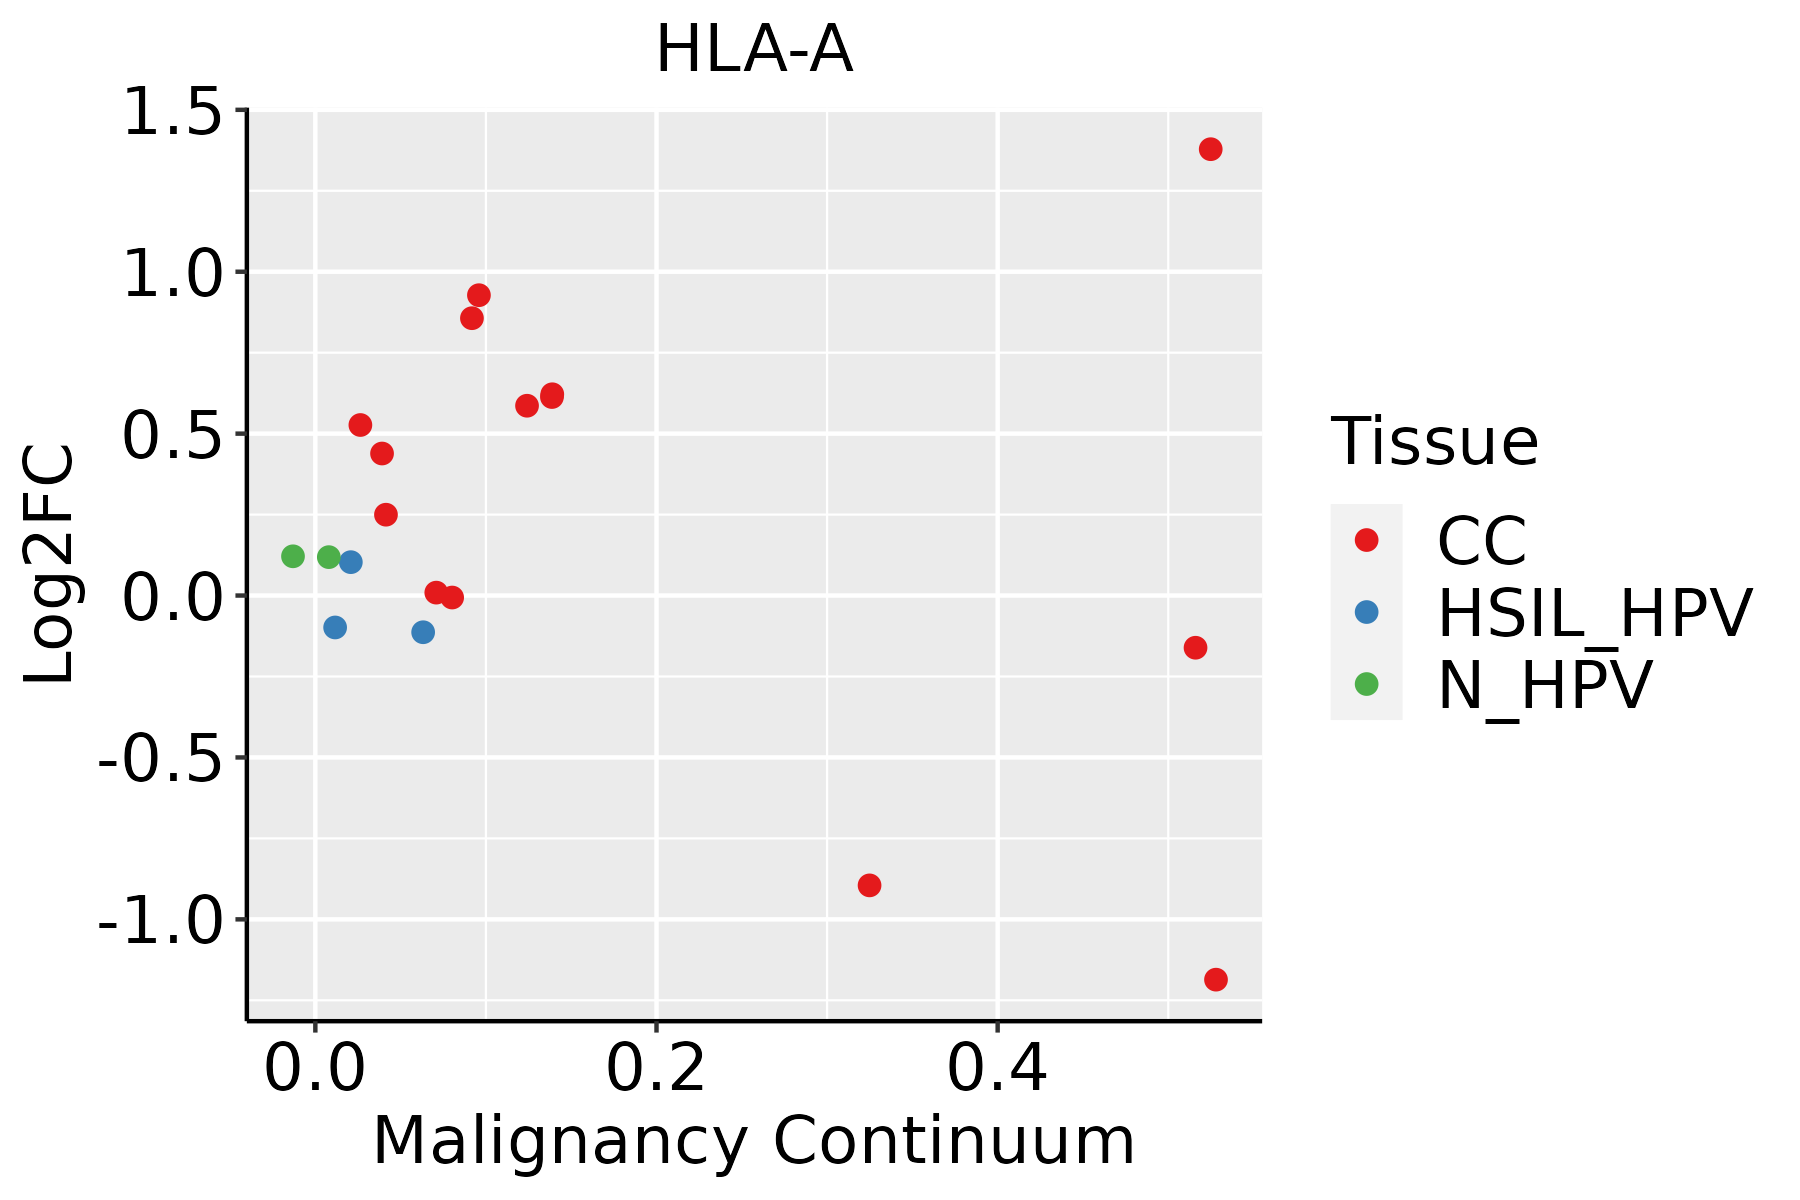 | CC: Cervix cancer |
| HSIL_HPV: HPV-infected high-grade squamous intraepithelial lesions |
| N_HPV: HPV-infected normal cervix |
| Colorectum (GSE201348) |  | FAP: Familial adenomatous polyposis |
| CRC: Colorectal cancer |
| Colorectum (HTA11) |  | AD: Adenomas |
| SER: Sessile serrated lesions |
| MSI-H: Microsatellite-high colorectal cancer |
| MSS: Microsatellite stable colorectal cancer |
| Endometrium | 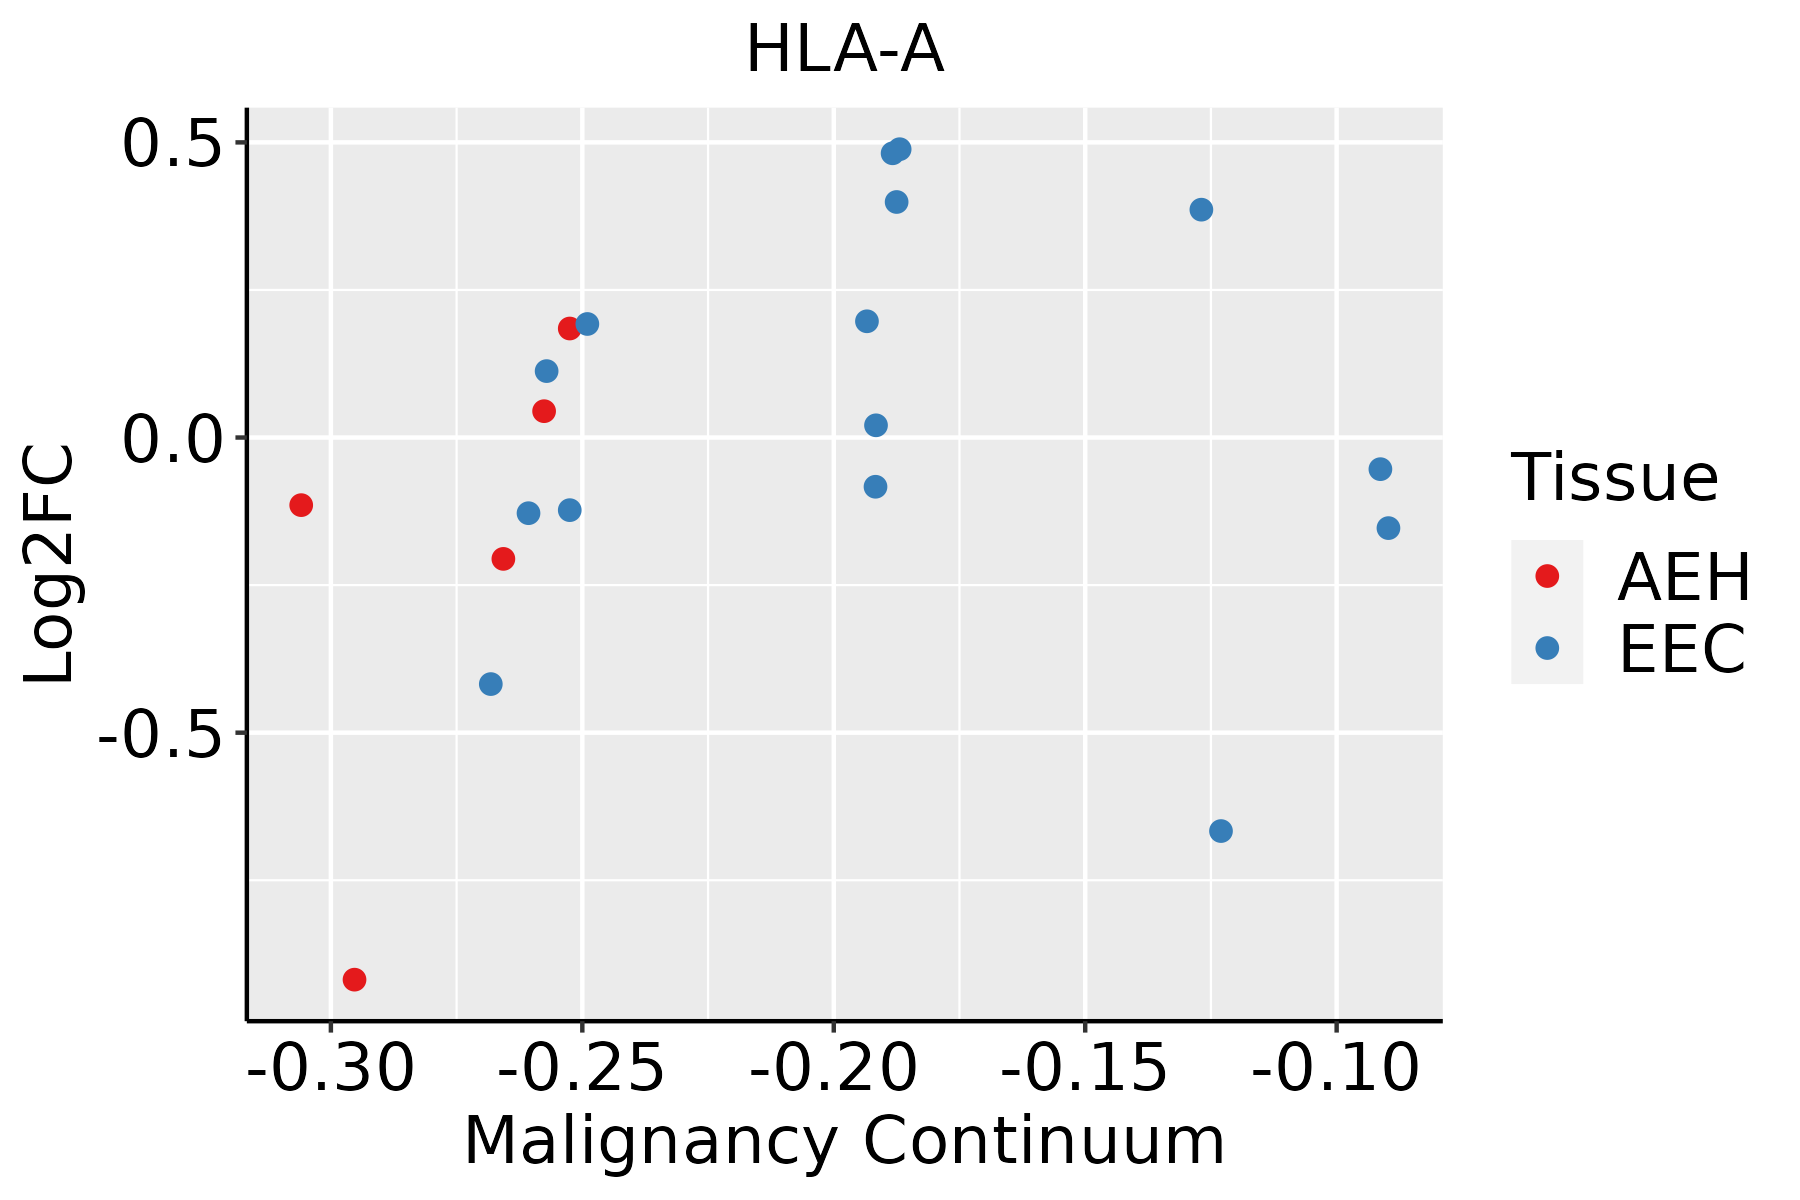 | AEH: Atypical endometrial hyperplasia |
| EEC: Endometrioid Cancer |
| Esophagus | 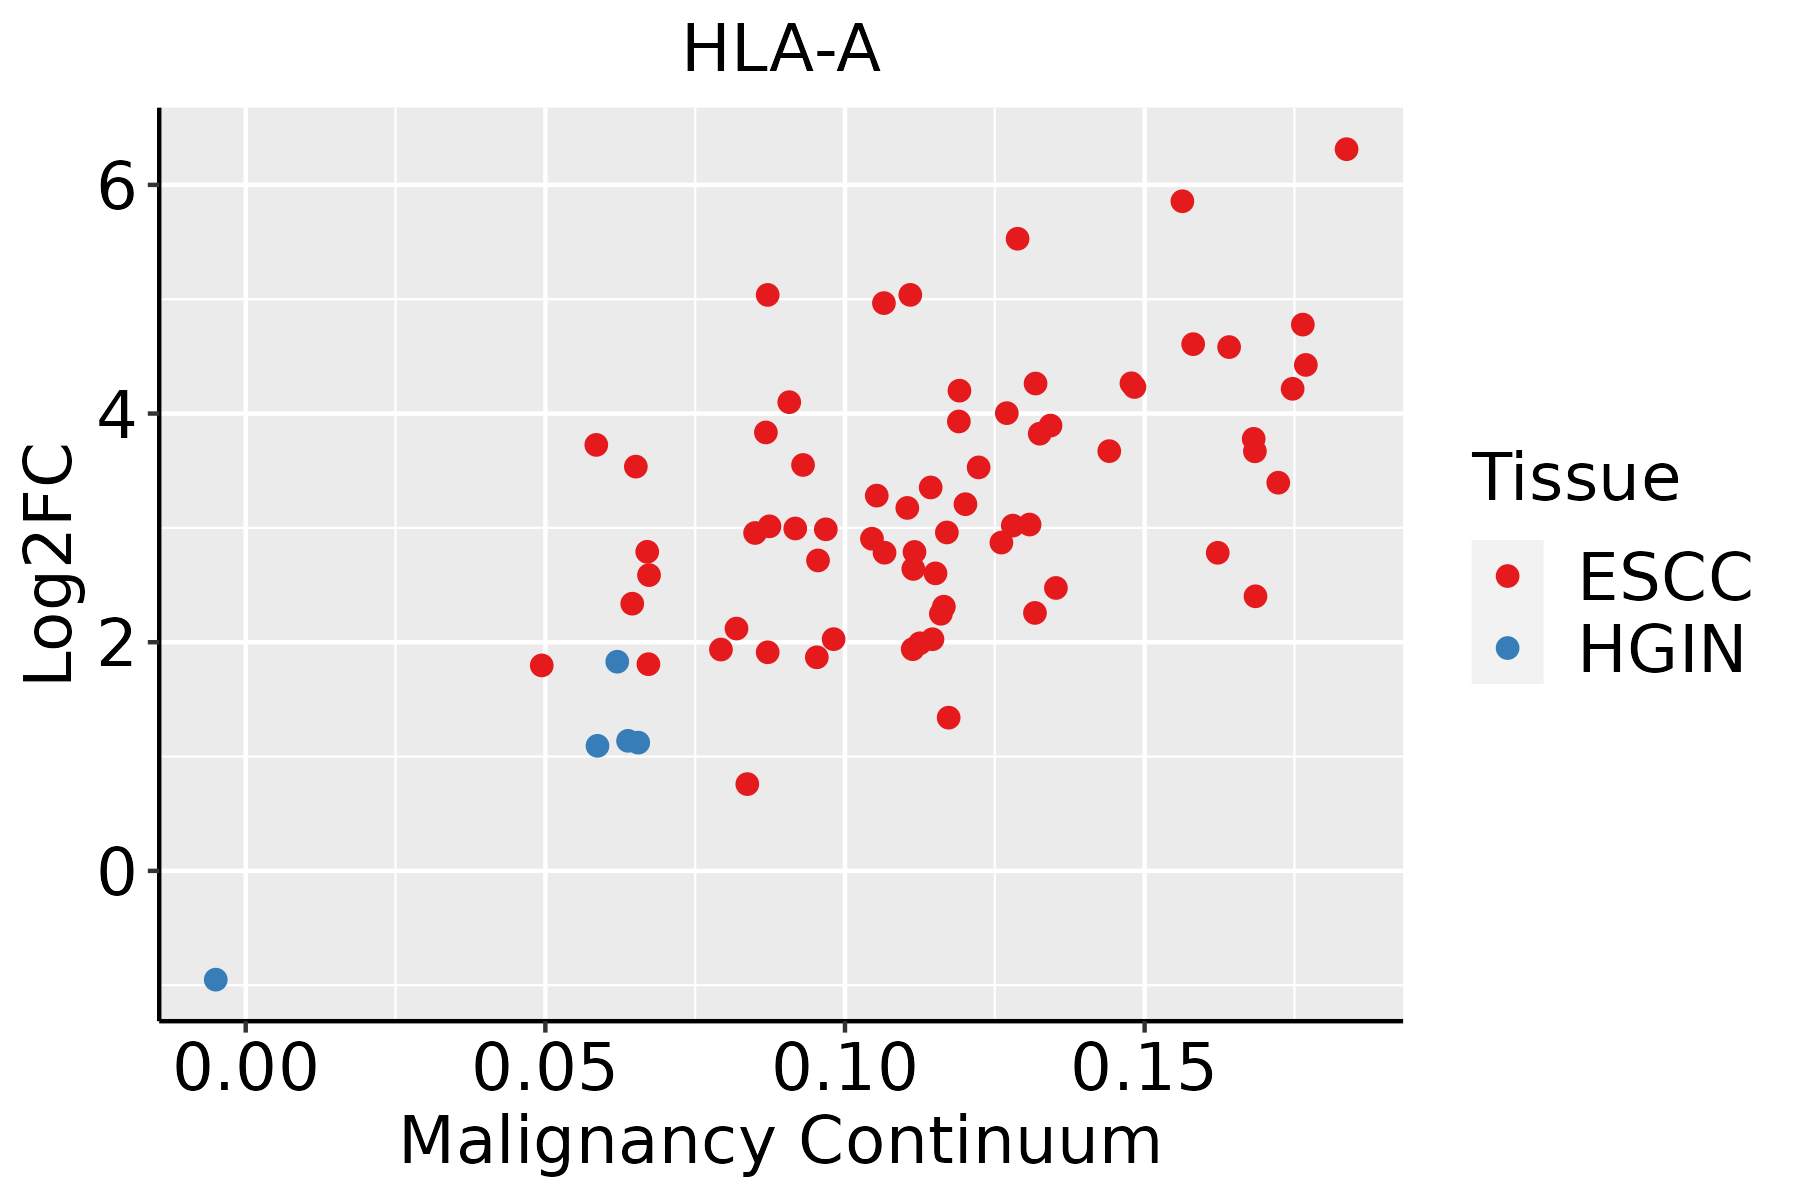 | ESCC: Esophageal squamous cell carcinoma |
| HGIN: High-grade intraepithelial neoplasias |
| LGIN: Low-grade intraepithelial neoplasias |
| GC | 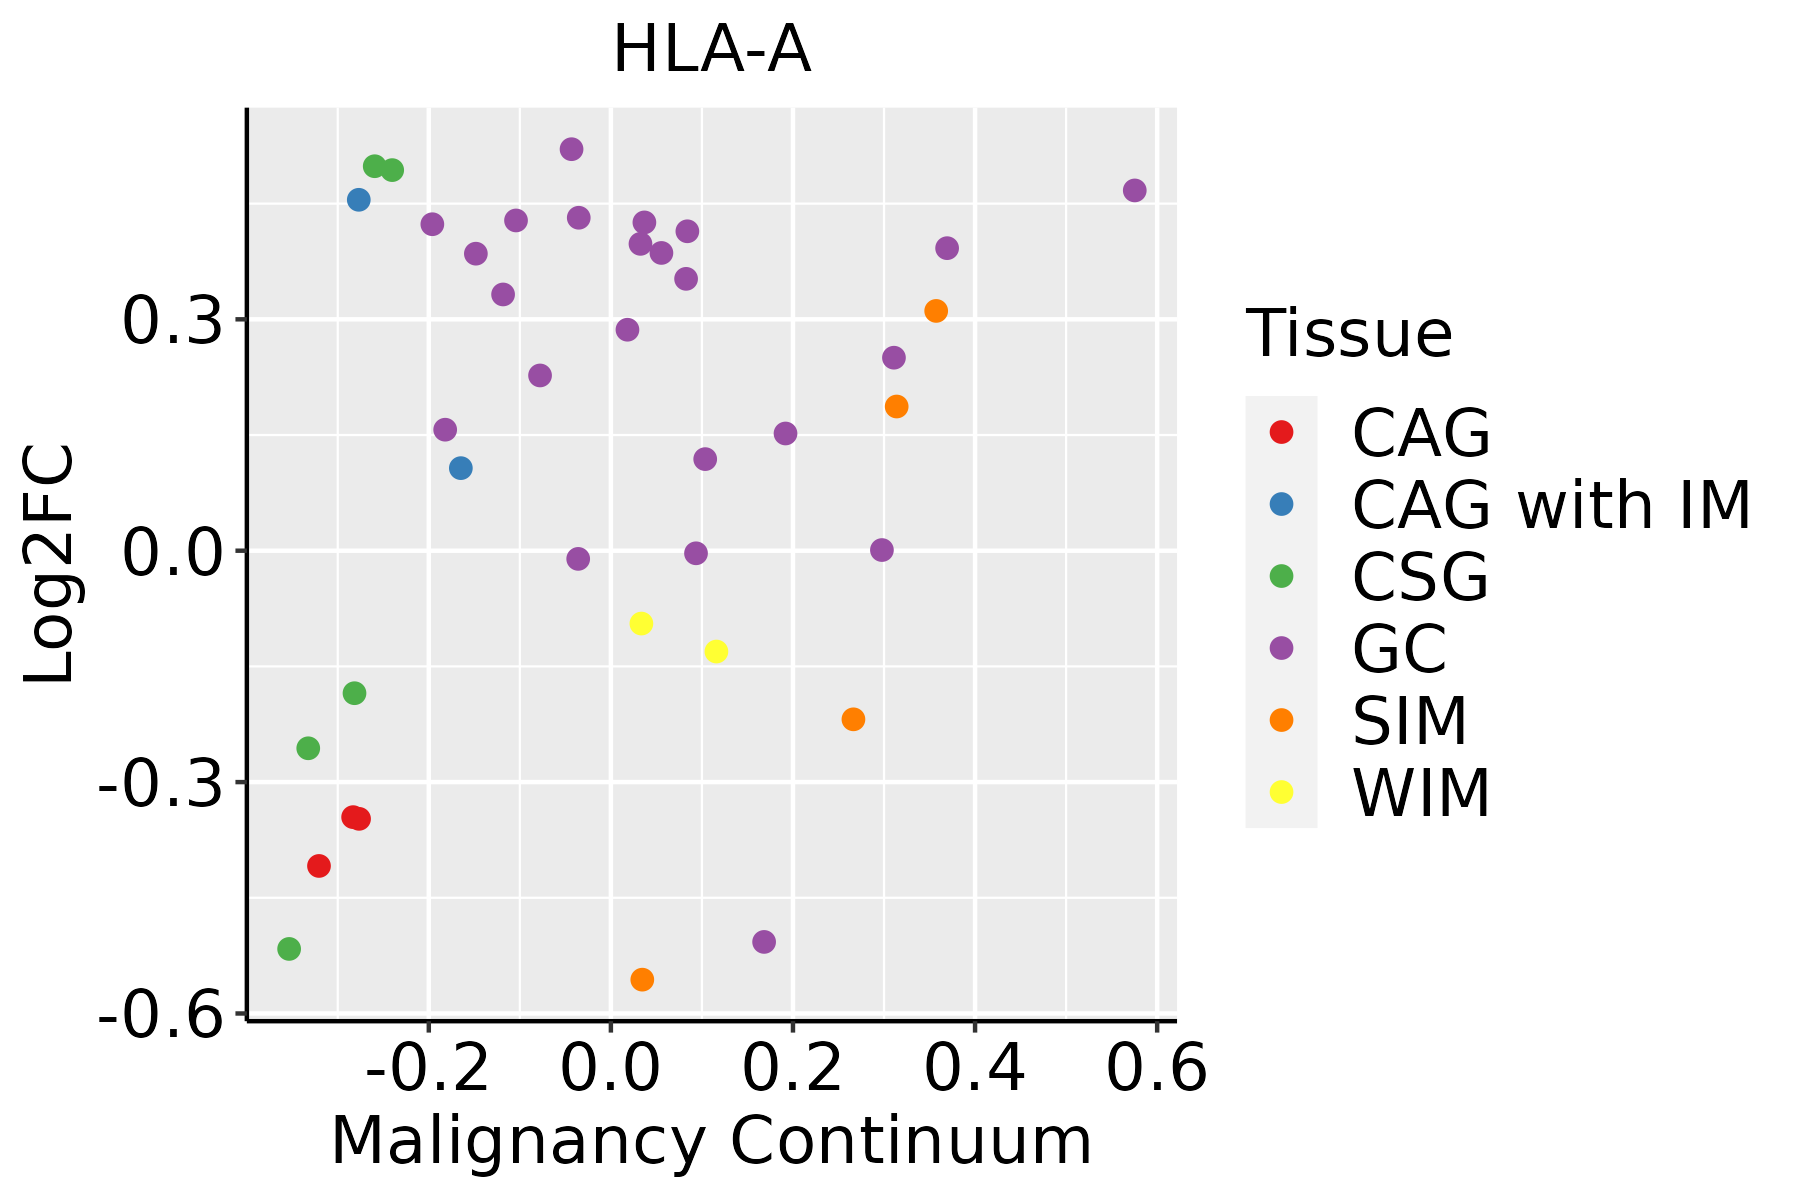 | CAG: Chronic atrophic gastritis |
| CAG with IM: Chronic atrophic gastritis with intestinal metaplasia |
| CSG: Chronic superficial gastritis |
| GC: Gastric cancer |
| SIM: Severe intestinal metaplasia |
| WIM: Wild intestinal metaplasia |
| Liver | 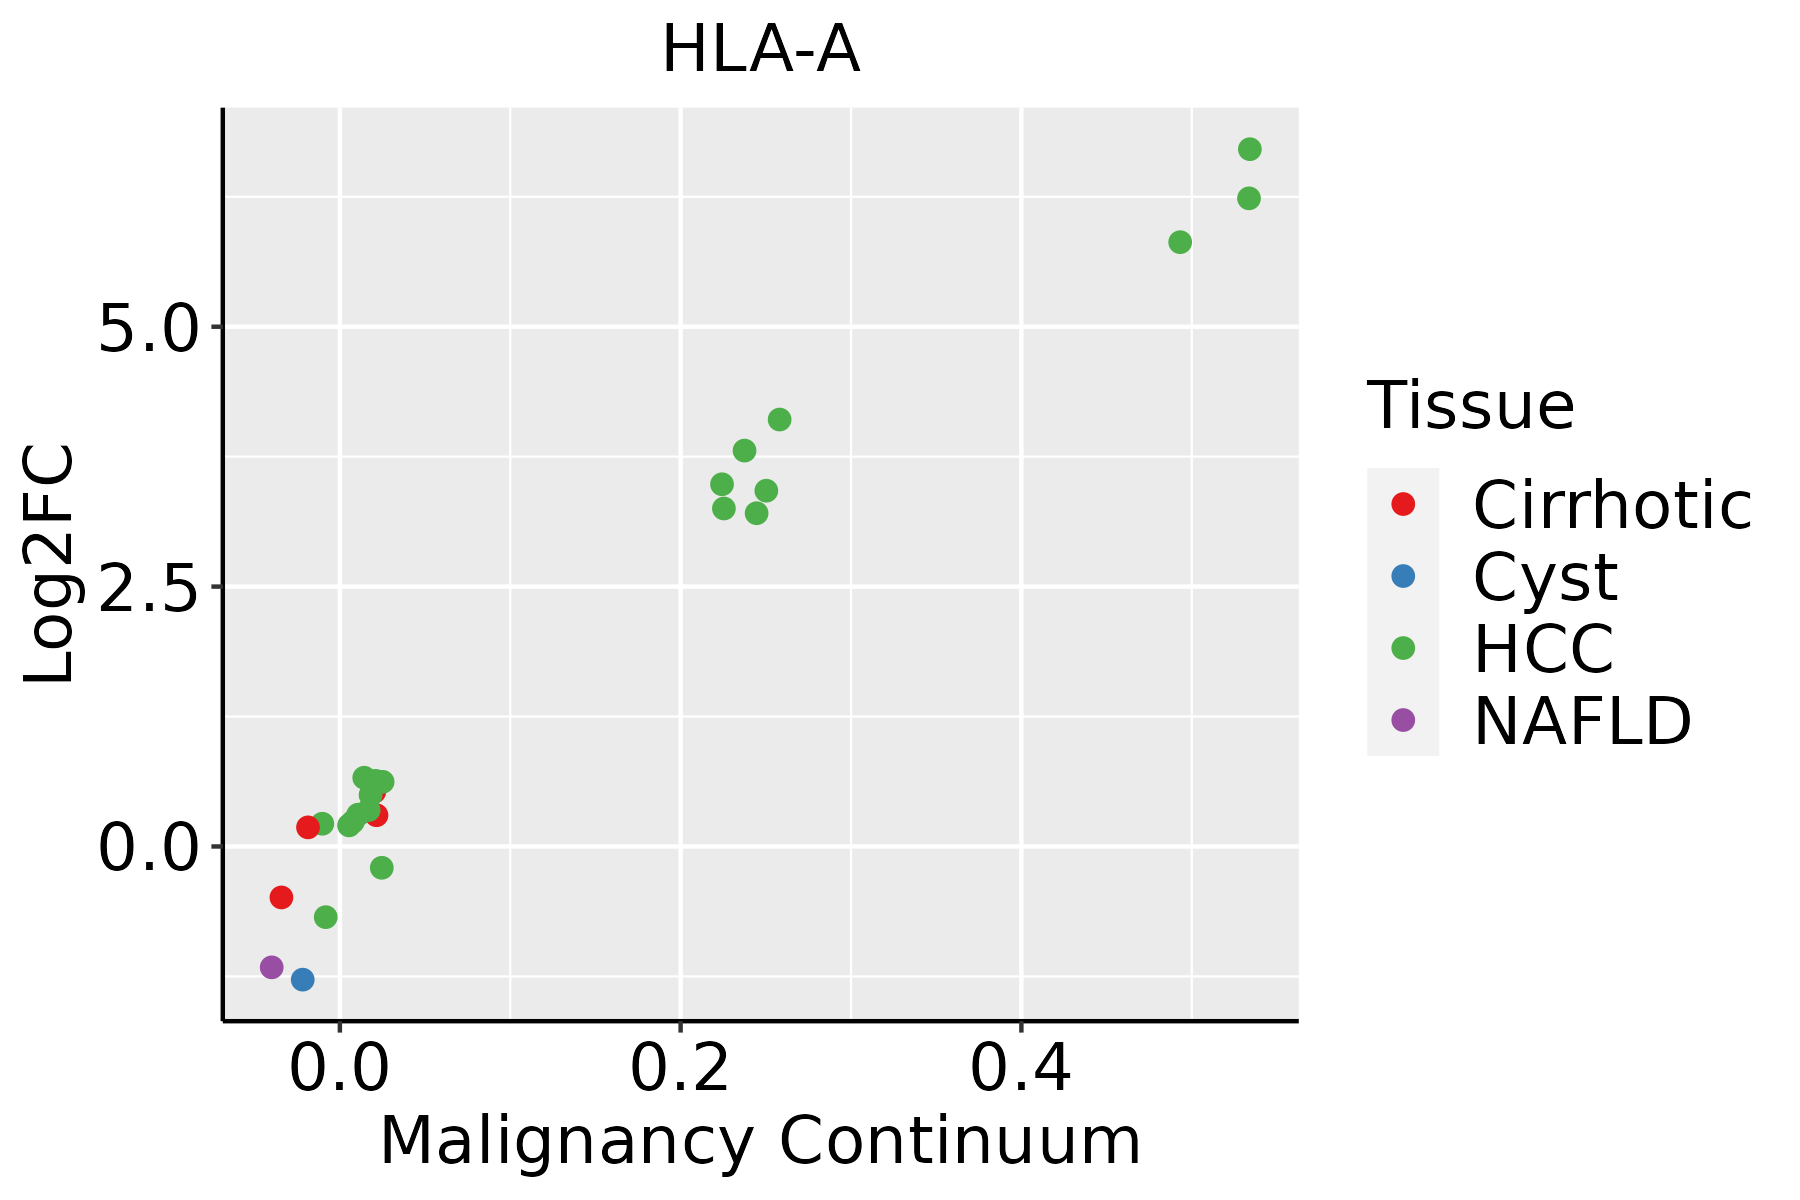 | HCC: Hepatocellular carcinoma |
| NAFLD: Non-alcoholic fatty liver disease |
| Oral Cavity |  | EOLP: Erosive Oral lichen planus |
| LP: leukoplakia |
| NEOLP: Non-erosive oral lichen planus |
| OSCC: Oral squamous cell carcinoma |
| Prostate | 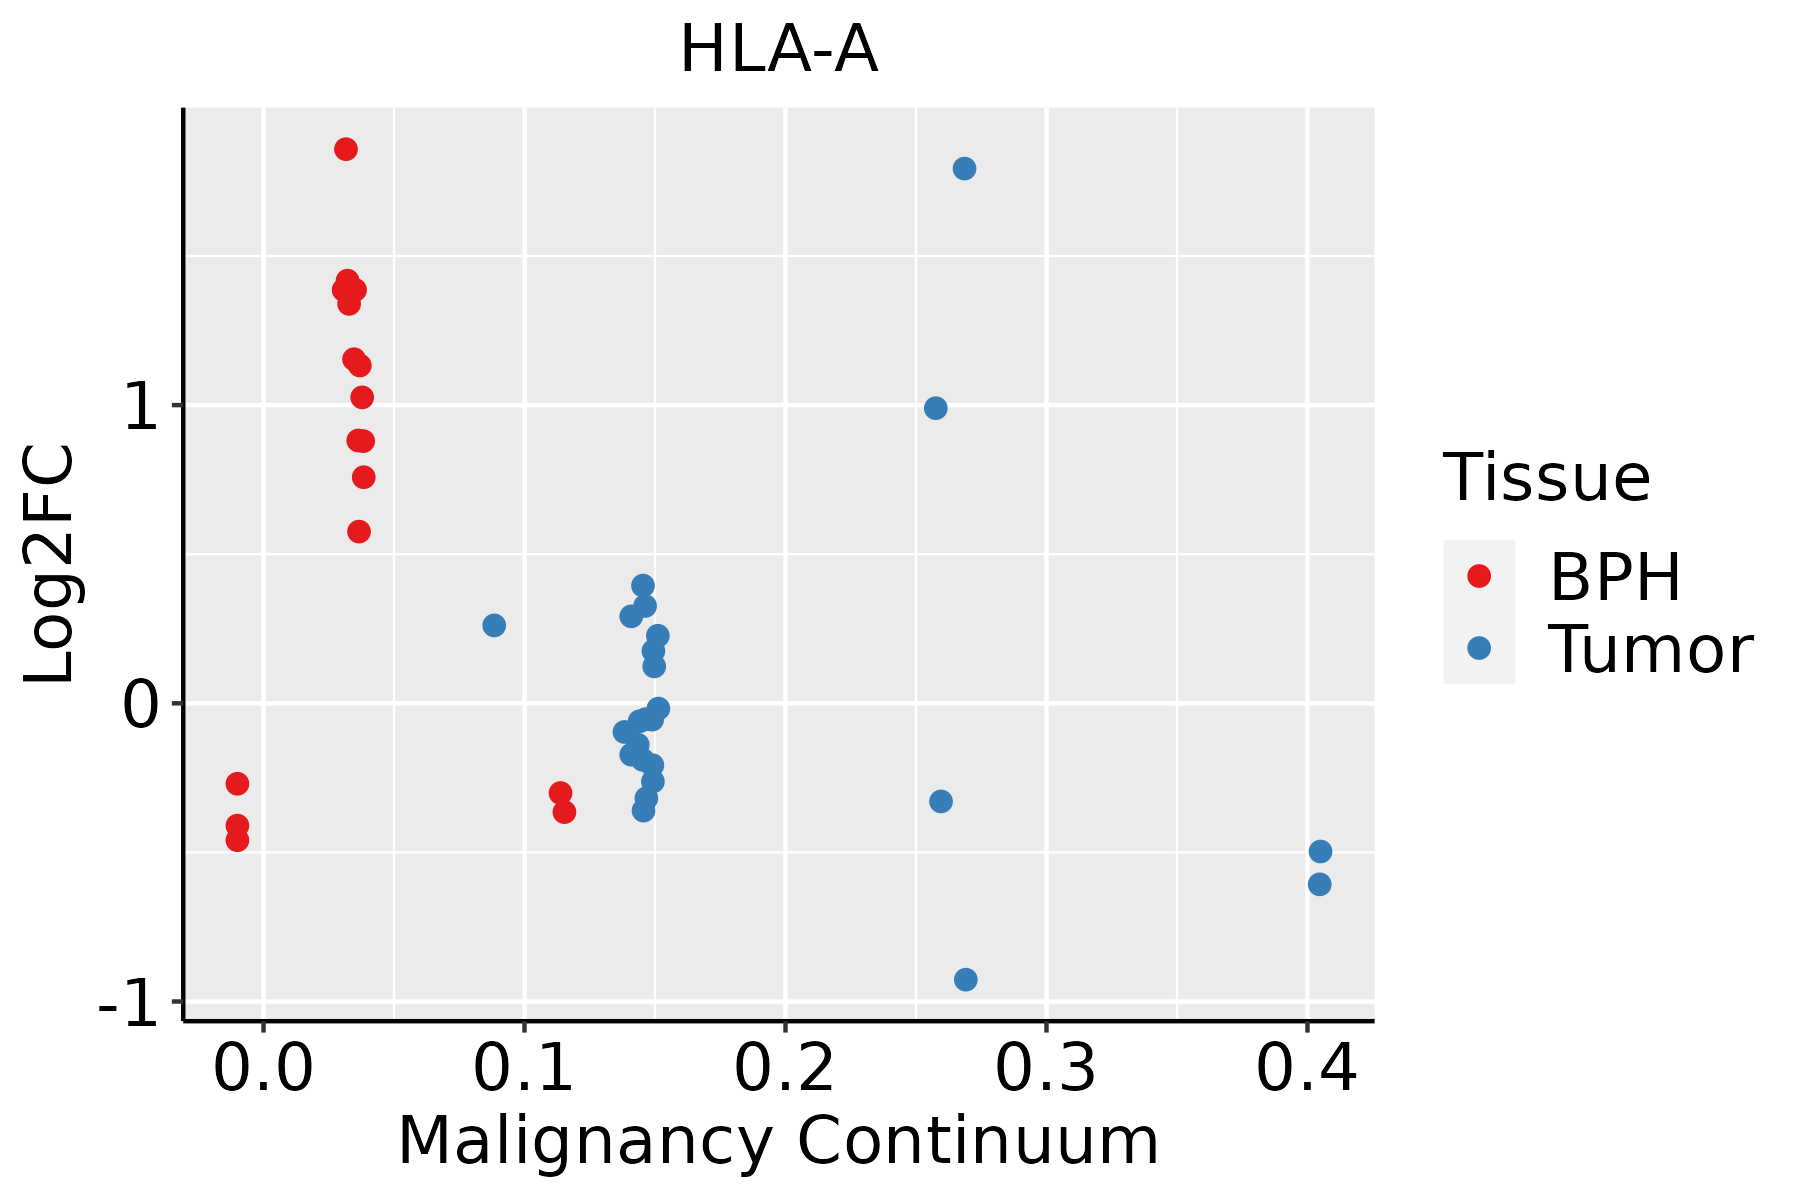 | BPH: Benign Prostatic Hyperplasia |
| Skin | 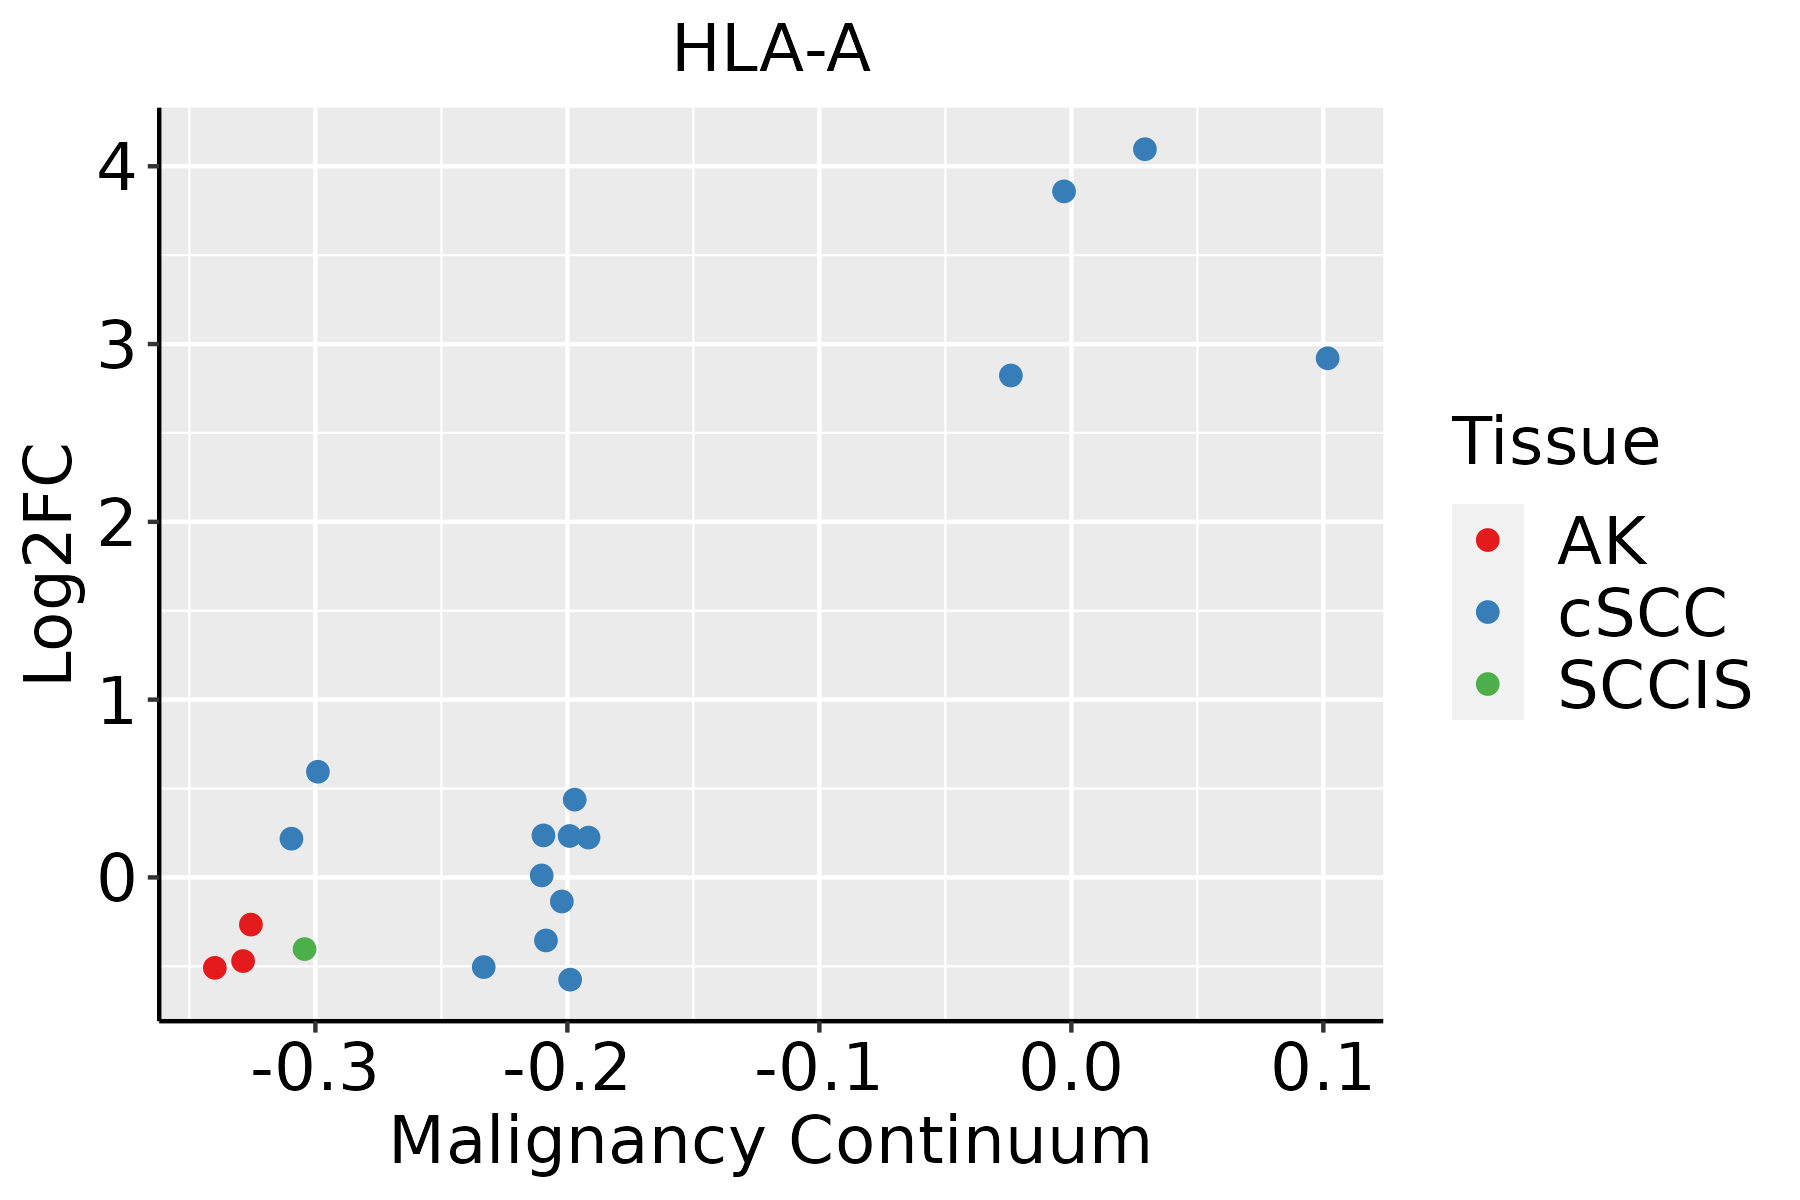 | AK: Actinic keratosis |
| cSCC: Cutaneous squamous cell carcinoma |
| SCCIS:squamous cell carcinoma in situ |
| Thyroid | 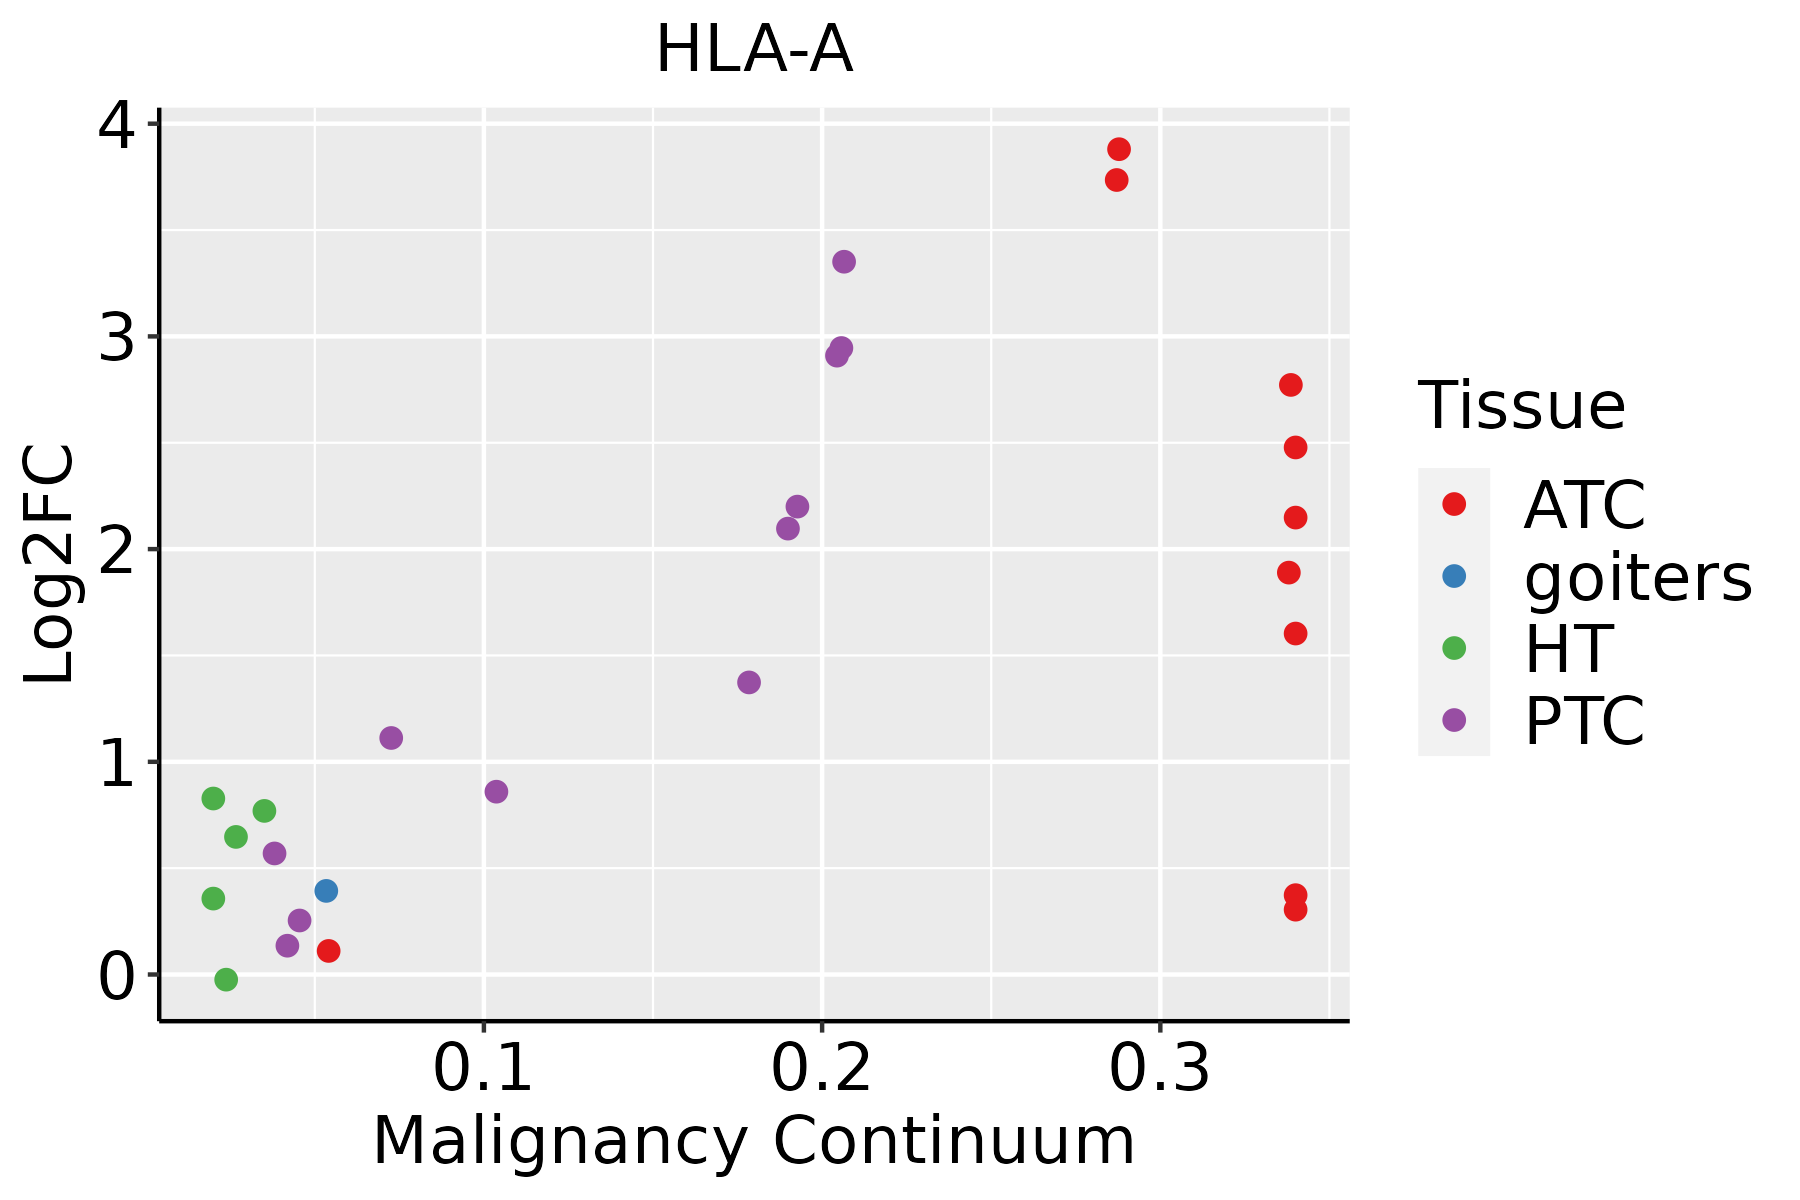 | ATC: Anaplastic thyroid cancer |
| HT: Hashimoto's thyroiditis |
| PTC: Papillary thyroid cancer |
| GO ID | Tissue | Disease Stage | Description | Gene Ratio | Bg Ratio | pvalue | p.adjust | Count |
| GO:00480025 | Stomach | SIM | antigen processing and presentation of peptide antigen | 15/708 | 62/18723 | 7.10e-09 | 9.57e-07 | 15 |
| GO:00198825 | Stomach | SIM | antigen processing and presentation | 18/708 | 106/18723 | 8.62e-08 | 7.97e-06 | 18 |
| GO:00024785 | Stomach | SIM | antigen processing and presentation of exogenous peptide antigen | 11/708 | 38/18723 | 9.90e-08 | 8.64e-06 | 11 |
| GO:00198845 | Stomach | SIM | antigen processing and presentation of exogenous antigen | 12/708 | 47/18723 | 1.21e-07 | 9.98e-06 | 12 |
| GO:00197305 | Stomach | SIM | antimicrobial humoral response | 19/708 | 122/18723 | 1.58e-07 | 1.22e-05 | 19 |
| GO:004578551 | Stomach | SIM | positive regulation of cell adhesion | 40/708 | 437/18723 | 2.47e-07 | 1.74e-05 | 40 |
| GO:00224075 | Stomach | SIM | regulation of cell-cell adhesion | 40/708 | 448/18723 | 4.73e-07 | 3.05e-05 | 40 |
| GO:00508705 | Stomach | SIM | positive regulation of T cell activation | 24/708 | 216/18723 | 2.41e-06 | 1.18e-04 | 24 |
| GO:00198835 | Stomach | SIM | antigen processing and presentation of endogenous antigen | 8/708 | 26/18723 | 3.43e-06 | 1.60e-04 | 8 |
| GO:00024835 | Stomach | SIM | antigen processing and presentation of endogenous peptide antigen | 7/708 | 19/18723 | 3.63e-06 | 1.66e-04 | 7 |
| GO:00224095 | Stomach | SIM | positive regulation of cell-cell adhesion | 28/708 | 284/18723 | 3.86e-06 | 1.68e-04 | 28 |
| GO:19030395 | Stomach | SIM | positive regulation of leukocyte cell-cell adhesion | 25/708 | 239/18723 | 4.46e-06 | 1.88e-04 | 25 |
| GO:19030375 | Stomach | SIM | regulation of leukocyte cell-cell adhesion | 31/708 | 336/18723 | 4.73e-06 | 1.94e-04 | 31 |
| GO:00071595 | Stomach | SIM | leukocyte cell-cell adhesion | 33/708 | 371/18723 | 5.16e-06 | 2.08e-04 | 33 |
| GO:00508635 | Stomach | SIM | regulation of T cell activation | 29/708 | 329/18723 | 2.26e-05 | 7.00e-04 | 29 |
| GO:00706614 | Stomach | SIM | leukocyte proliferation | 28/708 | 318/18723 | 3.17e-05 | 9.35e-04 | 28 |
| GO:00420984 | Stomach | SIM | T cell proliferation | 20/708 | 199/18723 | 6.96e-05 | 1.79e-03 | 20 |
| GO:00019065 | Stomach | SIM | cell killing | 19/708 | 188/18723 | 9.73e-05 | 2.39e-03 | 19 |
| GO:00421104 | Stomach | SIM | T cell activation | 36/708 | 487/18723 | 1.05e-04 | 2.54e-03 | 36 |
| GO:00069595 | Stomach | SIM | humoral immune response | 26/708 | 317/18723 | 1.91e-04 | 4.00e-03 | 26 |
| Pathway ID | Tissue | Disease Stage | Description | Gene Ratio | Bg Ratio | pvalue | p.adjust | qvalue | Count |
| hsa0516718 | Breast | Precancer | Kaposi sarcoma-associated herpesvirus infection | 36/684 | 194/8465 | 1.68e-06 | 2.53e-05 | 1.94e-05 | 36 |
| hsa0461218 | Breast | Precancer | Antigen processing and presentation | 19/684 | 78/8465 | 9.61e-06 | 1.12e-04 | 8.62e-05 | 19 |
| hsa0516918 | Breast | Precancer | Epstein-Barr virus infection | 35/684 | 202/8465 | 1.15e-05 | 1.26e-04 | 9.64e-05 | 35 |
| hsa042189 | Breast | Precancer | Cellular senescence | 29/684 | 156/8465 | 1.66e-05 | 1.69e-04 | 1.30e-04 | 29 |
| hsa0414518 | Breast | Precancer | Phagosome | 27/684 | 152/8465 | 7.37e-05 | 6.85e-04 | 5.25e-04 | 27 |
| hsa0541618 | Breast | Precancer | Viral myocarditis | 14/684 | 60/8465 | 2.32e-04 | 1.98e-03 | 1.52e-03 | 14 |
| hsa0516618 | Breast | Precancer | Human T-cell leukemia virus 1 infection | 33/684 | 222/8465 | 4.29e-04 | 3.31e-03 | 2.53e-03 | 33 |
| hsa0516316 | Breast | Precancer | Human cytomegalovirus infection | 32/684 | 225/8465 | 1.13e-03 | 7.57e-03 | 5.80e-03 | 32 |
| hsa052036 | Breast | Precancer | Viral carcinogenesis | 27/684 | 204/8465 | 7.19e-03 | 4.06e-02 | 3.11e-02 | 27 |
| hsa0516719 | Breast | Precancer | Kaposi sarcoma-associated herpesvirus infection | 36/684 | 194/8465 | 1.68e-06 | 2.53e-05 | 1.94e-05 | 36 |
| hsa0461219 | Breast | Precancer | Antigen processing and presentation | 19/684 | 78/8465 | 9.61e-06 | 1.12e-04 | 8.62e-05 | 19 |
| hsa0516919 | Breast | Precancer | Epstein-Barr virus infection | 35/684 | 202/8465 | 1.15e-05 | 1.26e-04 | 9.64e-05 | 35 |
| hsa0421814 | Breast | Precancer | Cellular senescence | 29/684 | 156/8465 | 1.66e-05 | 1.69e-04 | 1.30e-04 | 29 |
| hsa0414519 | Breast | Precancer | Phagosome | 27/684 | 152/8465 | 7.37e-05 | 6.85e-04 | 5.25e-04 | 27 |
| hsa0541619 | Breast | Precancer | Viral myocarditis | 14/684 | 60/8465 | 2.32e-04 | 1.98e-03 | 1.52e-03 | 14 |
| hsa0516619 | Breast | Precancer | Human T-cell leukemia virus 1 infection | 33/684 | 222/8465 | 4.29e-04 | 3.31e-03 | 2.53e-03 | 33 |
| hsa0516317 | Breast | Precancer | Human cytomegalovirus infection | 32/684 | 225/8465 | 1.13e-03 | 7.57e-03 | 5.80e-03 | 32 |
| hsa0520312 | Breast | Precancer | Viral carcinogenesis | 27/684 | 204/8465 | 7.19e-03 | 4.06e-02 | 3.11e-02 | 27 |
| hsa0516922 | Breast | IDC | Epstein-Barr virus infection | 45/867 | 202/8465 | 3.16e-07 | 6.05e-06 | 4.52e-06 | 45 |
| hsa0461223 | Breast | IDC | Antigen processing and presentation | 24/867 | 78/8465 | 4.61e-07 | 8.33e-06 | 6.23e-06 | 24 |
| Hugo Symbol | Variant Class | Variant Classification | dbSNP RS | HGVSc | HGVSp | HGVSp Short | SWISSPROT | BIOTYPE | SIFT | PolyPhen | Tumor Sample Barcode | Tissue | Histology | Sex | Age | Stage | Therapy Types | Drugs | Outcome |
| HLA-A | SNV | Missense_Mutation | | c.640N>C | p.Thr214Pro | p.T214P | P04439,P13746,P16188 | protein_coding | deleterious_low_confidence(0) | probably_damaging(0.916) | TCGA-FU-A3HZ-01 | Cervix | cervical & endocervical cancer | Female | <65 | I/II | Chemotherapy | cisplatin | CR |
| HLA-A | SNV | Missense_Mutation | rs199474387 | c.187N>C | p.Asp63His | p.D63H | P04439,P13746,P16188 | protein_coding | deleterious_low_confidence(0) | probably_damaging(1) | TCGA-JW-A5VL-01 | Cervix | cervical & endocervical cancer | Female | <65 | I/II | Unknown | Unknown | SD |
| HLA-A | SNV | Missense_Mutation | rs199474481 | c.360N>C | p.Gln120His | p.Q120H | P04439,P13746,P16188 | protein_coding | deleterious_low_confidence(0) | benign(0.025) | TCGA-Q1-A73P-01 | Cervix | cervical & endocervical cancer | Female | <65 | I/II | Unknown | Unknown | SD |
| HLA-A | SNV | Missense_Mutation | | c.296N>C | p.Arg99Pro | p.R99P | P04439,P13746,P16188 | protein_coding | deleterious_low_confidence(0.04) | probably_damaging(0.954) | TCGA-UC-A7PI-01 | Cervix | cervical & endocervical cancer | Female | <65 | I/II | Unknown | Unknown | PD |
| HLA-A | SNV | Missense_Mutation | novel | c.1016G>A | p.Arg339Lys | p.R339K | P04439,P13746,P16188 | protein_coding | tolerated_low_confidence(0.95) | benign(0.019) | TCGA-VS-A9UD-01 | Cervix | cervical & endocervical cancer | Female | >=65 | III/IV | Chemotherapy | cisplatin | CR |
| HLA-A | insertion | Frame_Shift_Ins | novel | c.620_621insACCC | p.Asp207GlufsTer15 | p.D207Efs*15 | P04439,P13746,P16188 | protein_coding | | | TCGA-EK-A2PK-01 | Cervix | cervical & endocervical cancer | Female | <65 | I/II | Unknown | Unknown | SD |
| HLA-A | insertion | Frame_Shift_Ins | novel | c.620_621insC | p.Lys210GlnfsTer11 | p.K210Qfs*11 | P04439,P13746,P16188 | protein_coding | | | TCGA-EK-A2PL-01 | Cervix | cervical & endocervical cancer | Female | <65 | III/IV | Unknown | Unknown | SD |
| HLA-A | SNV | Missense_Mutation | novel | c.776C>A | p.Pro259His | p.P259H | P04439,P13746,P16188 | protein_coding | deleterious_low_confidence(0) | probably_damaging(1) | TCGA-5M-AAT6-01 | Colorectum | colon adenocarcinoma | Female | <65 | III/IV | Unknown | Unknown | PD |
| HLA-A | SNV | Missense_Mutation | | c.373N>C | p.Cys125Arg | p.C125R | P04439,P13746,P16188 | protein_coding | deleterious_low_confidence(0) | probably_damaging(1) | TCGA-A6-6781-01 | Colorectum | colon adenocarcinoma | Male | <65 | III/IV | Chemotherapy | oxaliplatin | SD |
| HLA-A | SNV | Missense_Mutation | rs758168864 | c.547T>C | p.Tyr183His | p.Y183H | P04439,P13746,P16188 | protein_coding | deleterious_low_confidence(0.02) | probably_damaging(0.956) | TCGA-AA-A00N-01 | Colorectum | colon adenocarcinoma | Male | >=65 | I/II | Unknown | Unknown | PD |
| Entrez ID | Symbol | Category | Interaction Types | Drug Claim Name | Drug Name | PMIDs |
| 3105 | HLA-A | CELL SURFACE, CLINICALLY ACTIONABLE, DRUGGABLE GENOME | | peginterferon alfa-2b | | 23360626 |
| 3105 | HLA-A | CELL SURFACE, CLINICALLY ACTIONABLE, DRUGGABLE GENOME | | zonisamide | ZONISAMIDE | 24236482 |
| 3105 | HLA-A | CELL SURFACE, CLINICALLY ACTIONABLE, DRUGGABLE GENOME | | terbinafine | TERBINAFINE | |
| 3105 | HLA-A | CELL SURFACE, CLINICALLY ACTIONABLE, DRUGGABLE GENOME | | peginterferon alfa-2a | | 23360626 |
| 3105 | HLA-A | CELL SURFACE, CLINICALLY ACTIONABLE, DRUGGABLE GENOME | | ticlopidine | TICLOPIDINE | 17339877 |
| 3105 | HLA-A | CELL SURFACE, CLINICALLY ACTIONABLE, DRUGGABLE GENOME | | Carbamazepine | CARBAMAZEPINE | |
| 3105 | HLA-A | CELL SURFACE, CLINICALLY ACTIONABLE, DRUGGABLE GENOME | | ribavirin | RIBAVIRIN | 23360626 |
| 3105 | HLA-A | CELL SURFACE, CLINICALLY ACTIONABLE, DRUGGABLE GENOME | | vancomycin | VANCOMYCIN | 32439433 |
| 3105 | HLA-A | CELL SURFACE, CLINICALLY ACTIONABLE, DRUGGABLE GENOME | | levetiracetam | LEVETIRACETAM | 30020991 |
| 3105 | HLA-A | CELL SURFACE, CLINICALLY ACTIONABLE, DRUGGABLE GENOME | | sertraline | SERTRALINE | |


