
|
|||||
|
 | |
| |
| |
| |
| |
| |
|
Gene: EFNA1 |
Gene summary for EFNA1 |
| Gene information | Species | Human | Gene symbol | EFNA1 | Gene ID | 1942 |
| Gene name | ephrin A1 | |
| Gene Alias | B61 | |
| Cytomap | 1q22 | |
| Gene Type | protein-coding | GO ID | GO:0000122 | UniProtAcc | P20827 |
Top |
Malignant transformation analysis |
| Identification of the aberrant gene expression in precancerous and cancerous lesions by comparing the gene expression of stem-like cells in diseased tissues with normal stem cells |
| Entrez ID | Symbol | Replicates | Species | Organ | Tissue | Adj P-value | Log2FC | Malignancy |
| 1942 | EFNA1 | GSM4909282 | Human | Breast | IDC | 1.08e-20 | 5.19e-01 | -0.0288 |
| 1942 | EFNA1 | GSM4909286 | Human | Breast | IDC | 1.27e-02 | -1.78e-01 | 0.1081 |
| 1942 | EFNA1 | GSM4909296 | Human | Breast | IDC | 4.36e-04 | -1.34e-01 | 0.1524 |
| 1942 | EFNA1 | GSM4909297 | Human | Breast | IDC | 1.64e-12 | -3.33e-01 | 0.1517 |
| 1942 | EFNA1 | GSM4909301 | Human | Breast | IDC | 3.69e-42 | 8.12e-01 | 0.1577 |
| 1942 | EFNA1 | GSM4909304 | Human | Breast | IDC | 2.06e-04 | -3.52e-01 | 0.1636 |
| 1942 | EFNA1 | GSM4909308 | Human | Breast | IDC | 4.11e-08 | 3.63e-01 | 0.158 |
| 1942 | EFNA1 | GSM4909311 | Human | Breast | IDC | 2.92e-25 | -2.98e-01 | 0.1534 |
| 1942 | EFNA1 | GSM4909312 | Human | Breast | IDC | 1.17e-05 | 1.23e-01 | 0.1552 |
| 1942 | EFNA1 | GSM4909319 | Human | Breast | IDC | 3.65e-28 | -3.00e-01 | 0.1563 |
| 1942 | EFNA1 | GSM4909321 | Human | Breast | IDC | 3.24e-07 | -6.71e-02 | 0.1559 |
| 1942 | EFNA1 | brca2 | Human | Breast | Precancer | 1.33e-04 | 3.34e-01 | -0.024 |
| 1942 | EFNA1 | brca3 | Human | Breast | Precancer | 3.60e-02 | 2.84e-01 | -0.0263 |
| 1942 | EFNA1 | brca7 | Human | Breast | Precancer | 2.56e-02 | 6.36e-01 | -0.009 |
| 1942 | EFNA1 | brca10 | Human | Breast | Precancer | 4.25e-12 | 5.64e-01 | -0.0029 |
| 1942 | EFNA1 | M1 | Human | Breast | IDC | 1.82e-03 | -3.92e-01 | 0.1577 |
| 1942 | EFNA1 | NCCBC11 | Human | Breast | DCIS | 2.34e-02 | -4.63e-01 | 0.1232 |
| 1942 | EFNA1 | NCCBC14 | Human | Breast | DCIS | 5.32e-06 | -4.04e-01 | 0.2021 |
| 1942 | EFNA1 | NCCBC3 | Human | Breast | DCIS | 9.36e-09 | -3.84e-01 | 0.1198 |
| 1942 | EFNA1 | NCCBC5 | Human | Breast | DCIS | 4.41e-15 | -5.66e-01 | 0.2046 |
| Page: 1 2 3 4 5 6 7 8 9 10 11 |
| Tissue | Expression Dynamics | Abbreviation |
| Breast | 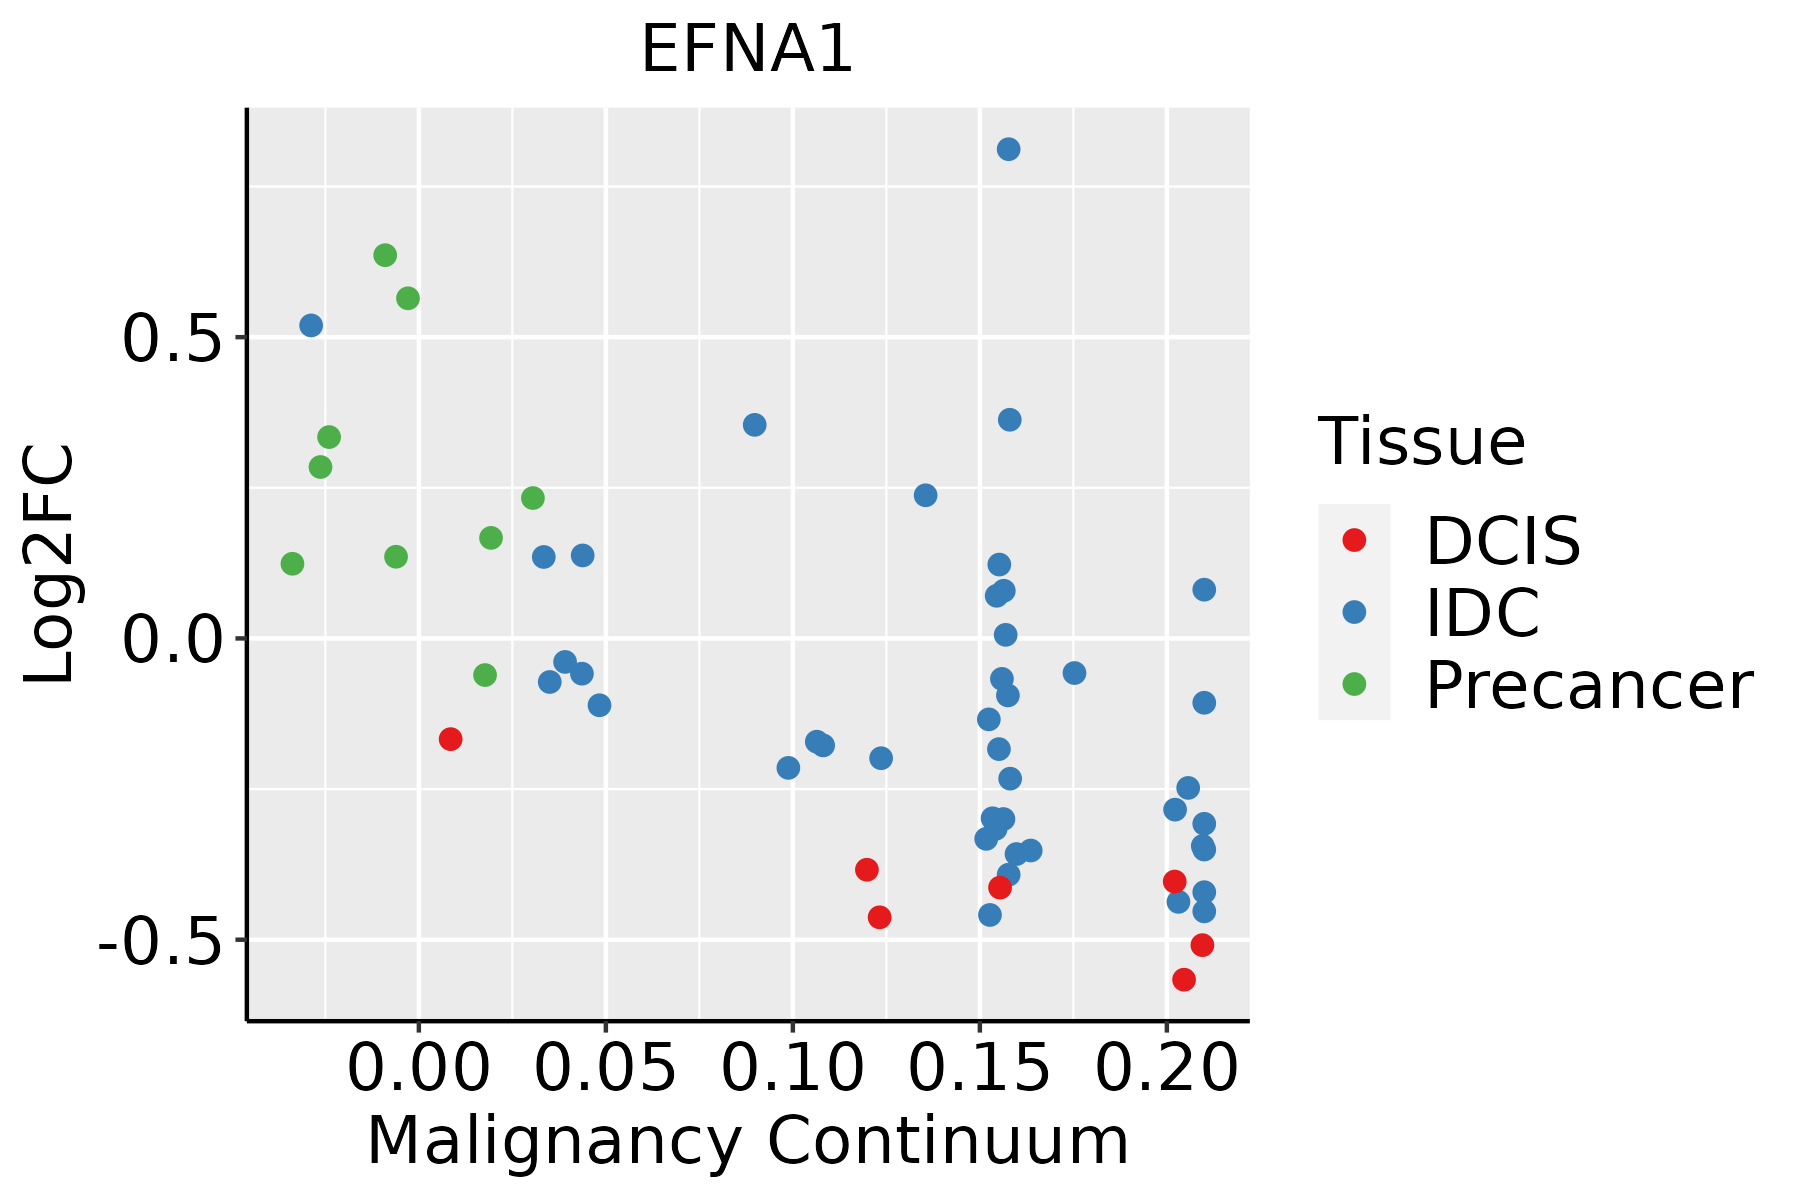 | IDC: Invasive ductal carcinoma |
| DCIS: Ductal carcinoma in situ | ||
| Precancer(BRCA1-mut): Precancerous lesion from BRCA1 mutation carriers | ||
| Cervix | 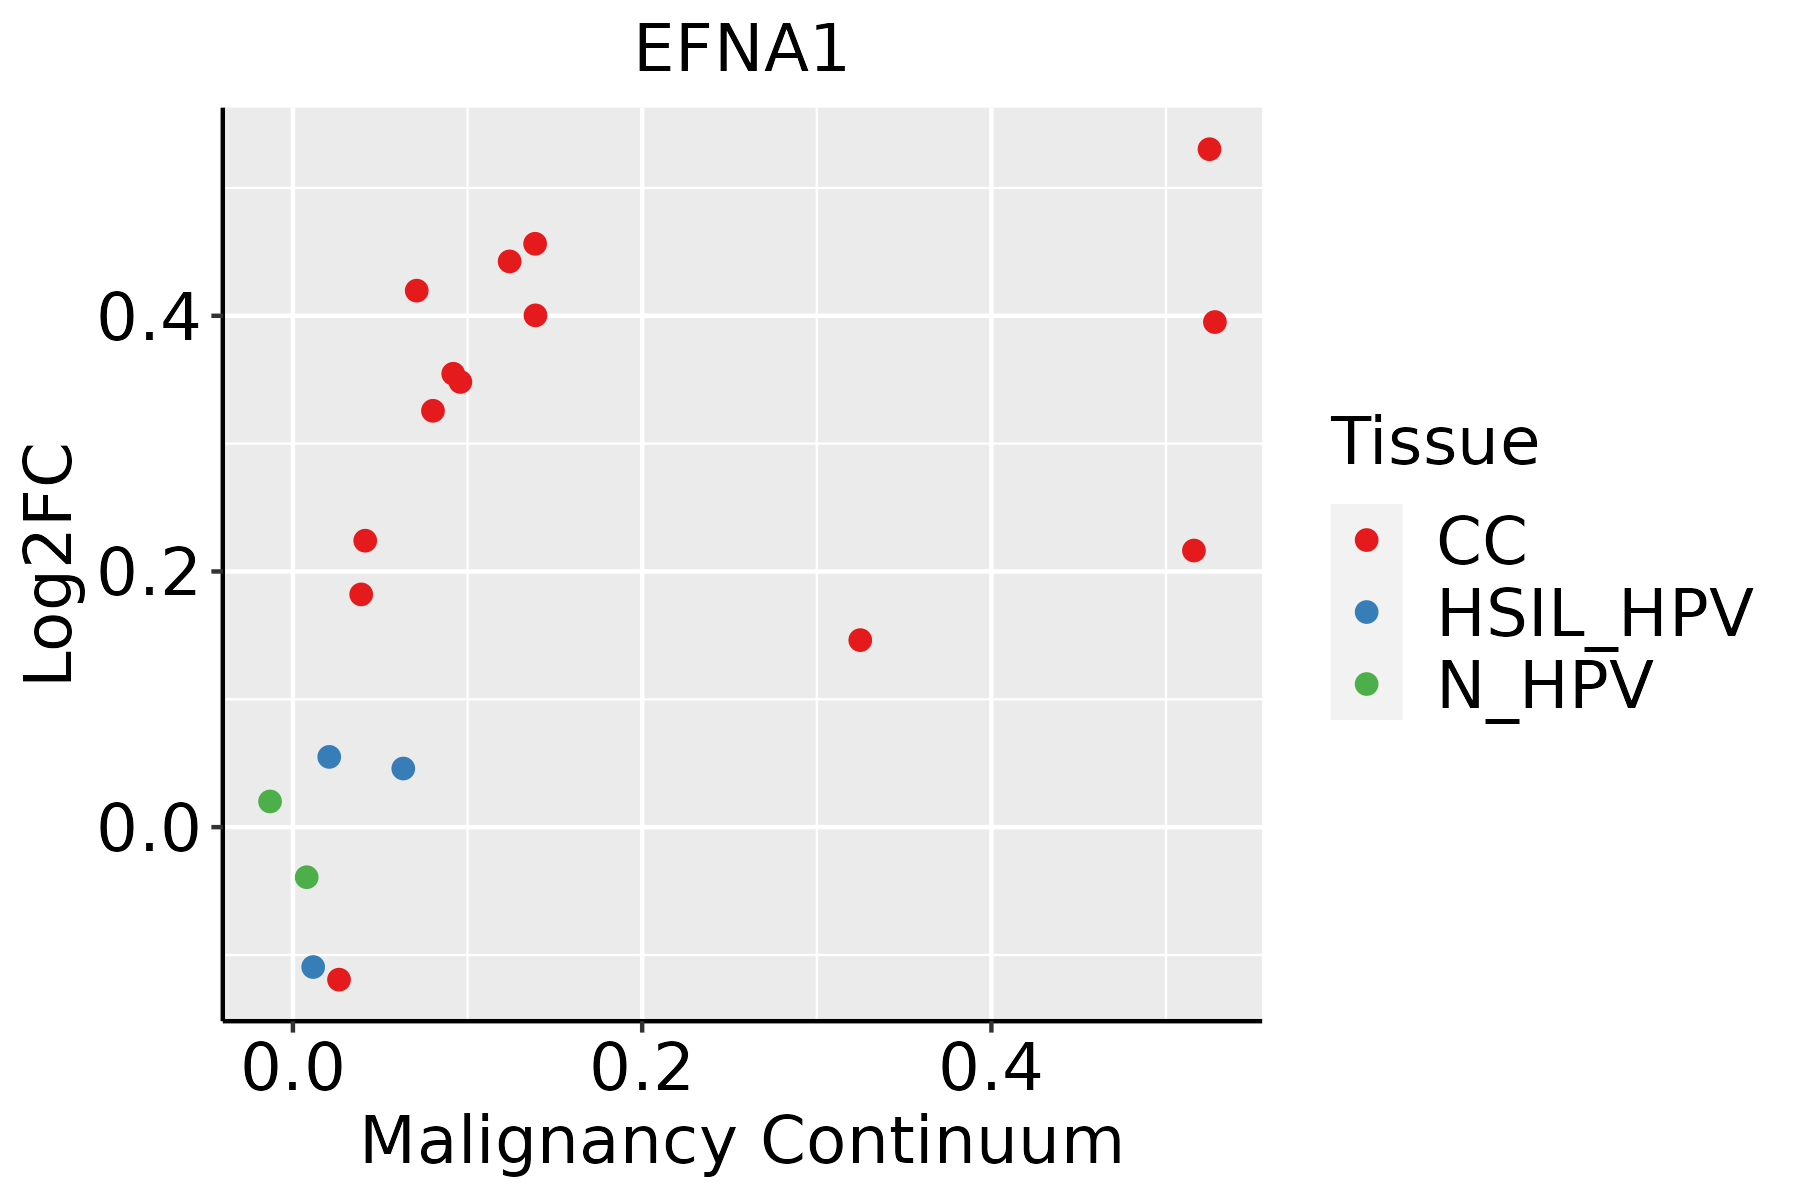 | CC: Cervix cancer |
| HSIL_HPV: HPV-infected high-grade squamous intraepithelial lesions | ||
| N_HPV: HPV-infected normal cervix | ||
| Colorectum (GSE201348) |  | FAP: Familial adenomatous polyposis |
| CRC: Colorectal cancer | ||
| Colorectum (HTA11) |  | AD: Adenomas |
| SER: Sessile serrated lesions | ||
| MSI-H: Microsatellite-high colorectal cancer | ||
| MSS: Microsatellite stable colorectal cancer | ||
| Esophagus | 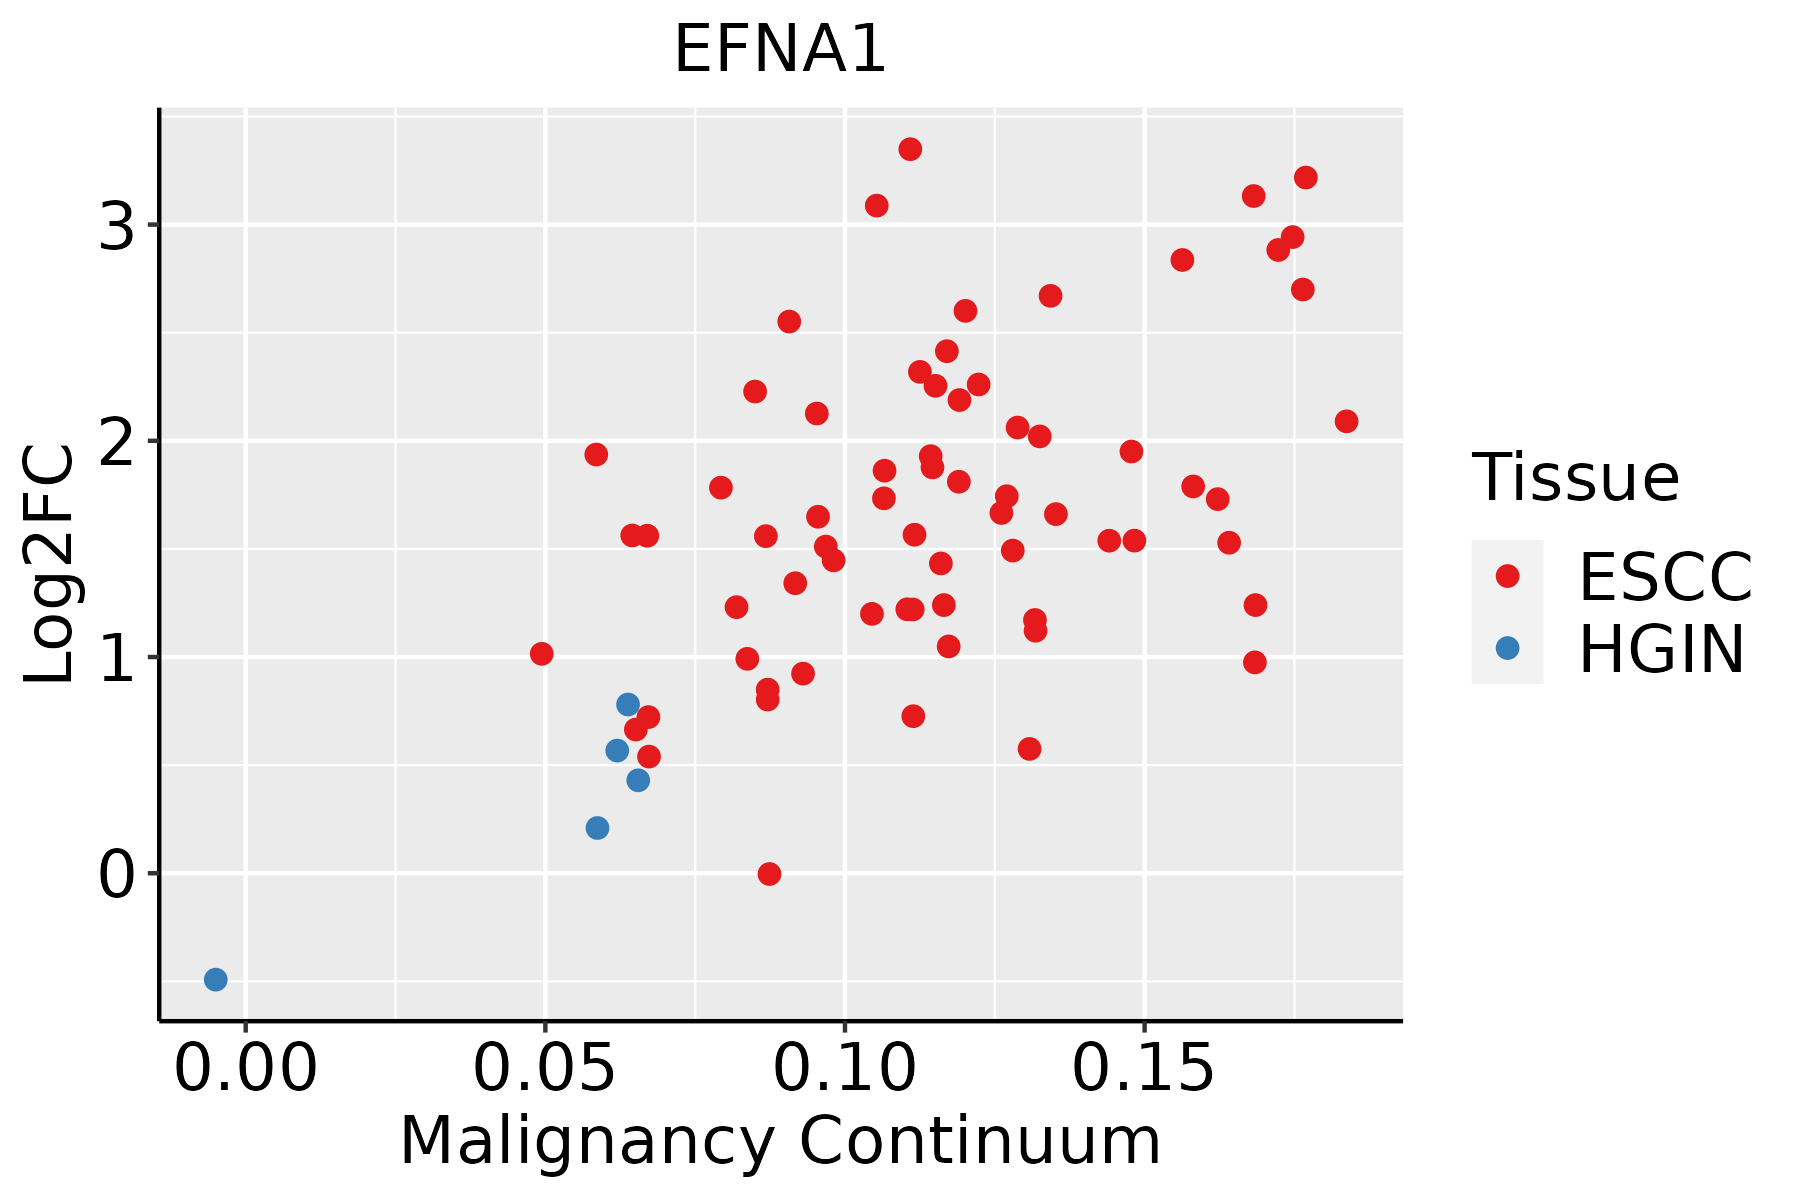 | ESCC: Esophageal squamous cell carcinoma |
| HGIN: High-grade intraepithelial neoplasias | ||
| LGIN: Low-grade intraepithelial neoplasias | ||
| Liver | 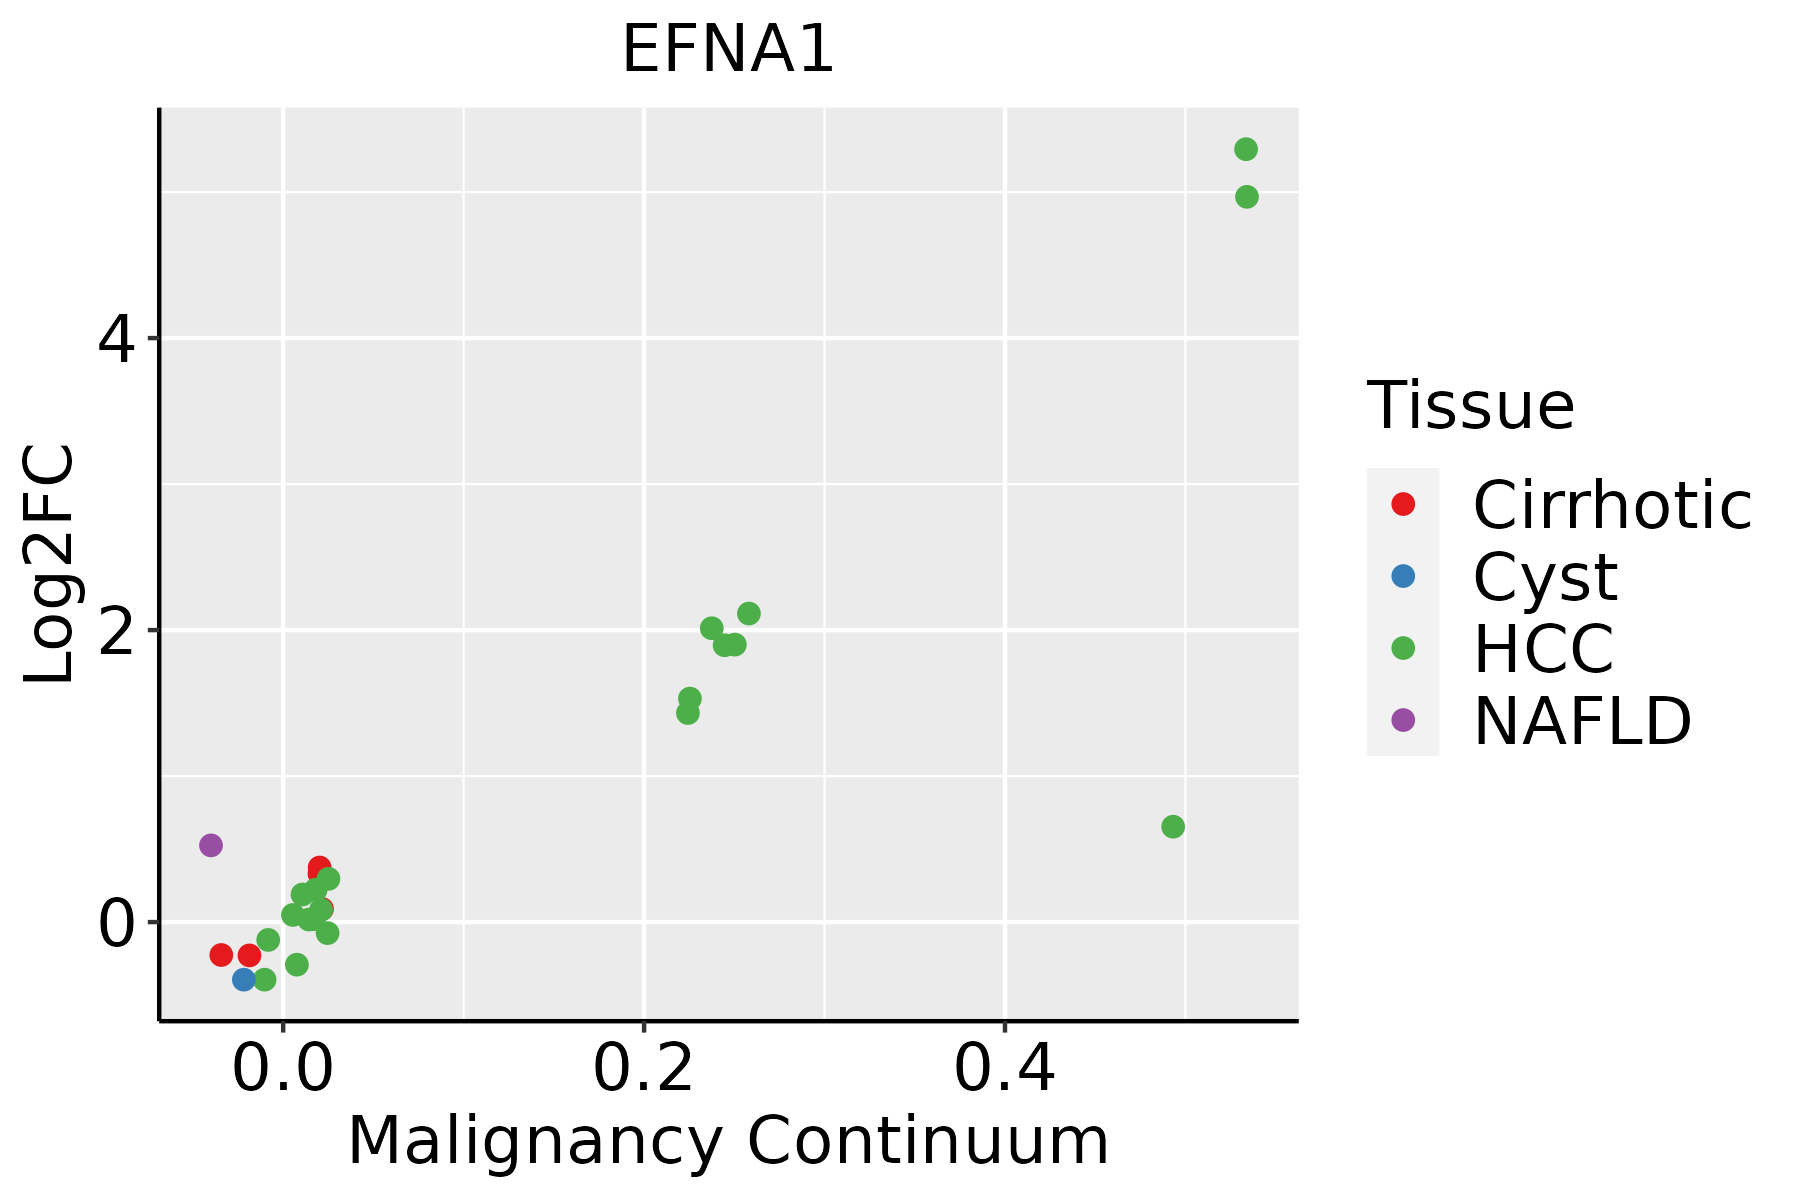 | HCC: Hepatocellular carcinoma |
| NAFLD: Non-alcoholic fatty liver disease | ||
| Oral Cavity | 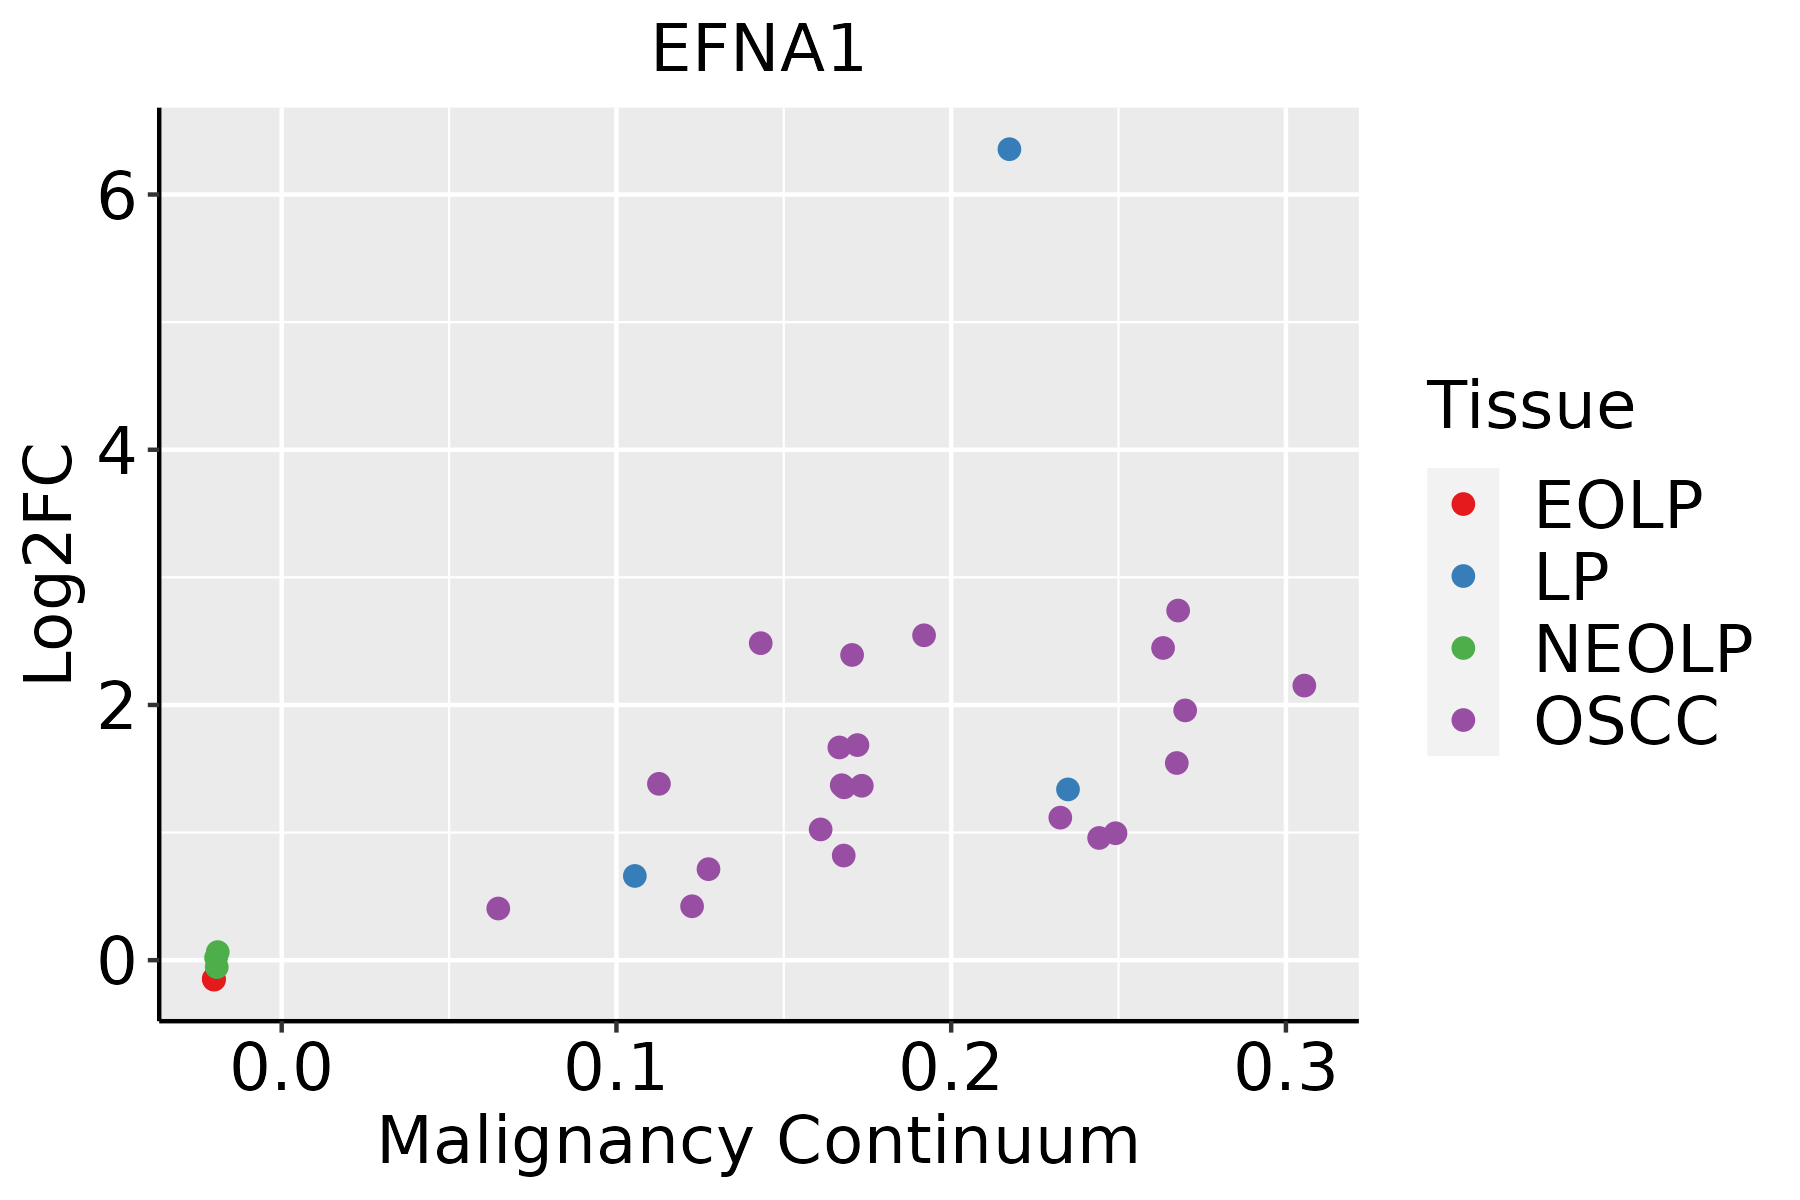 | EOLP: Erosive Oral lichen planus |
| LP: leukoplakia | ||
| NEOLP: Non-erosive oral lichen planus | ||
| OSCC: Oral squamous cell carcinoma | ||
| Prostate | 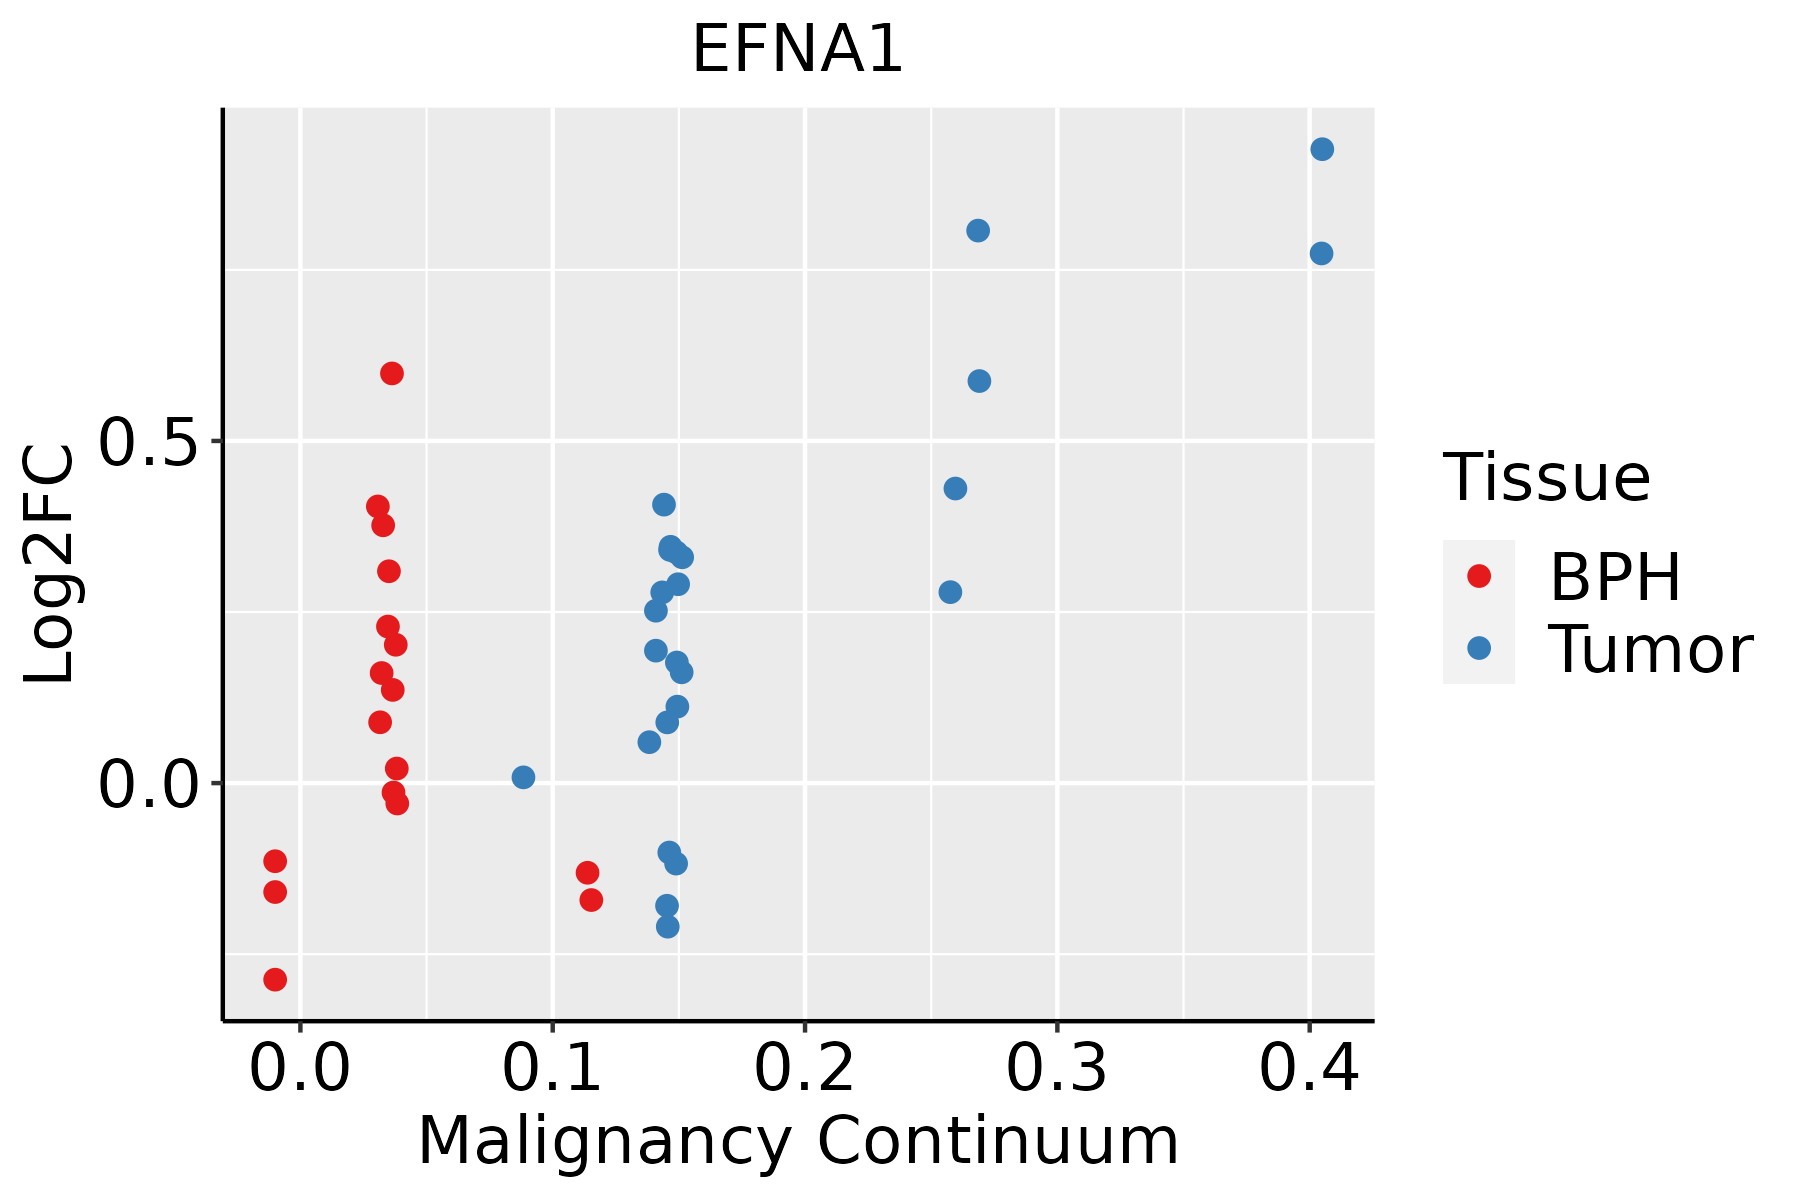 | BPH: Benign Prostatic Hyperplasia |
| Skin | 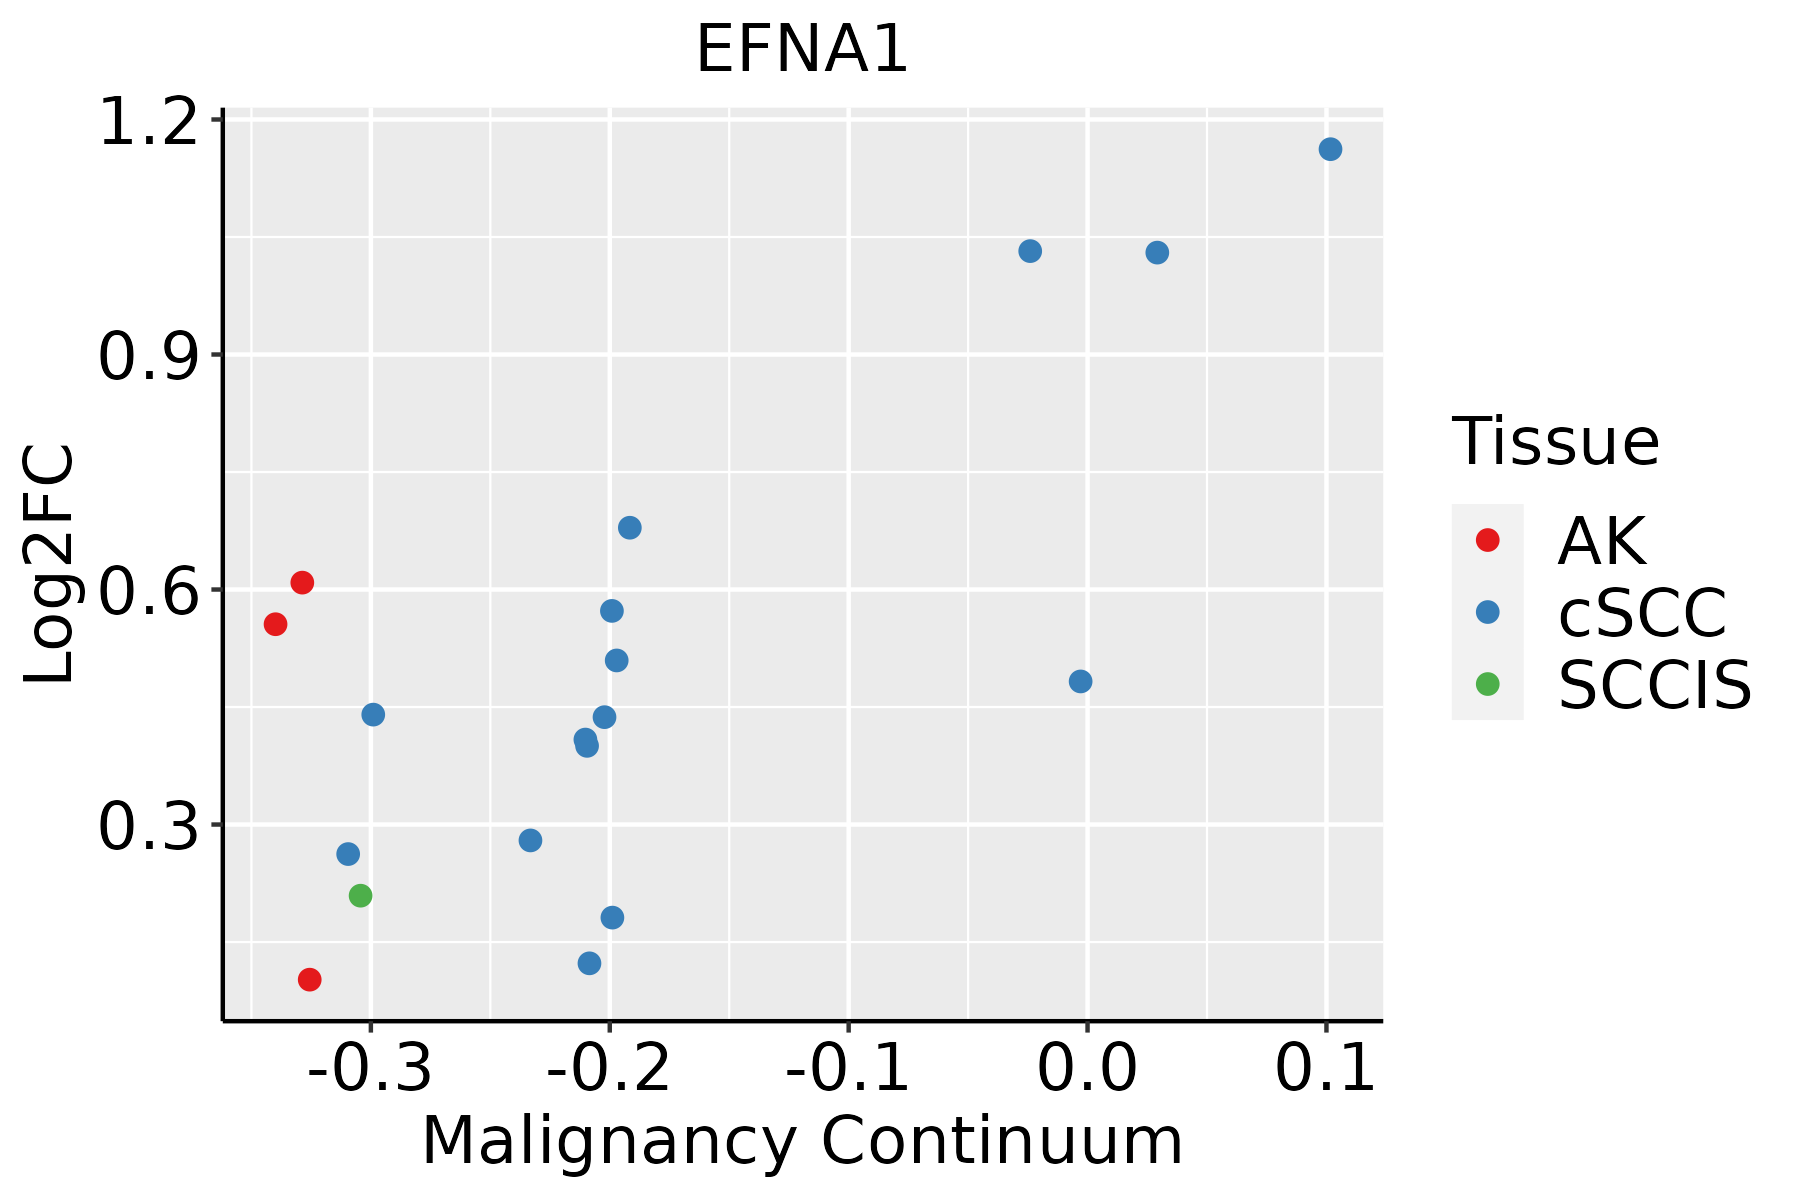 | AK: Actinic keratosis |
| cSCC: Cutaneous squamous cell carcinoma | ||
| SCCIS:squamous cell carcinoma in situ | ||
| Thyroid | 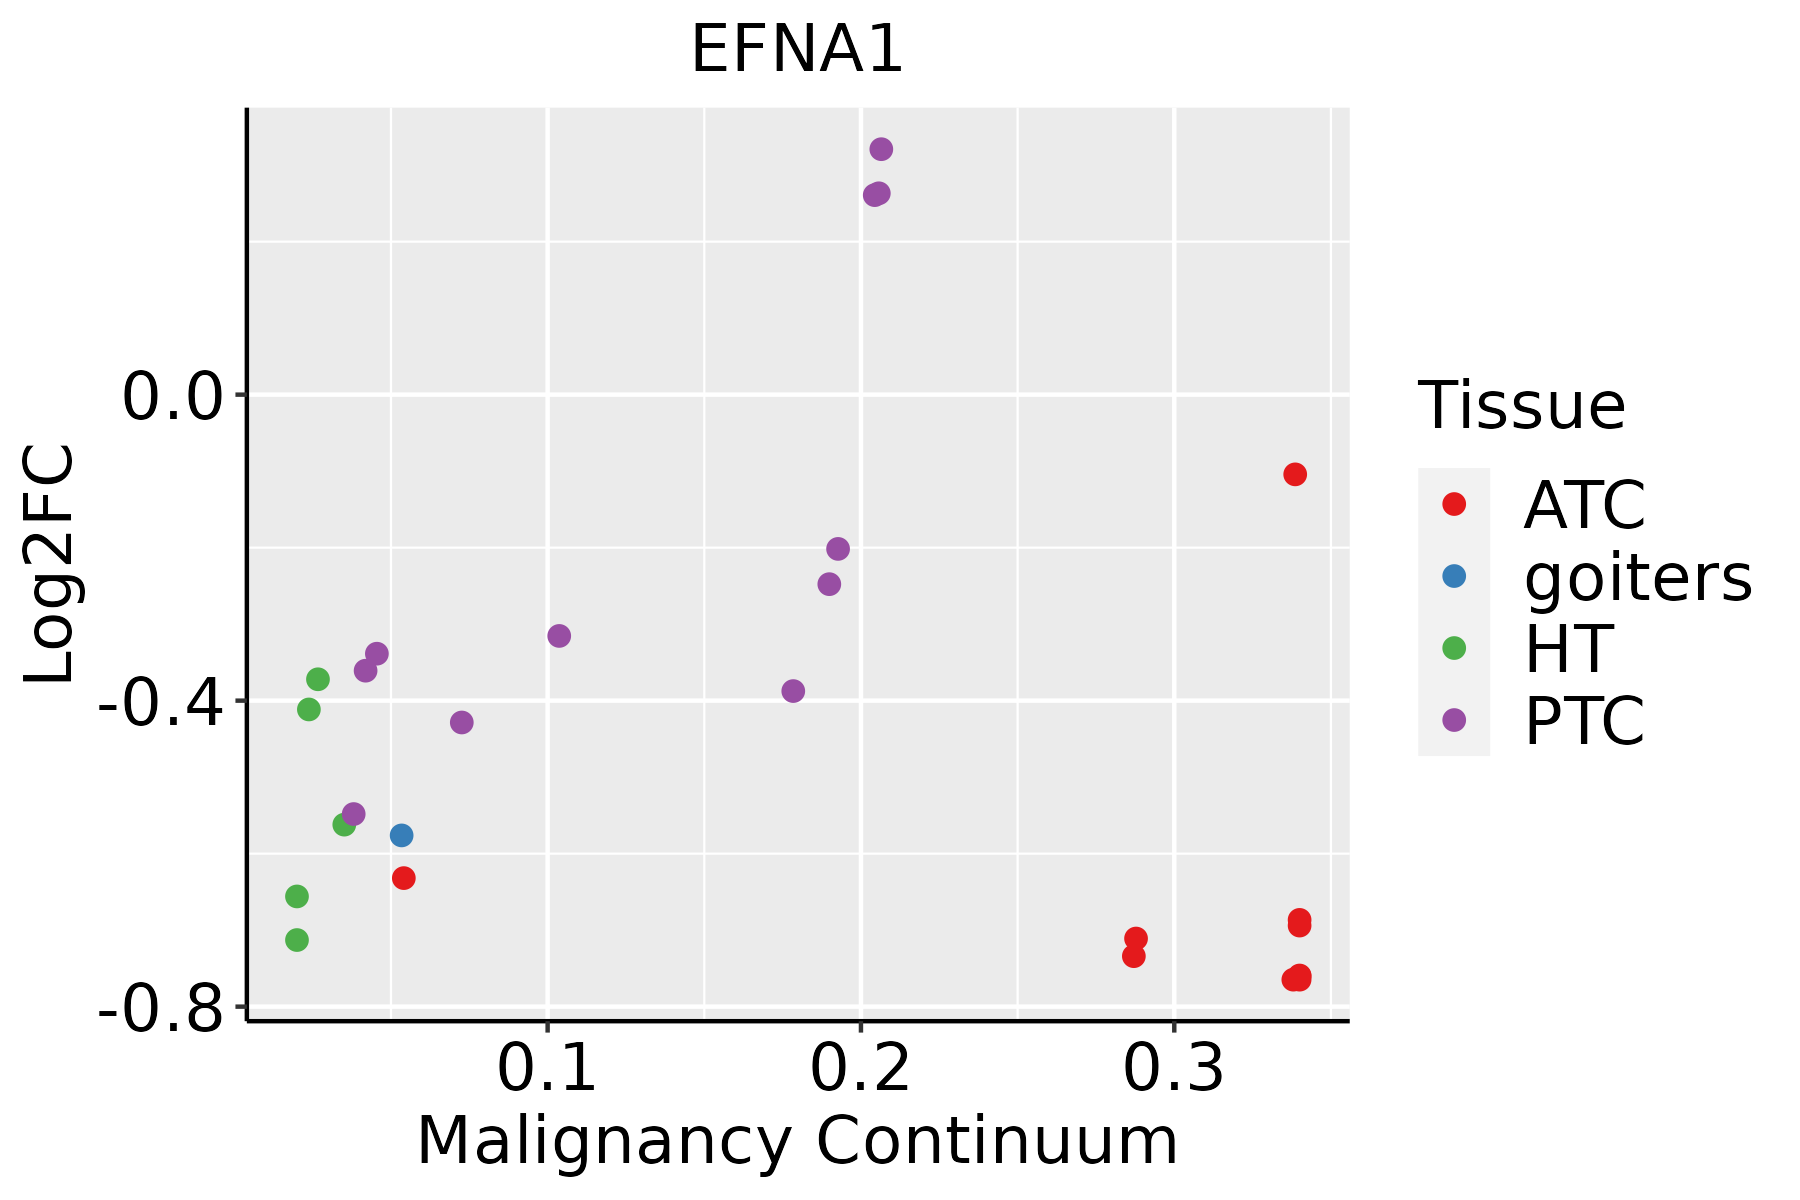 | ATC: Anaplastic thyroid cancer |
| HT: Hashimoto's thyroiditis | ||
| PTC: Papillary thyroid cancer |
| ∗log2FC in expression of this searched gene in stem-like cells from each diseased tissue sample relative to stem-like cells in normal samples in each tissue plotted against the malignancy continuum. Samples are colored based on if they are from different disease stage. |
Top |
Malignant transformation related pathway analysis |
| Find out the enriched GO biological processes and KEGG pathways involved in transition from healthy to precancer to cancer |
| Tissue | Disease Stage | Enriched GO biological Processes |
| Colorectum | AD |  |
| Colorectum | SER |  |
| Colorectum | MSS |  |
| Colorectum | MSI-H |  |
| Colorectum | FAP |  |
| ∗Top 15 enriched GO BP terms are showed in the bar plot of each disease state in each tissue. Each row represents a significant GO biological process which is colored according to the -log10(p.adjust). |
| Page: 1 2 3 4 5 6 7 8 9 |
| GO ID | Tissue | Disease Stage | Description | Gene Ratio | Bg Ratio | pvalue | p.adjust | Count |
| GO:0010632111 | Thyroid | PTC | regulation of epithelial cell migration | 123/5968 | 292/18723 | 1.33e-04 | 1.05e-03 | 123 |
| GO:00313459 | Thyroid | PTC | negative regulation of cell projection organization | 83/5968 | 186/18723 | 1.72e-04 | 1.32e-03 | 83 |
| GO:0010950113 | Thyroid | PTC | positive regulation of endopeptidase activity | 80/5968 | 179/18723 | 2.09e-04 | 1.55e-03 | 80 |
| GO:00610974 | Thyroid | PTC | regulation of protein tyrosine kinase activity | 45/5968 | 90/18723 | 2.57e-04 | 1.84e-03 | 45 |
| GO:00991754 | Thyroid | PTC | regulation of postsynapse organization | 45/5968 | 90/18723 | 2.57e-04 | 1.84e-03 | 45 |
| GO:00109778 | Thyroid | PTC | negative regulation of neuron projection development | 63/5968 | 137/18723 | 3.70e-04 | 2.50e-03 | 63 |
| GO:004876215 | Thyroid | PTC | mesenchymal cell differentiation | 99/5968 | 236/18723 | 6.72e-04 | 4.22e-03 | 99 |
| GO:00107175 | Thyroid | PTC | regulation of epithelial to mesenchymal transition | 46/5968 | 99/18723 | 1.66e-03 | 9.13e-03 | 46 |
| GO:004354219 | Thyroid | PTC | endothelial cell migration | 112/5968 | 279/18723 | 2.03e-03 | 1.09e-02 | 112 |
| GO:0043409112 | Thyroid | PTC | negative regulation of MAPK cascade | 76/5968 | 180/18723 | 2.15e-03 | 1.14e-02 | 76 |
| GO:003420511 | Thyroid | PTC | amyloid-beta formation | 29/5968 | 57/18723 | 2.18e-03 | 1.15e-02 | 29 |
| GO:00718872 | Thyroid | PTC | leukocyte apoptotic process | 48/5968 | 106/18723 | 2.58e-03 | 1.32e-02 | 48 |
| GO:0045861113 | Thyroid | PTC | negative regulation of proteolysis | 136/5968 | 351/18723 | 3.54e-03 | 1.71e-02 | 136 |
| GO:0060317 | Thyroid | PTC | cardiac epithelial to mesenchymal transition | 18/5968 | 32/18723 | 3.72e-03 | 1.79e-02 | 18 |
| GO:005043511 | Thyroid | PTC | amyloid-beta metabolic process | 32/5968 | 67/18723 | 4.75e-03 | 2.22e-02 | 32 |
| GO:00508089 | Thyroid | PTC | synapse organization | 161/5968 | 426/18723 | 5.11e-03 | 2.36e-02 | 161 |
| GO:00031705 | Thyroid | PTC | heart valve development | 31/5968 | 65/18723 | 5.54e-03 | 2.52e-02 | 31 |
| GO:00031812 | Thyroid | PTC | atrioventricular valve morphogenesis | 14/5968 | 24/18723 | 6.65e-03 | 2.89e-02 | 14 |
| GO:00508074 | Thyroid | PTC | regulation of synapse organization | 84/5968 | 211/18723 | 8.72e-03 | 3.64e-02 | 84 |
| GO:006048514 | Thyroid | PTC | mesenchyme development | 112/5968 | 291/18723 | 9.48e-03 | 3.90e-02 | 112 |
| Page: 1 2 3 4 5 6 7 8 9 10 11 12 13 14 15 16 17 18 19 20 21 22 23 24 25 26 27 28 29 30 31 32 33 34 35 36 37 38 39 40 41 42 43 44 45 46 47 48 49 50 |
| Pathway ID | Tissue | Disease Stage | Description | Gene Ratio | Bg Ratio | pvalue | p.adjust | qvalue | Count |
| hsa0401512 | Cervix | CC | Rap1 signaling pathway | 56/1267 | 210/8465 | 6.23e-06 | 5.61e-05 | 3.32e-05 | 56 |
| hsa043609 | Cervix | CC | Axon guidance | 47/1267 | 182/8465 | 8.13e-05 | 5.38e-04 | 3.18e-04 | 47 |
| hsa040142 | Cervix | CC | Ras signaling pathway | 51/1267 | 236/8465 | 3.55e-03 | 1.34e-02 | 7.91e-03 | 51 |
| hsa040109 | Cervix | CC | MAPK signaling pathway | 62/1267 | 302/8465 | 4.89e-03 | 1.67e-02 | 9.86e-03 | 62 |
| hsa0401513 | Cervix | CC | Rap1 signaling pathway | 56/1267 | 210/8465 | 6.23e-06 | 5.61e-05 | 3.32e-05 | 56 |
| hsa0436012 | Cervix | CC | Axon guidance | 47/1267 | 182/8465 | 8.13e-05 | 5.38e-04 | 3.18e-04 | 47 |
| hsa0401411 | Cervix | CC | Ras signaling pathway | 51/1267 | 236/8465 | 3.55e-03 | 1.34e-02 | 7.91e-03 | 51 |
| hsa0401012 | Cervix | CC | MAPK signaling pathway | 62/1267 | 302/8465 | 4.89e-03 | 1.67e-02 | 9.86e-03 | 62 |
| hsa04015 | Colorectum | AD | Rap1 signaling pathway | 71/2092 | 210/8465 | 1.72e-03 | 9.68e-03 | 6.18e-03 | 71 |
| hsa04360 | Colorectum | AD | Axon guidance | 61/2092 | 182/8465 | 4.36e-03 | 2.17e-02 | 1.38e-02 | 61 |
| hsa040151 | Colorectum | AD | Rap1 signaling pathway | 71/2092 | 210/8465 | 1.72e-03 | 9.68e-03 | 6.18e-03 | 71 |
| hsa043601 | Colorectum | AD | Axon guidance | 61/2092 | 182/8465 | 4.36e-03 | 2.17e-02 | 1.38e-02 | 61 |
| hsa040152 | Colorectum | SER | Rap1 signaling pathway | 54/1580 | 210/8465 | 6.55e-03 | 3.68e-02 | 2.67e-02 | 54 |
| hsa040153 | Colorectum | SER | Rap1 signaling pathway | 54/1580 | 210/8465 | 6.55e-03 | 3.68e-02 | 2.67e-02 | 54 |
| hsa040154 | Colorectum | MSS | Rap1 signaling pathway | 66/1875 | 210/8465 | 1.03e-03 | 5.94e-03 | 3.64e-03 | 66 |
| hsa043602 | Colorectum | MSS | Axon guidance | 54/1875 | 182/8465 | 1.03e-02 | 3.69e-02 | 2.26e-02 | 54 |
| hsa040155 | Colorectum | MSS | Rap1 signaling pathway | 66/1875 | 210/8465 | 1.03e-03 | 5.94e-03 | 3.64e-03 | 66 |
| hsa043603 | Colorectum | MSS | Axon guidance | 54/1875 | 182/8465 | 1.03e-02 | 3.69e-02 | 2.26e-02 | 54 |
| hsa040158 | Colorectum | CRC | Rap1 signaling pathway | 48/1091 | 210/8465 | 4.00e-05 | 8.70e-04 | 5.90e-04 | 48 |
| hsa043606 | Colorectum | CRC | Axon guidance | 43/1091 | 182/8465 | 4.38e-05 | 8.70e-04 | 5.90e-04 | 43 |
| Page: 1 2 3 |
Top |
Cell-cell communication analysis |
| Identification of potential cell-cell interactions between two cell types and their ligand-receptor pairs for different disease states |
| Ligand | Receptor | LRpair | Pathway | Tissue | Disease Stage |
| EFNA1 | EPHA2 | EFNA1_EPHA2 | EPHA | Breast | DCIS |
| EFNA1 | EPHA2 | EFNA1_EPHA2 | EPHA | Cervix | ADJ |
| EFNA1 | EPHA2 | EFNA1_EPHA2 | EPHA | Cervix | CC |
| EFNA1 | EPHA4 | EFNA1_EPHA4 | EPHA | Cervix | CC |
| EFNA1 | EPHA4 | EFNA1_EPHA4 | EPHA | CRC | AD |
| EFNA1 | EPHA3 | EFNA1_EPHA3 | EPHA | CRC | ADJ |
| EFNA1 | EPHA4 | EFNA1_EPHA4 | EPHA | CRC | ADJ |
| EFNA1 | EPHA2 | EFNA1_EPHA2 | EPHA | CRC | FAP |
| EFNA1 | EPHA3 | EFNA1_EPHA3 | EPHA | CRC | FAP |
| EFNA1 | EPHA4 | EFNA1_EPHA4 | EPHA | CRC | FAP |
| EFNA1 | EPHA4 | EFNA1_EPHA4 | EPHA | CRC | Healthy |
| EFNA1 | EPHA2 | EFNA1_EPHA2 | EPHA | CRC | MSI-H |
| EFNA1 | EPHA4 | EFNA1_EPHA4 | EPHA | CRC | MSI-H |
| EFNA1 | EPHA5 | EFNA1_EPHA5 | EPHA | CRC | MSI-H |
| EFNA1 | EPHA2 | EFNA1_EPHA2 | EPHA | CRC | MSS |
| EFNA1 | EPHA2 | EFNA1_EPHA2 | EPHA | Endometrium | ADJ |
| EFNA1 | EPHA3 | EFNA1_EPHA3 | EPHA | Endometrium | ADJ |
| EFNA1 | EPHA4 | EFNA1_EPHA4 | EPHA | Endometrium | ADJ |
| EFNA1 | EPHA2 | EFNA1_EPHA2 | EPHA | Endometrium | AEH |
| EFNA1 | EPHA3 | EFNA1_EPHA3 | EPHA | Endometrium | AEH |
| Page: 1 2 3 4 |
Top |
Single-cell gene regulatory network inference analysis |
| Find out the significant the regulons (TFs) and the target genes of each regulon across cell types for different disease states |
| TF | Cell Type | Tissue | Disease Stage | Target Gene | RSS | Regulon Activity |
| ∗The dot plots of a searched regulon are shown for all cell subpopulations in each disease state of each tissue based on the regulon specific score inferred using pySCENIC and by calculating the average expression. |
| Page: 1 |
Top |
Somatic mutation of malignant transformation related genes |
| Annotation of somatic variants for genes involved in malignant transformation |
| Hugo Symbol | Variant Class | Variant Classification | dbSNP RS | HGVSc | HGVSp | HGVSp Short | SWISSPROT | BIOTYPE | SIFT | PolyPhen | Tumor Sample Barcode | Tissue | Histology | Sex | Age | Stage | Therapy Types | Drugs | Outcome |
| EFNA1 | SNV | Missense_Mutation | novel | c.154N>G | p.Pro52Ala | p.P52A | P20827 | protein_coding | deleterious(0) | probably_damaging(1) | TCGA-AC-A5XS-01 | Breast | breast invasive carcinoma | Female | >=65 | I/II | Hormone Therapy | femara | SD |
| EFNA1 | SNV | Missense_Mutation | rs755272713 | c.115N>G | p.Ile39Val | p.I39V | P20827 | protein_coding | tolerated(1) | benign(0) | TCGA-B6-A409-01 | Breast | breast invasive carcinoma | Female | <65 | III/IV | Chemotherapy | cyclophosphamide | PD |
| EFNA1 | SNV | Missense_Mutation | rs760965678 | c.416N>T | p.Arg139Leu | p.R139L | P20827 | protein_coding | tolerated(0.2) | benign(0.04) | TCGA-AA-A02K-01 | Colorectum | colon adenocarcinoma | Male | <65 | III/IV | Chemotherapy | folinic | PD |
| EFNA1 | SNV | Missense_Mutation | c.500C>T | p.Ala167Val | p.A167V | P20827 | protein_coding | tolerated(0.12) | benign(0.015) | TCGA-CK-4951-01 | Colorectum | colon adenocarcinoma | Female | >=65 | I/II | Unknown | Unknown | PD | |
| EFNA1 | SNV | Missense_Mutation | rs548758015 | c.328N>T | p.Arg110Cys | p.R110C | P20827 | protein_coding | deleterious(0) | probably_damaging(0.999) | TCGA-G4-6320-01 | Colorectum | colon adenocarcinoma | Male | >=65 | III/IV | Chemotherapy | oxaliplatin | SD |
| EFNA1 | SNV | Missense_Mutation | novel | c.496C>A | p.Leu166Ile | p.L166I | P20827 | protein_coding | tolerated(0.3) | benign(0.017) | TCGA-AJ-A23O-01 | Endometrium | uterine corpus endometrioid carcinoma | Female | >=65 | I/II | Unknown | Unknown | SD |
| EFNA1 | SNV | Missense_Mutation | c.415N>T | p.Arg139Cys | p.R139C | P20827 | protein_coding | deleterious(0.04) | possibly_damaging(0.6) | TCGA-AX-A05S-01 | Endometrium | uterine corpus endometrioid carcinoma | Female | >=65 | III/IV | Unspecific | Carboplatin & Paclitaxel | PD | |
| EFNA1 | SNV | Missense_Mutation | novel | c.200N>G | p.Tyr67Cys | p.Y67C | P20827 | protein_coding | deleterious(0) | probably_damaging(1) | TCGA-AX-A05Z-01 | Endometrium | uterine corpus endometrioid carcinoma | Female | <65 | III/IV | Chemotherapy | adriamycin | SD |
| EFNA1 | SNV | Missense_Mutation | rs762981577 | c.184N>A | p.Ala62Thr | p.A62T | P20827 | protein_coding | tolerated(0.61) | benign(0) | TCGA-AX-A06F-01 | Endometrium | uterine corpus endometrioid carcinoma | Female | <65 | III/IV | Chemotherapy | carboplatin | SD |
| EFNA1 | SNV | Missense_Mutation | novel | c.551N>T | p.Ala184Val | p.A184V | P20827 | protein_coding | deleterious(0.03) | possibly_damaging(0.79) | TCGA-BG-A222-01 | Endometrium | uterine corpus endometrioid carcinoma | Female | <65 | I/II | Unknown | Unknown | SD |
| Page: 1 2 |
Top |
Related drugs of malignant transformation related genes |
| Identification of chemicals and drugs interact with genes involved in malignant transfromation |
| (DGIdb 4.0) |
| Entrez ID | Symbol | Category | Interaction Types | Drug Claim Name | Drug Name | PMIDs |
| Page: 1 |

Copyright 2023-Present -The University of Texas Health Science Center at Houston |