
|
|||||
|
 | |
| |
| |
| |
| |
| |
|
Gene: ZC3H12A |
Gene summary for ZC3H12A |
| Gene information | Species | Human | Gene symbol | ZC3H12A | Gene ID | 80149 |
| Gene name | zinc finger CCCH-type containing 12A | |
| Gene Alias | MCPIP | |
| Cytomap | 1p34.3 | |
| Gene Type | protein-coding | GO ID | GO:0000165 | UniProtAcc | Q5D1E8 |
Top |
Malignant transformation analysis |
| Identification of the aberrant gene expression in precancerous and cancerous lesions by comparing the gene expression of stem-like cells in diseased tissues with normal stem cells |
| Entrez ID | Symbol | Replicates | Species | Organ | Tissue | Adj P-value | Log2FC | Malignancy |
| 80149 | ZC3H12A | LZE8T | Human | Esophagus | ESCC | 3.92e-23 | 1.39e+00 | 0.067 |
| 80149 | ZC3H12A | LZE20T | Human | Esophagus | ESCC | 1.23e-03 | 7.61e-01 | 0.0662 |
| 80149 | ZC3H12A | LZE24T | Human | Esophagus | ESCC | 5.58e-14 | 1.14e+00 | 0.0596 |
| 80149 | ZC3H12A | LZE21T | Human | Esophagus | ESCC | 4.72e-03 | 9.34e-01 | 0.0655 |
| 80149 | ZC3H12A | P1T-E | Human | Esophagus | ESCC | 5.46e-16 | 1.51e+00 | 0.0875 |
| 80149 | ZC3H12A | P2T-E | Human | Esophagus | ESCC | 8.06e-38 | 1.27e+00 | 0.1177 |
| 80149 | ZC3H12A | P4T-E | Human | Esophagus | ESCC | 2.12e-17 | 7.93e-01 | 0.1323 |
| 80149 | ZC3H12A | P5T-E | Human | Esophagus | ESCC | 6.03e-30 | 9.50e-01 | 0.1327 |
| 80149 | ZC3H12A | P8T-E | Human | Esophagus | ESCC | 6.27e-12 | 7.93e-01 | 0.0889 |
| 80149 | ZC3H12A | P9T-E | Human | Esophagus | ESCC | 4.68e-08 | 3.87e-01 | 0.1131 |
| 80149 | ZC3H12A | P10T-E | Human | Esophagus | ESCC | 2.66e-06 | -1.50e-01 | 0.116 |
| 80149 | ZC3H12A | P11T-E | Human | Esophagus | ESCC | 1.64e-17 | 1.68e+00 | 0.1426 |
| 80149 | ZC3H12A | P15T-E | Human | Esophagus | ESCC | 5.62e-14 | 7.66e-01 | 0.1149 |
| 80149 | ZC3H12A | P20T-E | Human | Esophagus | ESCC | 8.48e-35 | 1.98e+00 | 0.1124 |
| 80149 | ZC3H12A | P21T-E | Human | Esophagus | ESCC | 7.09e-46 | 1.78e+00 | 0.1617 |
| 80149 | ZC3H12A | P22T-E | Human | Esophagus | ESCC | 1.77e-03 | -8.40e-02 | 0.1236 |
| 80149 | ZC3H12A | P23T-E | Human | Esophagus | ESCC | 4.16e-49 | 2.25e+00 | 0.108 |
| 80149 | ZC3H12A | P24T-E | Human | Esophagus | ESCC | 8.32e-06 | 5.47e-01 | 0.1287 |
| 80149 | ZC3H12A | P26T-E | Human | Esophagus | ESCC | 2.57e-10 | 7.52e-01 | 0.1276 |
| 80149 | ZC3H12A | P27T-E | Human | Esophagus | ESCC | 7.78e-29 | 1.42e+00 | 0.1055 |
| Page: 1 2 3 4 5 6 |
| Tissue | Expression Dynamics | Abbreviation |
| Esophagus | 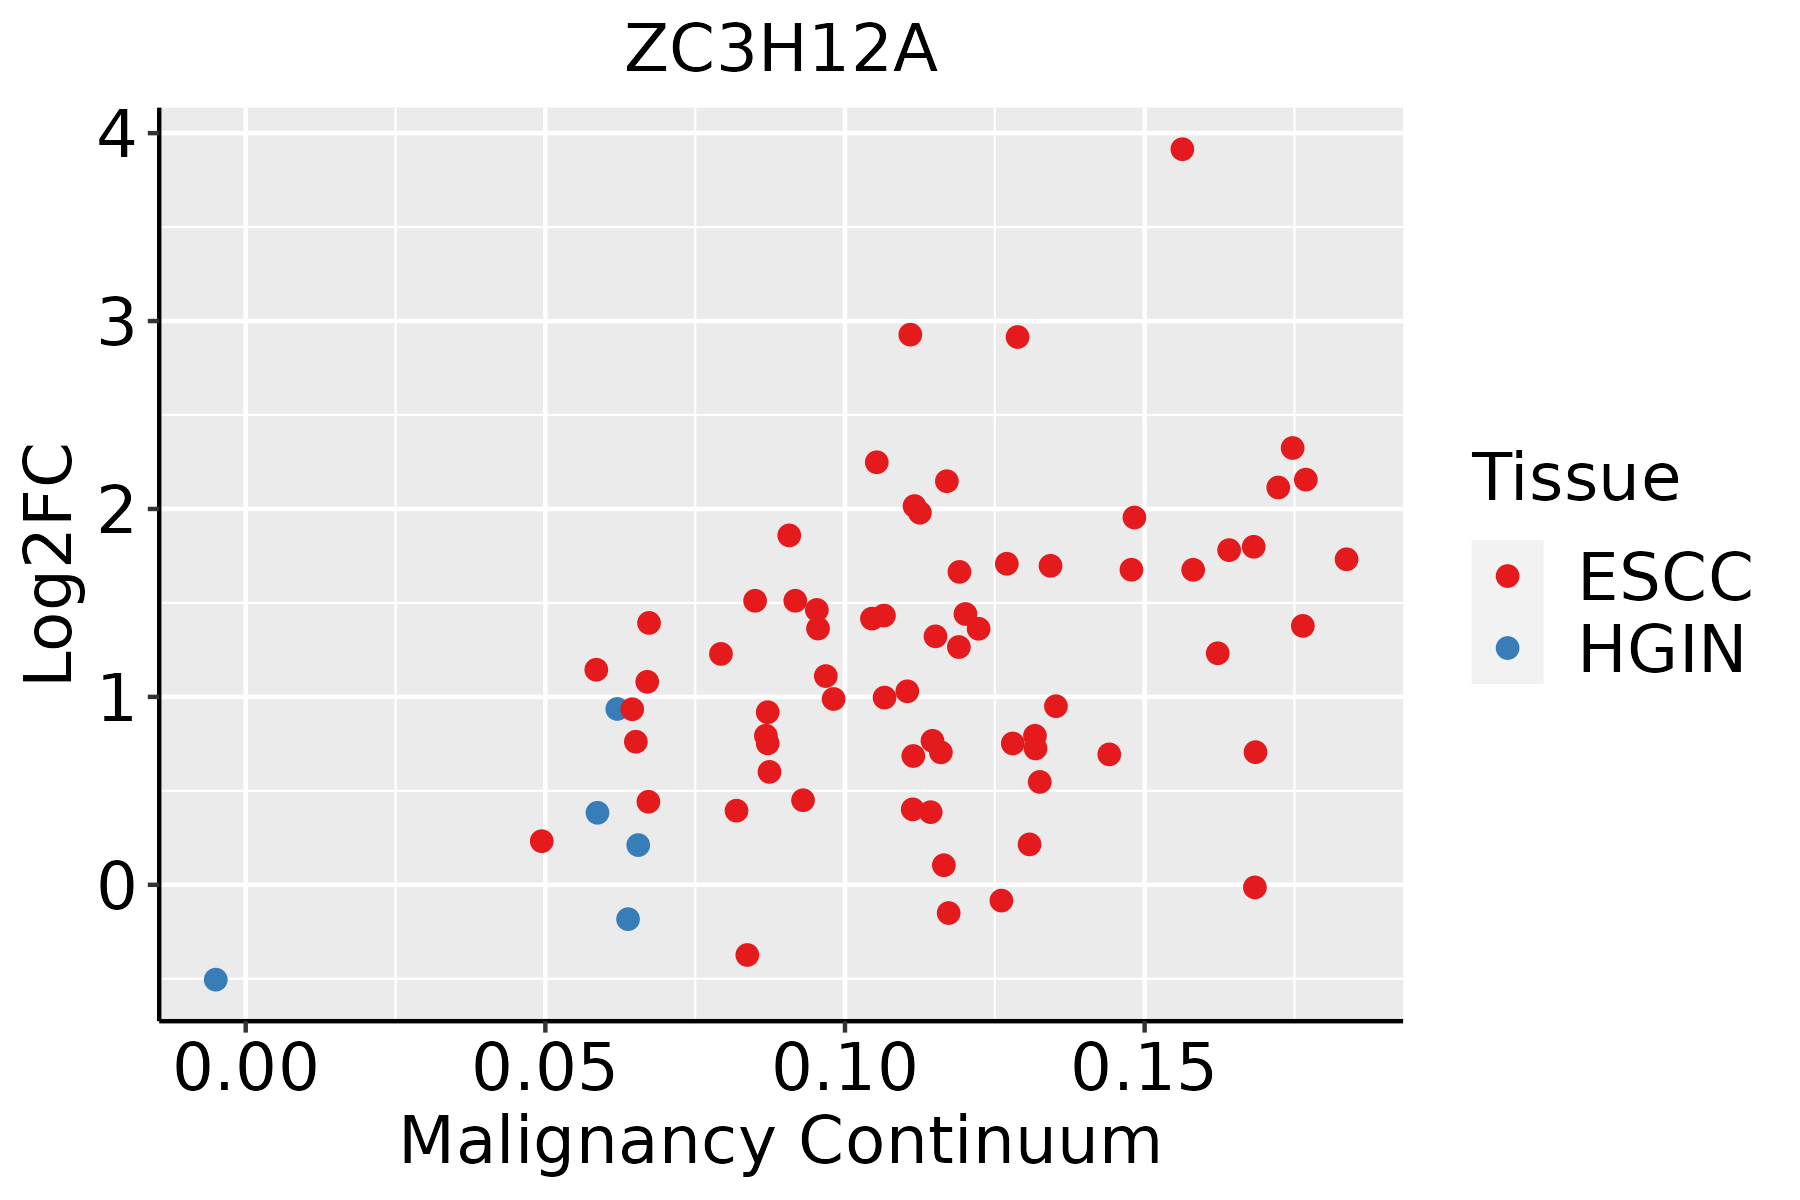 | ESCC: Esophageal squamous cell carcinoma |
| HGIN: High-grade intraepithelial neoplasias | ||
| LGIN: Low-grade intraepithelial neoplasias | ||
| Liver | 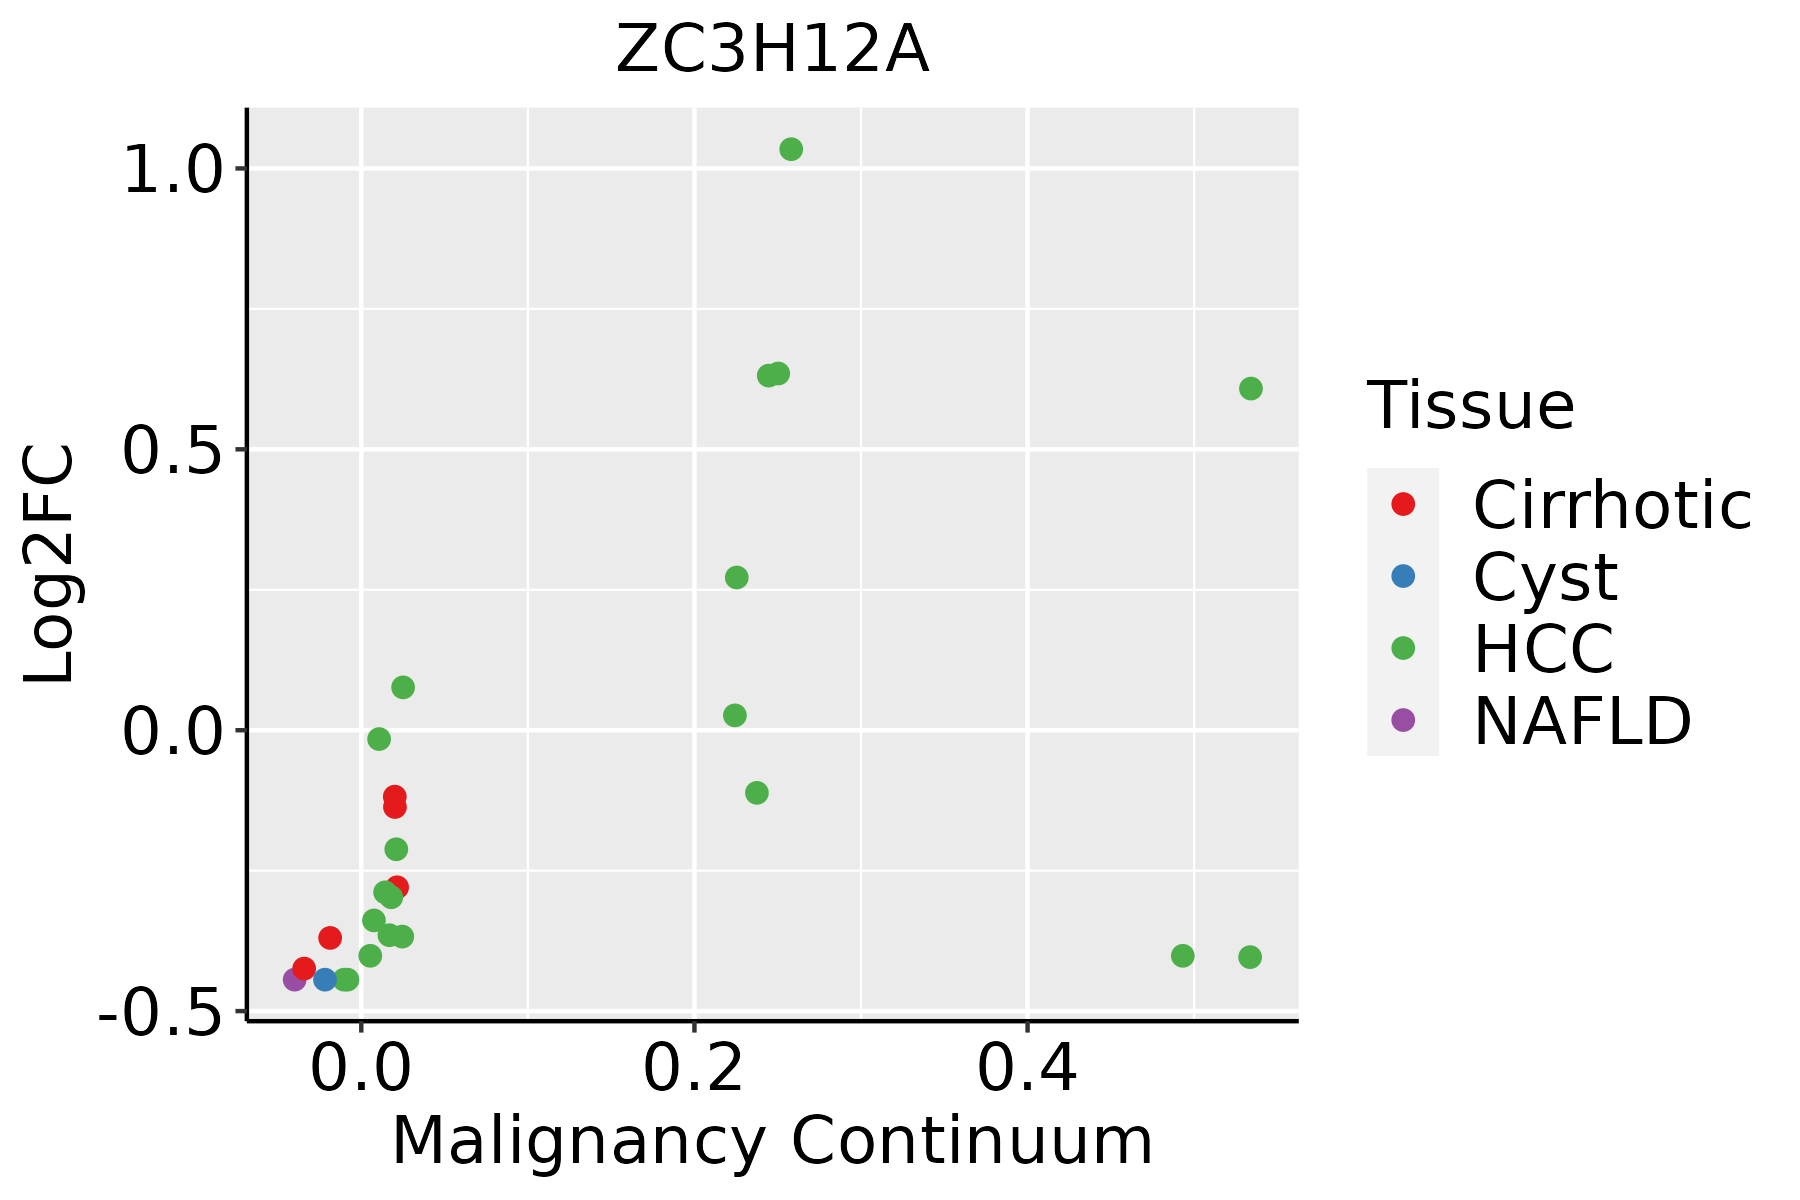 | HCC: Hepatocellular carcinoma |
| NAFLD: Non-alcoholic fatty liver disease | ||
| Lung | 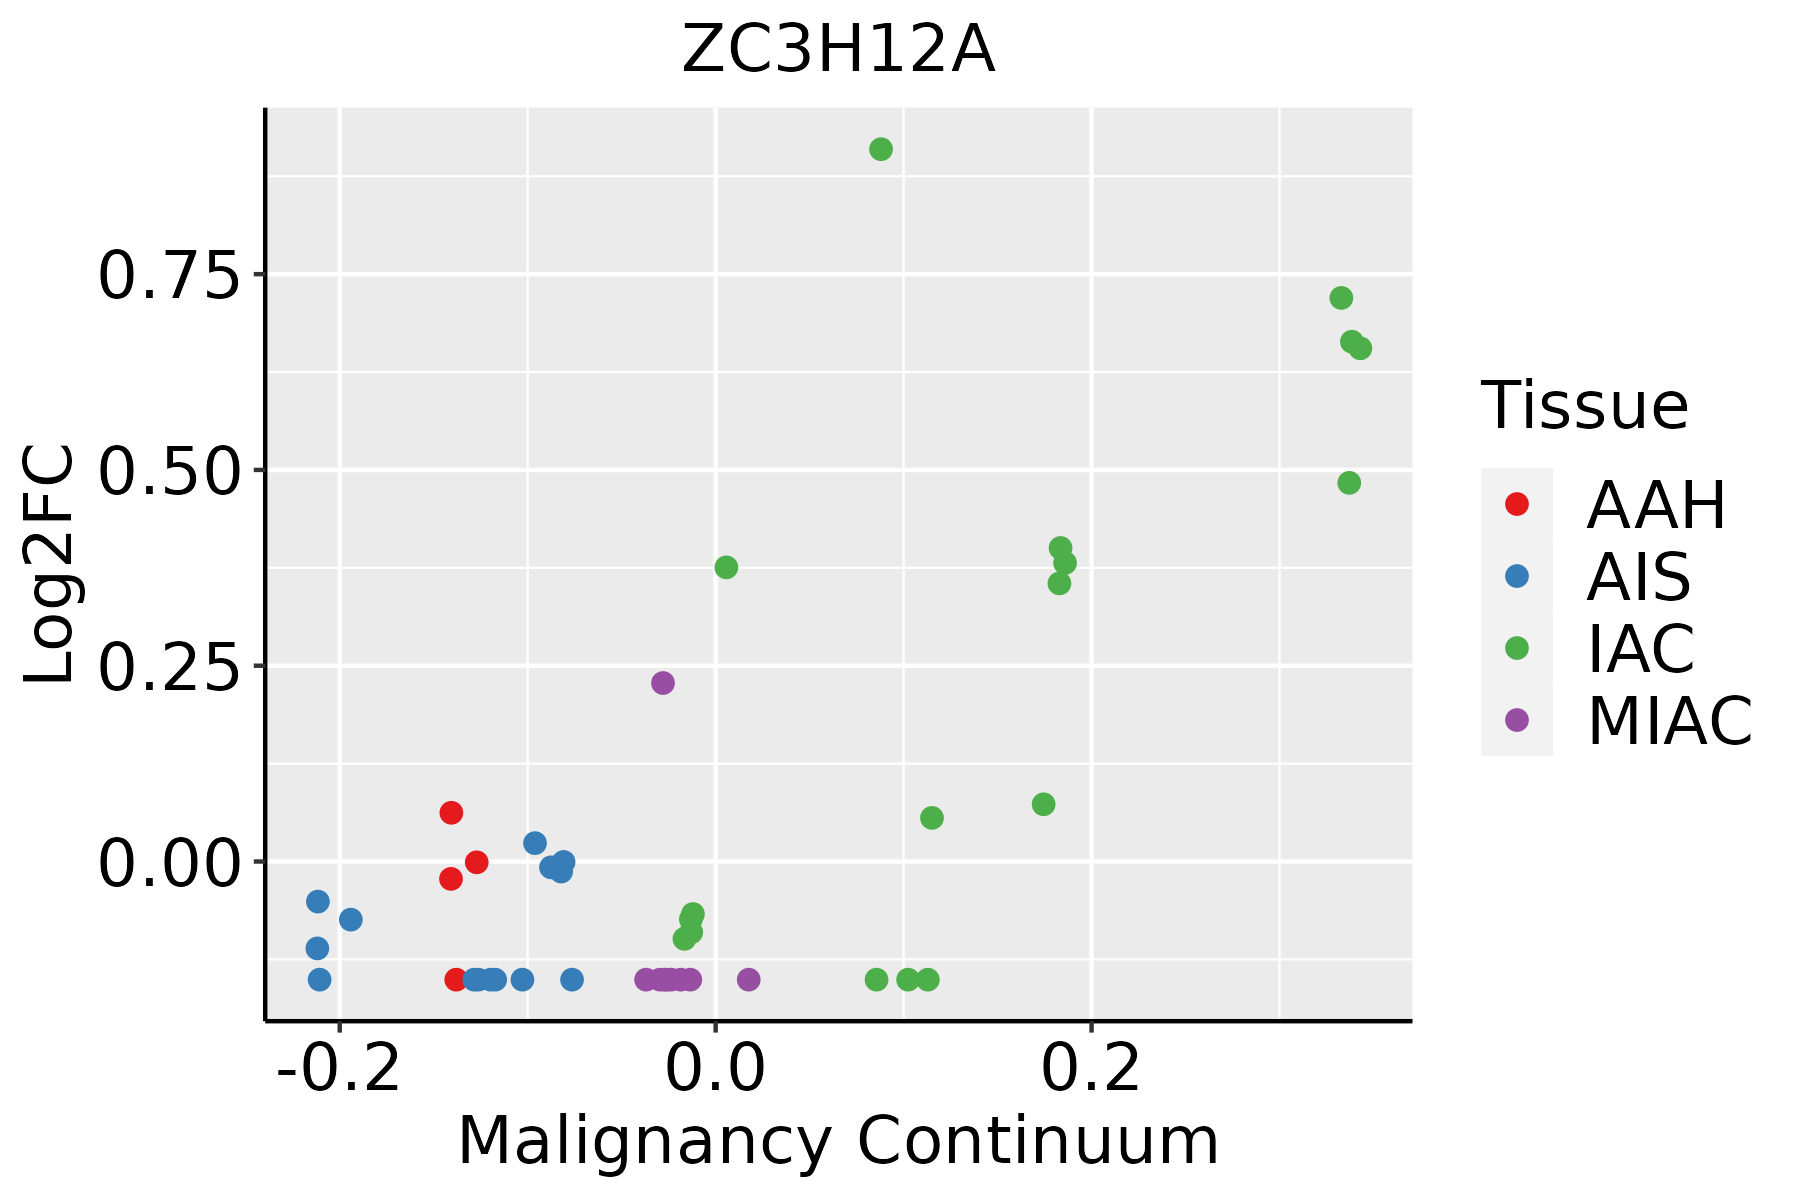 | AAH: Atypical adenomatous hyperplasia |
| AIS: Adenocarcinoma in situ | ||
| IAC: Invasive lung adenocarcinoma | ||
| MIA: Minimally invasive adenocarcinoma | ||
| Oral Cavity | 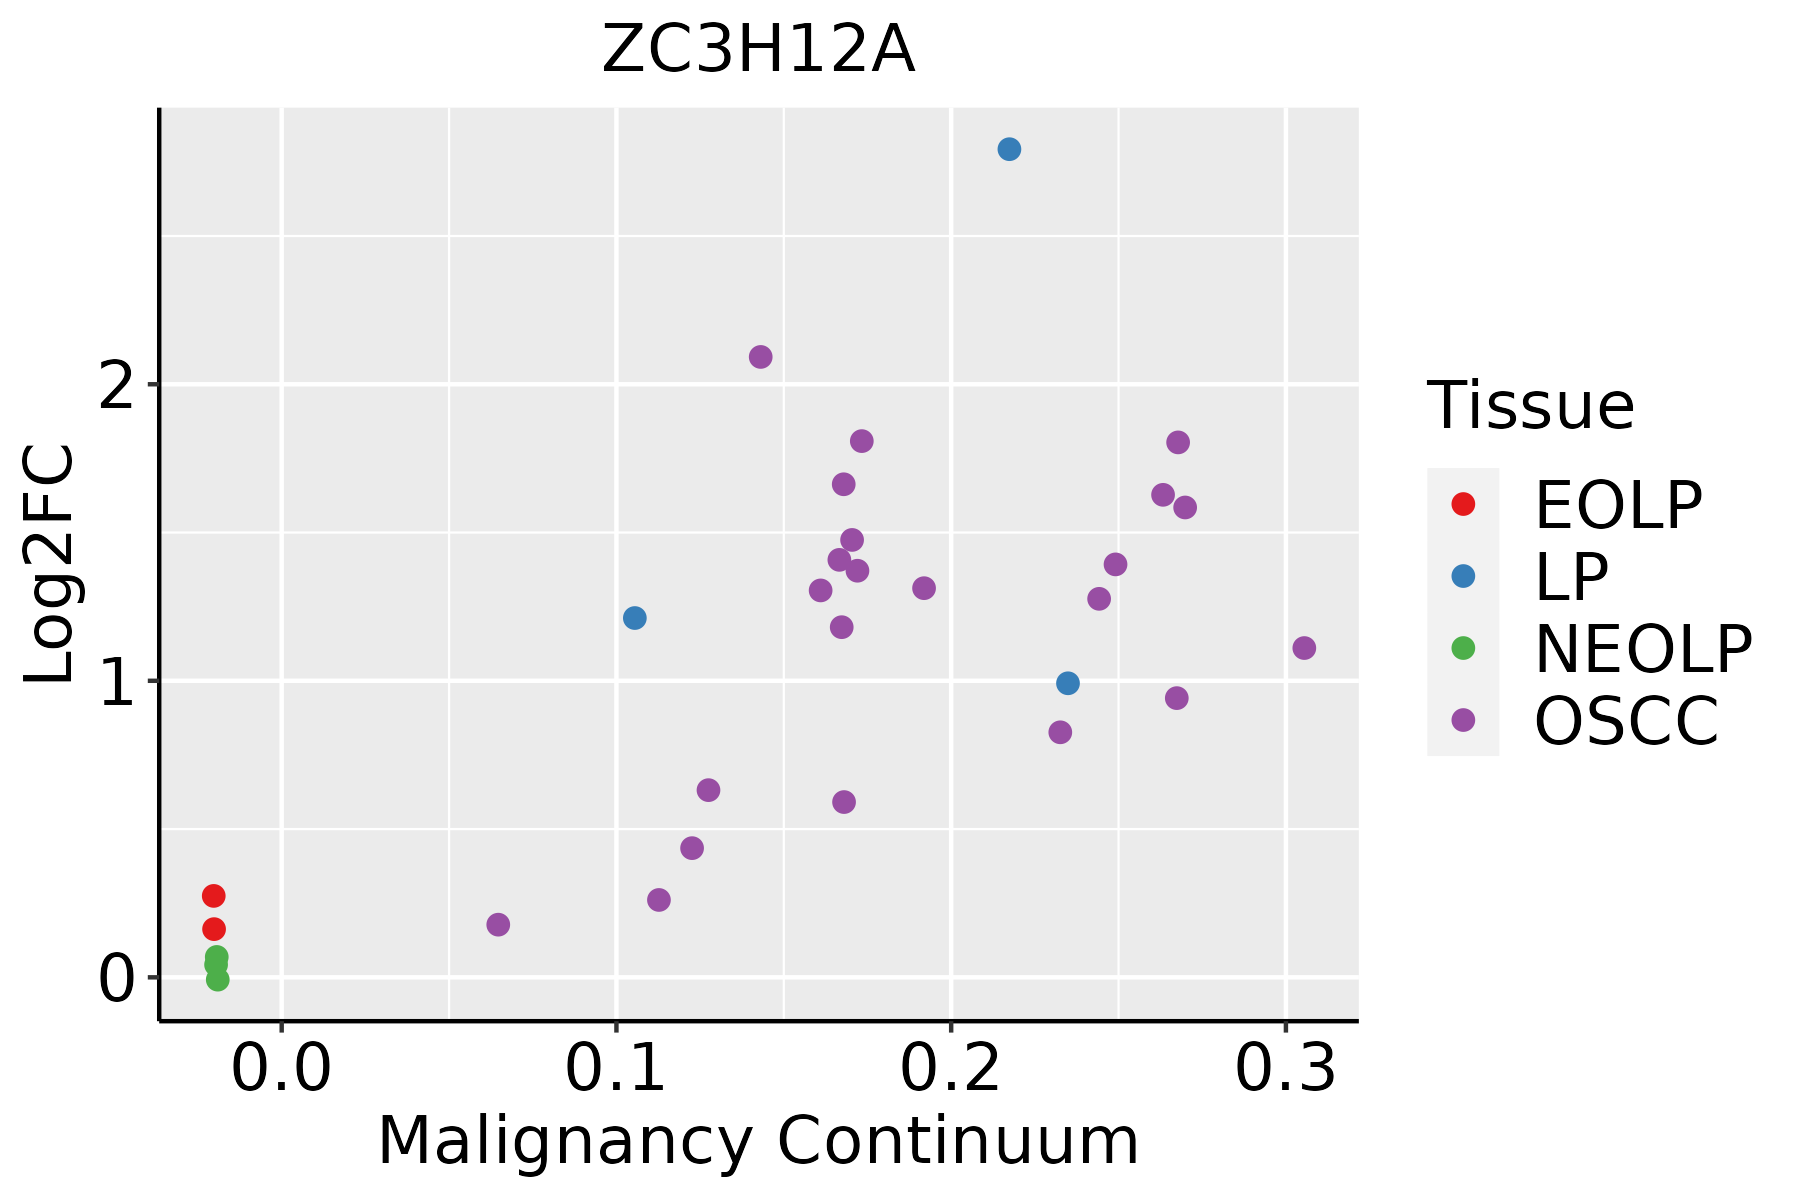 | EOLP: Erosive Oral lichen planus |
| LP: leukoplakia | ||
| NEOLP: Non-erosive oral lichen planus | ||
| OSCC: Oral squamous cell carcinoma | ||
| Prostate |  | BPH: Benign Prostatic Hyperplasia |
| Skin | 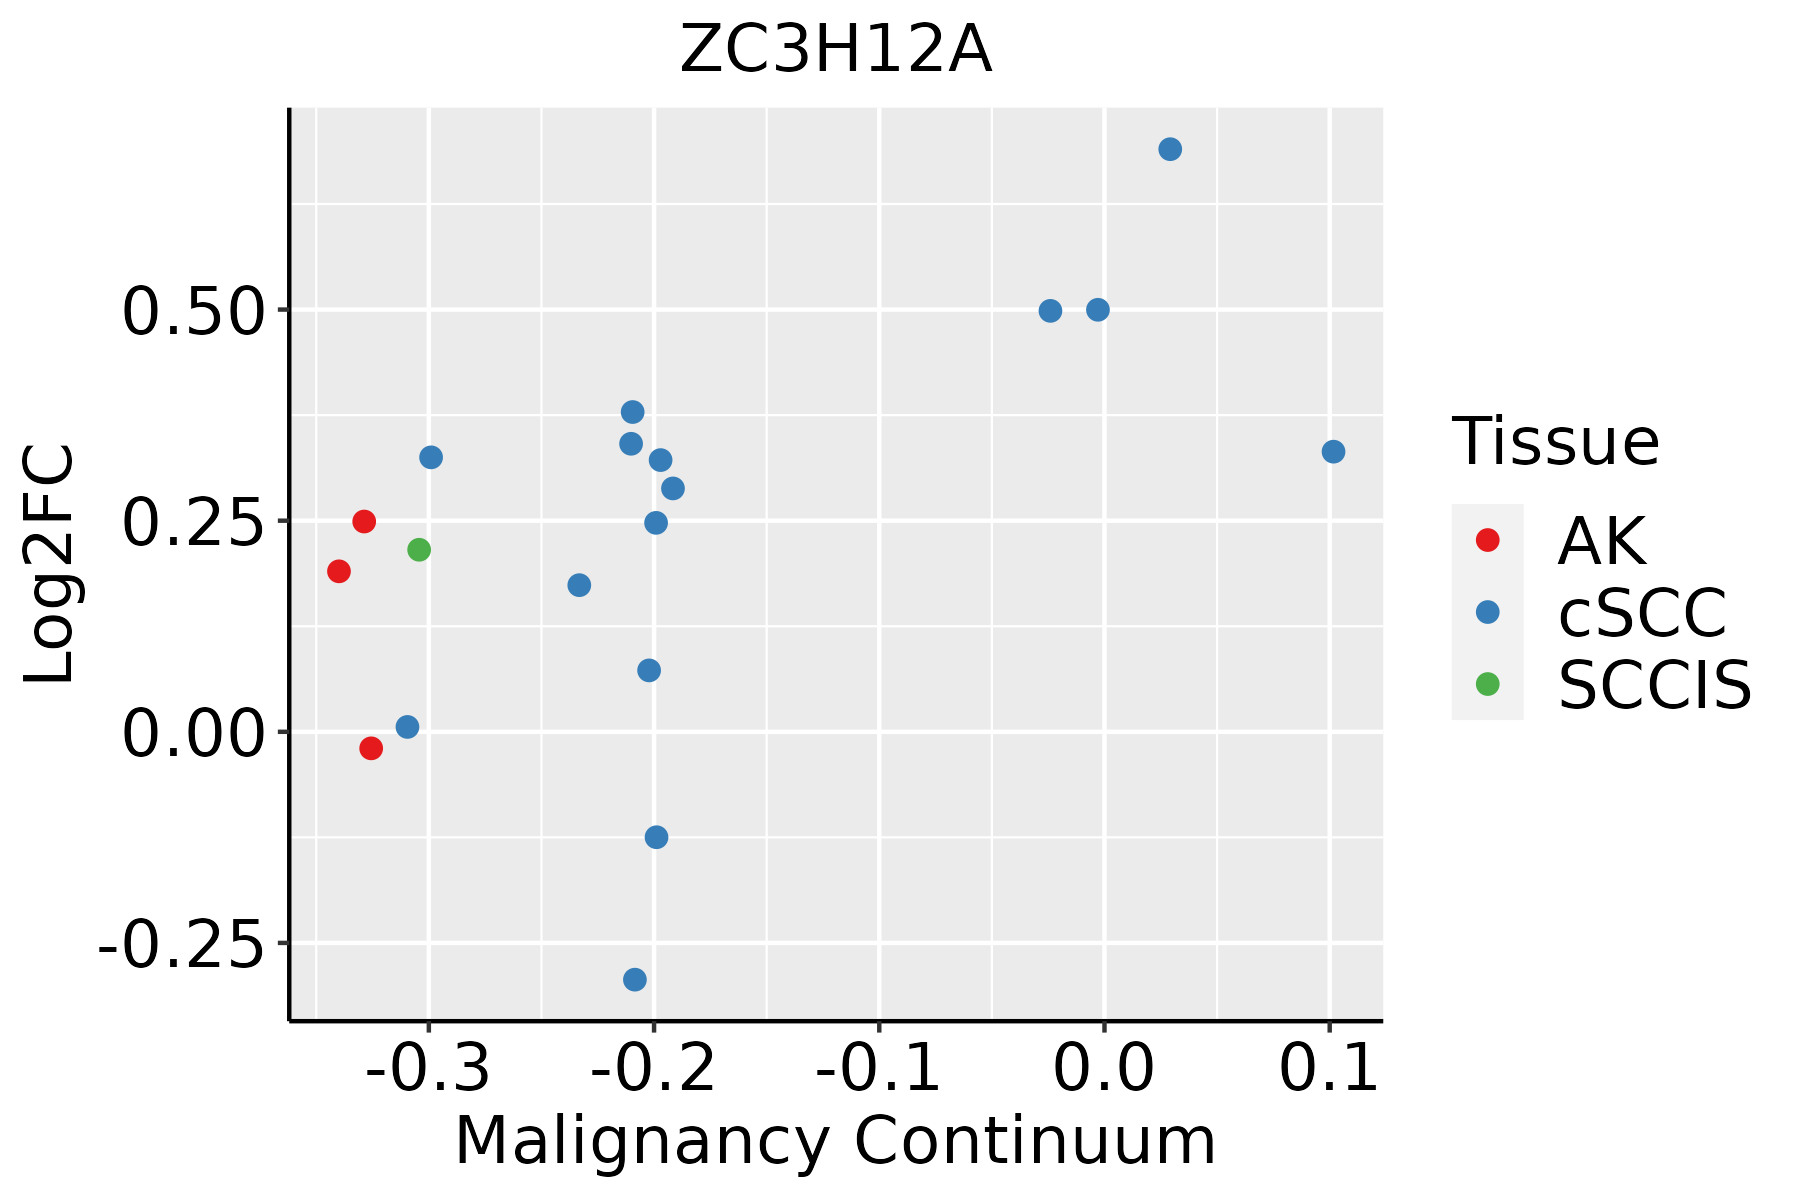 | AK: Actinic keratosis |
| cSCC: Cutaneous squamous cell carcinoma | ||
| SCCIS:squamous cell carcinoma in situ |
| ∗log2FC in expression of this searched gene in stem-like cells from each diseased tissue sample relative to stem-like cells in normal samples in each tissue plotted against the malignancy continuum. Samples are colored based on if they are from different disease stage. |
Top |
Malignant transformation related pathway analysis |
| Find out the enriched GO biological processes and KEGG pathways involved in transition from healthy to precancer to cancer |
| Tissue | Disease Stage | Enriched GO biological Processes |
| Colorectum | AD |  |
| Colorectum | SER |  |
| Colorectum | MSS |  |
| Colorectum | MSI-H |  |
| Colorectum | FAP |  |
| ∗Top 15 enriched GO BP terms are showed in the bar plot of each disease state in each tissue. Each row represents a significant GO biological process which is colored according to the -log10(p.adjust). |
| Page: 1 2 3 4 5 6 7 8 9 |
| GO ID | Tissue | Disease Stage | Description | Gene Ratio | Bg Ratio | pvalue | p.adjust | Count |
| GO:00105069 | Prostate | BPH | regulation of autophagy | 86/3107 | 317/18723 | 1.29e-06 | 2.24e-05 | 86 |
| GO:004312210 | Prostate | BPH | regulation of I-kappaB kinase/NF-kappaB signaling | 71/3107 | 249/18723 | 1.55e-06 | 2.64e-05 | 71 |
| GO:004682410 | Prostate | BPH | positive regulation of nucleocytoplasmic transport | 26/3107 | 62/18723 | 2.06e-06 | 3.40e-05 | 26 |
| GO:004259410 | Prostate | BPH | response to starvation | 59/3107 | 197/18723 | 2.10e-06 | 3.45e-05 | 59 |
| GO:003109810 | Prostate | BPH | stress-activated protein kinase signaling cascade | 70/3107 | 247/18723 | 2.32e-06 | 3.79e-05 | 70 |
| GO:00071628 | Prostate | BPH | negative regulation of cell adhesion | 82/3107 | 303/18723 | 2.51e-06 | 4.04e-05 | 82 |
| GO:005140310 | Prostate | BPH | stress-activated MAPK cascade | 68/3107 | 239/18723 | 2.77e-06 | 4.41e-05 | 68 |
| GO:004670010 | Prostate | BPH | heterocycle catabolic process | 111/3107 | 445/18723 | 3.58e-06 | 5.54e-05 | 111 |
| GO:004427014 | Prostate | BPH | cellular nitrogen compound catabolic process | 112/3107 | 451/18723 | 4.04e-06 | 6.12e-05 | 112 |
| GO:00466857 | Prostate | BPH | response to arsenic-containing substance | 17/3107 | 33/18723 | 4.14e-06 | 6.25e-05 | 17 |
| GO:00171484 | Prostate | BPH | negative regulation of translation | 68/3107 | 245/18723 | 7.01e-06 | 1.01e-04 | 68 |
| GO:001943910 | Prostate | BPH | aromatic compound catabolic process | 113/3107 | 467/18723 | 1.30e-05 | 1.72e-04 | 113 |
| GO:00511708 | Prostate | BPH | import into nucleus | 48/3107 | 159/18723 | 1.42e-05 | 1.85e-04 | 48 |
| GO:002240716 | Prostate | BPH | regulation of cell-cell adhesion | 109/3107 | 448/18723 | 1.43e-05 | 1.85e-04 | 109 |
| GO:00712437 | Prostate | BPH | cellular response to arsenic-containing substance | 12/3107 | 20/18723 | 1.44e-05 | 1.87e-04 | 12 |
| GO:190136110 | Prostate | BPH | organic cyclic compound catabolic process | 118/3107 | 495/18723 | 1.75e-05 | 2.17e-04 | 118 |
| GO:003461216 | Prostate | BPH | response to tumor necrosis factor | 68/3107 | 253/18723 | 2.22e-05 | 2.67e-04 | 68 |
| GO:00435429 | Prostate | BPH | endothelial cell migration | 73/3107 | 279/18723 | 3.03e-05 | 3.46e-04 | 73 |
| GO:00105086 | Prostate | BPH | positive regulation of autophagy | 39/3107 | 124/18723 | 3.17e-05 | 3.60e-04 | 39 |
| GO:00066068 | Prostate | BPH | protein import into nucleus | 46/3107 | 155/18723 | 3.42e-05 | 3.82e-04 | 46 |
| Page: 1 2 3 4 5 6 7 8 9 10 11 12 13 14 15 16 17 18 19 20 21 22 23 24 25 26 27 28 29 30 31 32 33 34 35 36 37 38 39 40 41 42 43 44 45 46 47 48 49 50 51 52 53 54 55 56 57 58 59 60 61 62 63 64 65 66 67 68 69 70 71 72 |
| Pathway ID | Tissue | Disease Stage | Description | Gene Ratio | Bg Ratio | pvalue | p.adjust | qvalue | Count |
| Page: 1 |
Top |
Cell-cell communication analysis |
| Identification of potential cell-cell interactions between two cell types and their ligand-receptor pairs for different disease states |
| Ligand | Receptor | LRpair | Pathway | Tissue | Disease Stage |
| Page: 1 |
Top |
Single-cell gene regulatory network inference analysis |
| Find out the significant the regulons (TFs) and the target genes of each regulon across cell types for different disease states |
| TF | Cell Type | Tissue | Disease Stage | Target Gene | RSS | Regulon Activity |
| ∗The dot plots of a searched regulon are shown for all cell subpopulations in each disease state of each tissue based on the regulon specific score inferred using pySCENIC and by calculating the average expression. |
| Page: 1 |
Top |
Somatic mutation of malignant transformation related genes |
| Annotation of somatic variants for genes involved in malignant transformation |
| Hugo Symbol | Variant Class | Variant Classification | dbSNP RS | HGVSc | HGVSp | HGVSp Short | SWISSPROT | BIOTYPE | SIFT | PolyPhen | Tumor Sample Barcode | Tissue | Histology | Sex | Age | Stage | Therapy Types | Drugs | Outcome |
| ZC3H12A | SNV | Missense_Mutation | novel | c.925N>C | p.Gly309Arg | p.G309R | Q5D1E8 | protein_coding | deleterious(0) | probably_damaging(0.991) | TCGA-A7-A6VY-01 | Breast | breast invasive carcinoma | Female | <65 | I/II | Chemotherapy | cyclophosphamide | CR |
| ZC3H12A | SNV | Missense_Mutation | novel | c.698N>T | p.Ala233Val | p.A233V | Q5D1E8 | protein_coding | deleterious(0) | probably_damaging(0.999) | TCGA-AC-A2FE-01 | Breast | breast invasive carcinoma | Female | <65 | III/IV | Chemotherapy | adriamycin | PD |
| ZC3H12A | SNV | Missense_Mutation | novel | c.754N>A | p.Glu252Lys | p.E252K | Q5D1E8 | protein_coding | deleterious(0.02) | probably_damaging(0.954) | TCGA-AC-A2QI-01 | Breast | breast invasive carcinoma | Female | >=65 | III/IV | Chemotherapy | cytoxan | CR |
| ZC3H12A | SNV | Missense_Mutation | c.1711N>A | p.Ala571Thr | p.A571T | Q5D1E8 | protein_coding | tolerated(0.33) | benign(0.044) | TCGA-AN-A0AK-01 | Breast | breast invasive carcinoma | Female | >=65 | I/II | Unknown | Unknown | SD | |
| ZC3H12A | SNV | Missense_Mutation | c.1792N>G | p.Ser598Gly | p.S598G | Q5D1E8 | protein_coding | deleterious_low_confidence(0.02) | benign(0) | TCGA-AO-A128-01 | Breast | breast invasive carcinoma | Female | <65 | I/II | Chemotherapy | doxorubicin | SD | |
| ZC3H12A | SNV | Missense_Mutation | c.1684N>A | p.Gly562Ser | p.G562S | Q5D1E8 | protein_coding | deleterious(0.04) | benign(0.219) | TCGA-BH-A0E0-01 | Breast | breast invasive carcinoma | Female | <65 | III/IV | Chemotherapy | docetaxel | SD | |
| ZC3H12A | SNV | Missense_Mutation | c.1457N>G | p.Ala486Gly | p.A486G | Q5D1E8 | protein_coding | tolerated(0.57) | benign(0.001) | TCGA-E9-A245-01 | Breast | breast invasive carcinoma | Female | <65 | I/II | Hormone Therapy | tamoxiphen | SD | |
| ZC3H12A | SNV | Missense_Mutation | novel | c.574N>G | p.Pro192Ala | p.P192A | Q5D1E8 | protein_coding | tolerated(0.25) | probably_damaging(0.99) | TCGA-S3-AA10-01 | Breast | breast invasive carcinoma | Female | >=65 | I/II | Chemotherapy | cytoxan | CR |
| ZC3H12A | SNV | Missense_Mutation | novel | c.725C>T | p.Ser242Phe | p.S242F | Q5D1E8 | protein_coding | deleterious(0) | probably_damaging(1) | TCGA-XX-A89A-01 | Breast | breast invasive carcinoma | Female | >=65 | I/II | Unknown | Unknown | SD |
| ZC3H12A | insertion | Nonsense_Mutation | novel | c.971_972insTTGCTAAGAGTCCCCTAGCATCTTCCTGATGGTCTTTCTGCCTT | p.Glu324AspfsTer3 | p.E324Dfs*3 | Q5D1E8 | protein_coding | TCGA-AR-A0TY-01 | Breast | breast invasive carcinoma | Female | <65 | I/II | Unspecific | Paclitaxel | PD |
| Page: 1 2 3 4 5 6 7 8 |
Top |
Related drugs of malignant transformation related genes |
| Identification of chemicals and drugs interact with genes involved in malignant transfromation |
| (DGIdb 4.0) |
| Entrez ID | Symbol | Category | Interaction Types | Drug Claim Name | Drug Name | PMIDs |
| Page: 1 |

Copyright 2023-Present -The University of Texas Health Science Center at Houston |