| Tissue | Expression Dynamics | Abbreviation |
| Cervix | 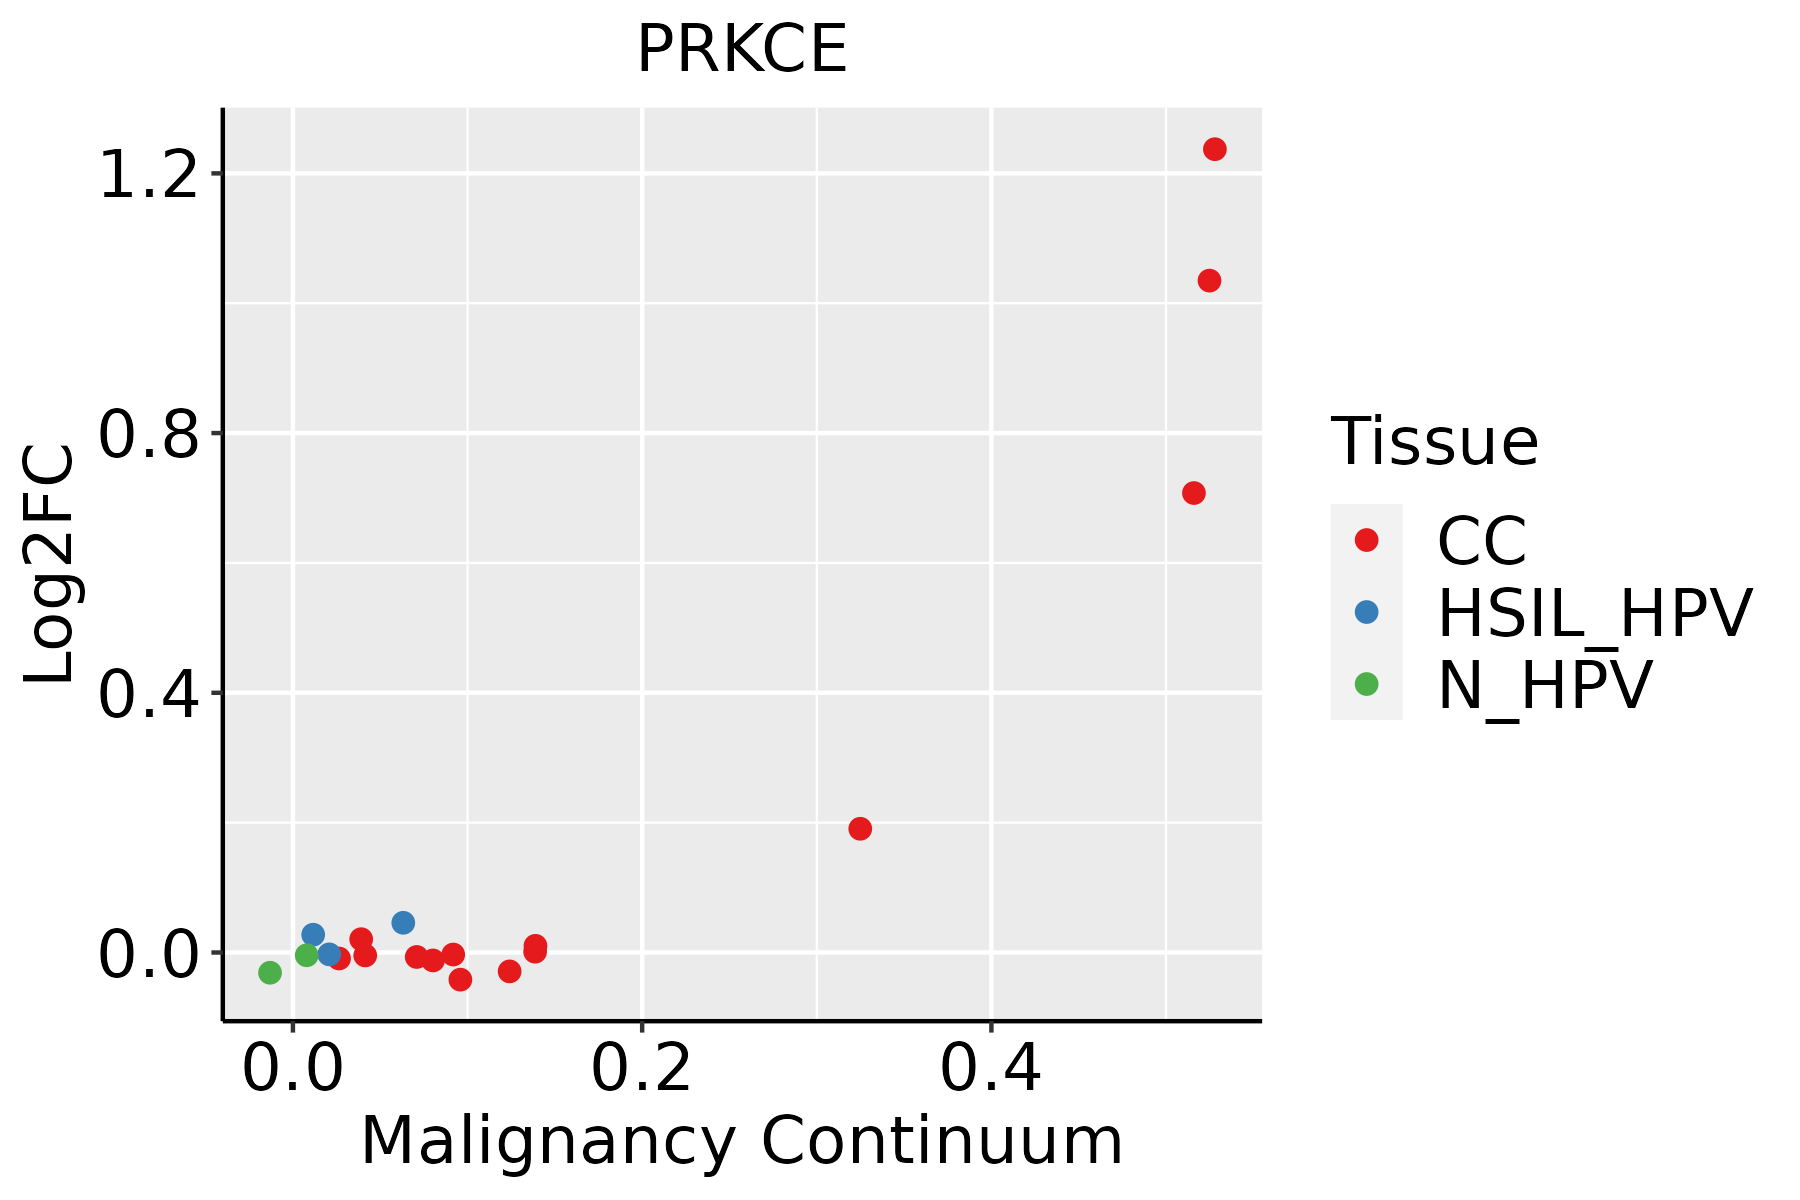 | CC: Cervix cancer |
| HSIL_HPV: HPV-infected high-grade squamous intraepithelial lesions |
| N_HPV: HPV-infected normal cervix |
| Colorectum (GSE201348) |  | FAP: Familial adenomatous polyposis |
| CRC: Colorectal cancer |
| Colorectum (HTA11) |  | AD: Adenomas |
| SER: Sessile serrated lesions |
| MSI-H: Microsatellite-high colorectal cancer |
| MSS: Microsatellite stable colorectal cancer |
| Endometrium | 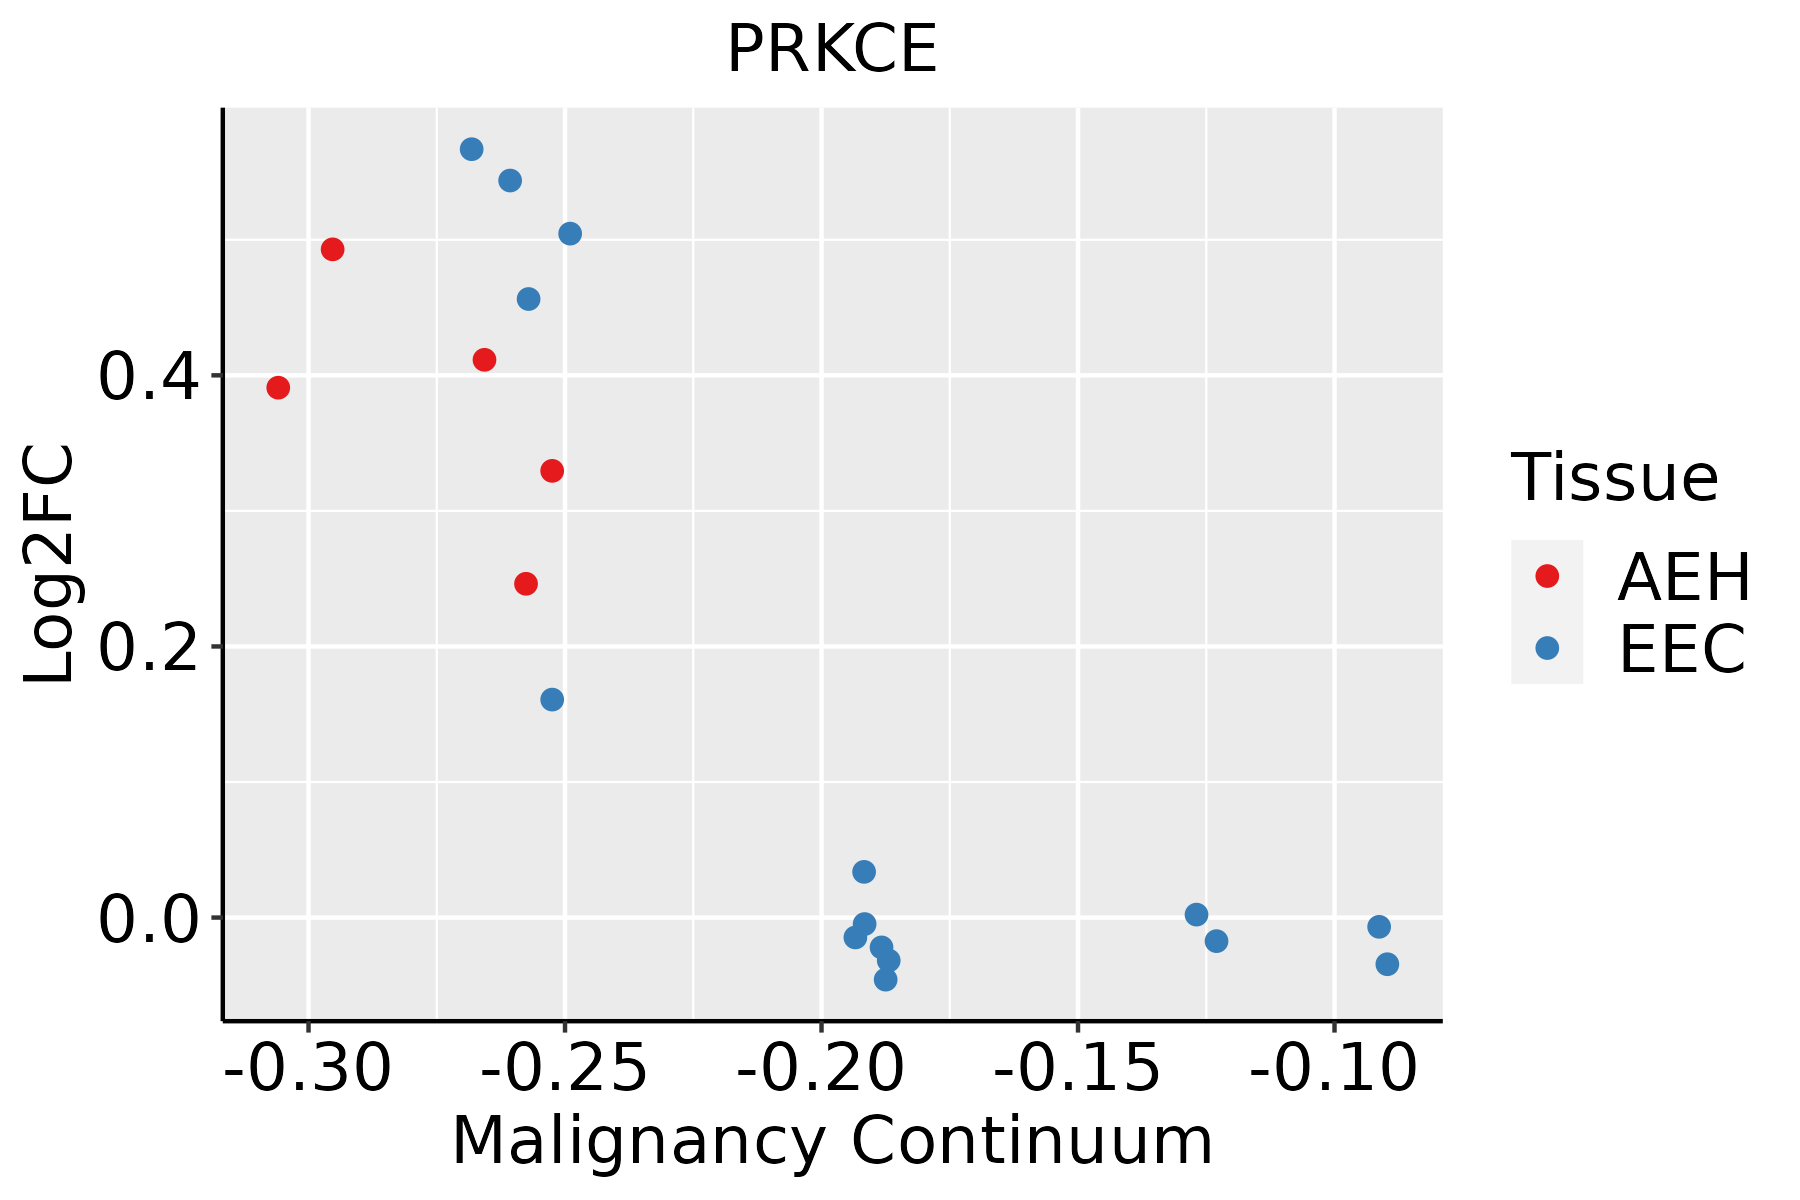 | AEH: Atypical endometrial hyperplasia |
| EEC: Endometrioid Cancer |
| Lung | 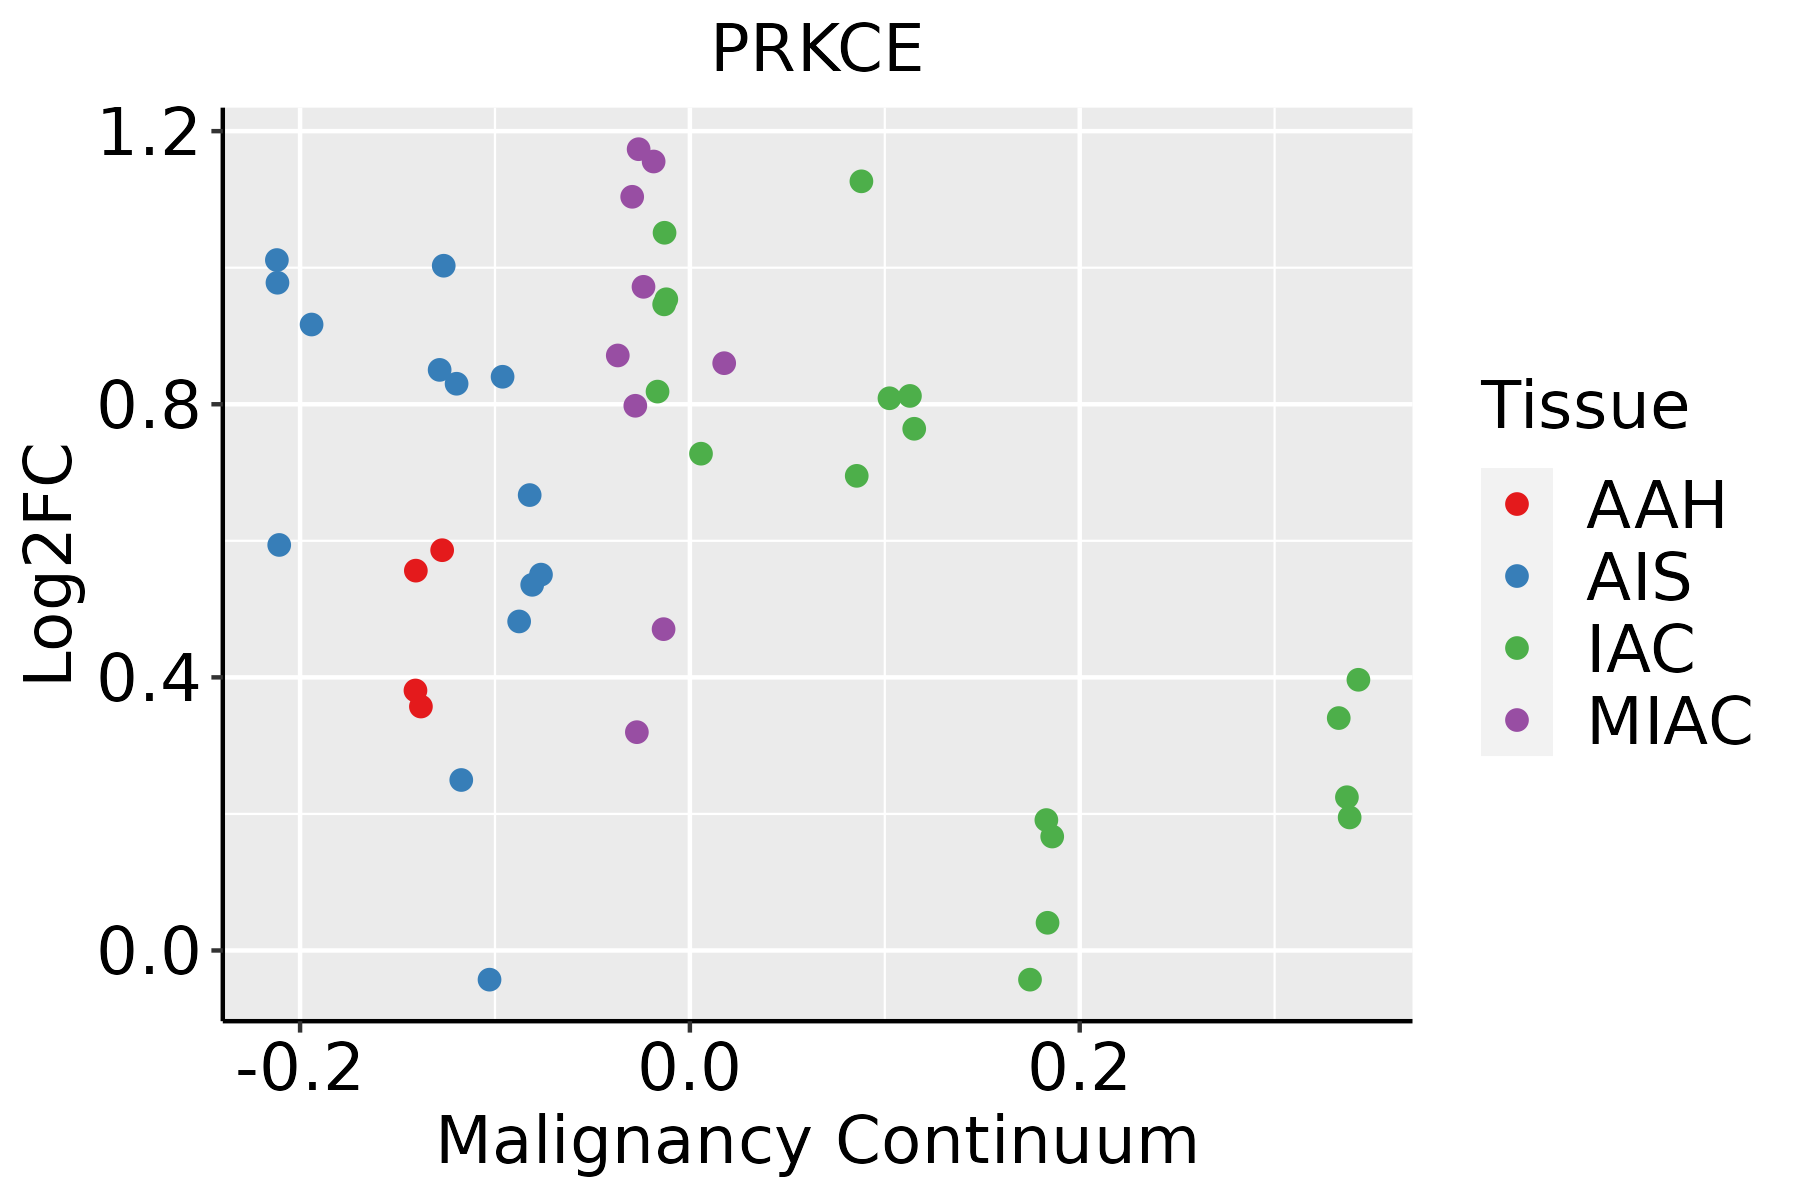 | AAH: Atypical adenomatous hyperplasia |
| AIS: Adenocarcinoma in situ |
| IAC: Invasive lung adenocarcinoma |
| MIA: Minimally invasive adenocarcinoma |
| Oral Cavity |  | EOLP: Erosive Oral lichen planus |
| LP: leukoplakia |
| NEOLP: Non-erosive oral lichen planus |
| OSCC: Oral squamous cell carcinoma |
| Prostate | 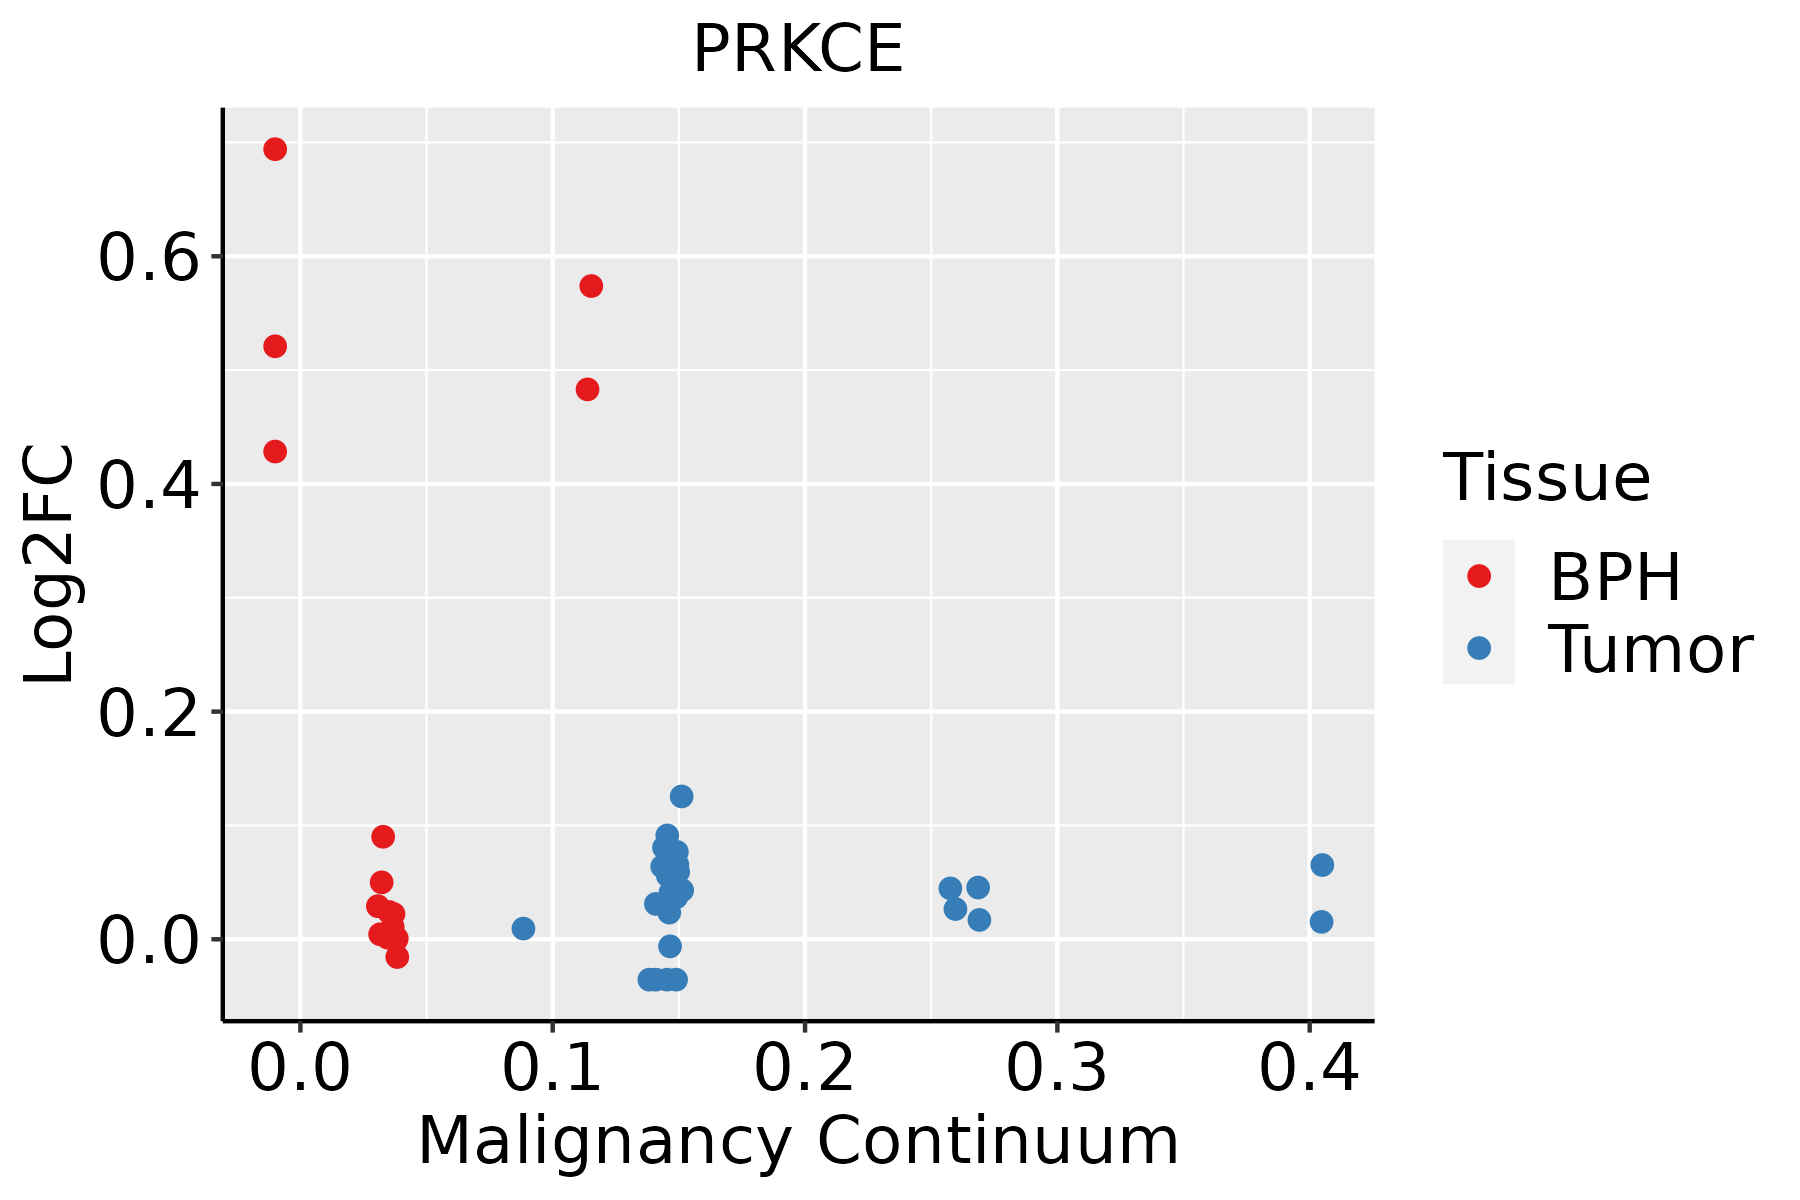 | BPH: Benign Prostatic Hyperplasia |
| Thyroid |  | ATC: Anaplastic thyroid cancer |
| HT: Hashimoto's thyroiditis |
| PTC: Papillary thyroid cancer |
| GO ID | Tissue | Disease Stage | Description | Gene Ratio | Bg Ratio | pvalue | p.adjust | Count |
| GO:003139713 | Lung | AIS | negative regulation of protein ubiquitination | 22/1849 | 83/18723 | 1.22e-05 | 4.71e-04 | 22 |
| GO:011005313 | Lung | AIS | regulation of actin filament organization | 50/1849 | 278/18723 | 2.13e-05 | 7.27e-04 | 50 |
| GO:004325413 | Lung | AIS | regulation of protein-containing complex assembly | 68/1849 | 428/18723 | 5.51e-05 | 1.56e-03 | 68 |
| GO:005123512 | Lung | AIS | maintenance of location | 55/1849 | 327/18723 | 5.93e-05 | 1.65e-03 | 55 |
| GO:005125813 | Lung | AIS | protein polymerization | 51/1849 | 297/18723 | 6.29e-05 | 1.70e-03 | 51 |
| GO:000974313 | Lung | AIS | response to carbohydrate | 45/1849 | 253/18723 | 7.09e-05 | 1.88e-03 | 45 |
| GO:190230512 | Lung | AIS | regulation of sodium ion transmembrane transport | 18/1849 | 68/18723 | 7.53e-05 | 1.94e-03 | 18 |
| GO:000166713 | Lung | AIS | ameboidal-type cell migration | 73/1849 | 475/18723 | 8.91e-05 | 2.20e-03 | 73 |
| GO:200064912 | Lung | AIS | regulation of sodium ion transmembrane transporter activity | 16/1849 | 58/18723 | 1.09e-04 | 2.57e-03 | 16 |
| GO:005165113 | Lung | AIS | maintenance of location in cell | 39/1849 | 214/18723 | 1.23e-04 | 2.81e-03 | 39 |
| GO:003133413 | Lung | AIS | positive regulation of protein-containing complex assembly | 42/1849 | 237/18723 | 1.32e-04 | 2.97e-03 | 42 |
| GO:003629313 | Lung | AIS | response to decreased oxygen levels | 53/1849 | 322/18723 | 1.42e-04 | 3.09e-03 | 53 |
| GO:000202811 | Lung | AIS | regulation of sodium ion transport | 21/1849 | 90/18723 | 1.44e-04 | 3.13e-03 | 21 |
| GO:003227113 | Lung | AIS | regulation of protein polymerization | 41/1849 | 233/18723 | 1.85e-04 | 3.83e-03 | 41 |
| GO:00434101 | Lung | AIS | positive regulation of MAPK cascade | 72/1849 | 480/18723 | 2.11e-04 | 4.32e-03 | 72 |
| GO:003629412 | Lung | AIS | cellular response to decreased oxygen levels | 31/1849 | 161/18723 | 2.15e-04 | 4.36e-03 | 31 |
| GO:007145312 | Lung | AIS | cellular response to oxygen levels | 33/1849 | 177/18723 | 2.56e-04 | 4.96e-03 | 33 |
| GO:000166613 | Lung | AIS | response to hypoxia | 50/1849 | 307/18723 | 2.79e-04 | 5.26e-03 | 50 |
| GO:007145612 | Lung | AIS | cellular response to hypoxia | 29/1849 | 151/18723 | 3.54e-04 | 6.32e-03 | 29 |
| GO:003428413 | Lung | AIS | response to monosaccharide | 39/1849 | 225/18723 | 3.59e-04 | 6.39e-03 | 39 |
| Pathway ID | Tissue | Disease Stage | Description | Gene Ratio | Bg Ratio | pvalue | p.adjust | qvalue | Count |
| hsa0513120 | Cervix | CC | Shigellosis | 69/1267 | 247/8465 | 7.64e-08 | 1.03e-06 | 6.10e-07 | 69 |
| hsa0453020 | Cervix | CC | Tight junction | 49/1267 | 169/8465 | 1.87e-06 | 1.78e-05 | 1.05e-05 | 49 |
| hsa0466612 | Cervix | CC | Fc gamma R-mediated phagocytosis | 31/1267 | 97/8465 | 1.78e-05 | 1.42e-04 | 8.40e-05 | 31 |
| hsa0407110 | Cervix | CC | Sphingolipid signaling pathway | 35/1267 | 121/8465 | 5.70e-05 | 3.93e-04 | 2.32e-04 | 35 |
| hsa049336 | Cervix | CC | AGE-RAGE signaling pathway in diabetic complications | 25/1267 | 100/8465 | 5.64e-03 | 1.88e-02 | 1.11e-02 | 25 |
| hsa05131110 | Cervix | CC | Shigellosis | 69/1267 | 247/8465 | 7.64e-08 | 1.03e-06 | 6.10e-07 | 69 |
| hsa04530110 | Cervix | CC | Tight junction | 49/1267 | 169/8465 | 1.87e-06 | 1.78e-05 | 1.05e-05 | 49 |
| hsa0466613 | Cervix | CC | Fc gamma R-mediated phagocytosis | 31/1267 | 97/8465 | 1.78e-05 | 1.42e-04 | 8.40e-05 | 31 |
| hsa0407113 | Cervix | CC | Sphingolipid signaling pathway | 35/1267 | 121/8465 | 5.70e-05 | 3.93e-04 | 2.32e-04 | 35 |
| hsa0493313 | Cervix | CC | AGE-RAGE signaling pathway in diabetic complications | 25/1267 | 100/8465 | 5.64e-03 | 1.88e-02 | 1.11e-02 | 25 |
| hsa05131 | Colorectum | AD | Shigellosis | 109/2092 | 247/8465 | 1.09e-11 | 2.44e-10 | 1.55e-10 | 109 |
| hsa04530 | Colorectum | AD | Tight junction | 76/2092 | 169/8465 | 5.49e-09 | 9.69e-08 | 6.18e-08 | 76 |
| hsa04666 | Colorectum | AD | Fc gamma R-mediated phagocytosis | 46/2092 | 97/8465 | 9.10e-07 | 1.22e-05 | 7.77e-06 | 46 |
| hsa04071 | Colorectum | AD | Sphingolipid signaling pathway | 43/2092 | 121/8465 | 4.83e-03 | 2.28e-02 | 1.45e-02 | 43 |
| hsa051311 | Colorectum | AD | Shigellosis | 109/2092 | 247/8465 | 1.09e-11 | 2.44e-10 | 1.55e-10 | 109 |
| hsa045301 | Colorectum | AD | Tight junction | 76/2092 | 169/8465 | 5.49e-09 | 9.69e-08 | 6.18e-08 | 76 |
| hsa046661 | Colorectum | AD | Fc gamma R-mediated phagocytosis | 46/2092 | 97/8465 | 9.10e-07 | 1.22e-05 | 7.77e-06 | 46 |
| hsa040711 | Colorectum | AD | Sphingolipid signaling pathway | 43/2092 | 121/8465 | 4.83e-03 | 2.28e-02 | 1.45e-02 | 43 |
| hsa051314 | Colorectum | MSS | Shigellosis | 94/1875 | 247/8465 | 6.82e-09 | 1.34e-07 | 8.23e-08 | 94 |
| hsa046664 | Colorectum | MSS | Fc gamma R-mediated phagocytosis | 45/1875 | 97/8465 | 9.30e-08 | 1.56e-06 | 9.55e-07 | 45 |
| Hugo Symbol | Variant Class | Variant Classification | dbSNP RS | HGVSc | HGVSp | HGVSp Short | SWISSPROT | BIOTYPE | SIFT | PolyPhen | Tumor Sample Barcode | Tissue | Histology | Sex | Age | Stage | Therapy Types | Drugs | Outcome |
| PRKCE | SNV | Missense_Mutation | novel | c.256G>A | p.Asp86Asn | p.D86N | Q02156 | protein_coding | tolerated(0.07) | benign(0.36) | TCGA-3C-AALI-01 | Breast | breast invasive carcinoma | Female | <65 | I/II | Unspecific | Poly E | Complete Response |
| PRKCE | SNV | Missense_Mutation | novel | c.404C>T | p.Ser135Leu | p.S135L | Q02156 | protein_coding | tolerated(0.28) | benign(0.006) | TCGA-A7-A13F-01 | Breast | breast invasive carcinoma | Female | <65 | III/IV | Chemotherapy | doxorubicin | SD |
| PRKCE | SNV | Missense_Mutation | novel | c.1219N>A | p.Glu407Lys | p.E407K | Q02156 | protein_coding | deleterious(0) | benign(0.017) | TCGA-AC-A6IW-01 | Breast | breast invasive carcinoma | Female | >=65 | I/II | Unknown | Unknown | SD |
| PRKCE | SNV | Missense_Mutation | | c.1441N>A | p.Arg481Ser | p.R481S | Q02156 | protein_coding | deleterious(0) | probably_damaging(1) | TCGA-AN-A0AK-01 | Breast | breast invasive carcinoma | Female | >=65 | I/II | Unknown | Unknown | SD |
| PRKCE | SNV | Missense_Mutation | novel | c.634N>C | p.Cys212Arg | p.C212R | Q02156 | protein_coding | deleterious(0) | probably_damaging(1) | TCGA-AN-A0FX-01 | Breast | breast invasive carcinoma | Female | <65 | I/II | Unknown | Unknown | SD |
| PRKCE | SNV | Missense_Mutation | | c.202N>A | p.Glu68Lys | p.E68K | Q02156 | protein_coding | tolerated(0.19) | benign(0.022) | TCGA-C8-A137-01 | Breast | breast invasive carcinoma | Female | <65 | I/II | Unknown | Unknown | PD |
| PRKCE | SNV | Missense_Mutation | novel | c.79N>T | p.His27Tyr | p.H27Y | Q02156 | protein_coding | deleterious(0.03) | possibly_damaging(0.898) | TCGA-E2-A2P6-01 | Breast | breast invasive carcinoma | Female | >=65 | I/II | Hormone Therapy | anastrozole | SD |
| PRKCE | insertion | Nonsense_Mutation | novel | c.2059_2060insACCTCGTAGGGCATTAGGATGAAATGAGTTGATA | p.Pro687HisfsTer6 | p.P687Hfs*6 | Q02156 | protein_coding | | | TCGA-A8-A09C-01 | Breast | breast invasive carcinoma | Female | >=65 | I/II | Unknown | Unknown | SD |
| PRKCE | insertion | Frame_Shift_Ins | novel | c.460_461insTAACCAACAGACATTCACTTCTCACAGTTTT | p.Arg154IlefsTer131 | p.R154Ifs*131 | Q02156 | protein_coding | | | TCGA-AN-A03X-01 | Breast | breast invasive carcinoma | Female | >=65 | I/II | Unknown | Unknown | SD |
| PRKCE | insertion | In_Frame_Ins | novel | c.2056_2057insTCTTCATTGGTTCTGCCTCTACTTACACTTTGGAGCTGC | p.Lys686delinsIlePheIleGlySerAlaSerThrTyrThrLeuGluLeuGln | p.K686delinsIFIGSASTYTLELQ | Q02156 | protein_coding | | | TCGA-BH-A0HF-01 | Breast | breast invasive carcinoma | Female | >=65 | I/II | Hormone Therapy | arimidex | SD |
| Entrez ID | Symbol | Category | Interaction Types | Drug Claim Name | Drug Name | PMIDs |
| 5581 | PRKCE | SERINE THREONINE KINASE, DRUGGABLE GENOME, KINASE, ION CHANNEL, TRANSCRIPTION FACTOR, ENZYME | | PHORBOL MYRISTATE ACETATE | PHORBOL MYRISTATE ACETATE | 22579485 |
| 5581 | PRKCE | SERINE THREONINE KINASE, DRUGGABLE GENOME, KINASE, ION CHANNEL, TRANSCRIPTION FACTOR, ENZYME | | INGENOL MEBUTATE | | |
| 5581 | PRKCE | SERINE THREONINE KINASE, DRUGGABLE GENOME, KINASE, ION CHANNEL, TRANSCRIPTION FACTOR, ENZYME | | [3H]-PHORBOL 12,13-DIBUTYRATE | CHEMBL27768 | 24794745 |
| 5581 | PRKCE | SERINE THREONINE KINASE, DRUGGABLE GENOME, KINASE, ION CHANNEL, TRANSCRIPTION FACTOR, ENZYME | | KAI-1455 | | |
| 5581 | PRKCE | SERINE THREONINE KINASE, DRUGGABLE GENOME, KINASE, ION CHANNEL, TRANSCRIPTION FACTOR, ENZYME | inhibitor | CHEMBL608533 | MIDOSTAURIN | |
| 5581 | PRKCE | SERINE THREONINE KINASE, DRUGGABLE GENOME, KINASE, ION CHANNEL, TRANSCRIPTION FACTOR, ENZYME | inhibitor | 249565629 | SOTRASTAURIN | |
| 5581 | PRKCE | SERINE THREONINE KINASE, DRUGGABLE GENOME, KINASE, ION CHANNEL, TRANSCRIPTION FACTOR, ENZYME | inhibitor | 178102576 | CHELERYTHRINE | |
| 5581 | PRKCE | SERINE THREONINE KINASE, DRUGGABLE GENOME, KINASE, ION CHANNEL, TRANSCRIPTION FACTOR, ENZYME | inhibitor | CHEMBL3545332 | CEP-2563 | |
| 5581 | PRKCE | SERINE THREONINE KINASE, DRUGGABLE GENOME, KINASE, ION CHANNEL, TRANSCRIPTION FACTOR, ENZYME | | BRYOSTATIN | BRYOSTATIN | |
| 5581 | PRKCE | SERINE THREONINE KINASE, DRUGGABLE GENOME, KINASE, ION CHANNEL, TRANSCRIPTION FACTOR, ENZYME | | radiotherapy | | 25054431 |


