
|
|||||
|
 | |
| |
| |
| |
| |
| |
|
Gene: LDHA |
Gene summary for LDHA |
| Gene information | Species | Human | Gene symbol | LDHA | Gene ID | 3939 |
| Gene name | lactate dehydrogenase A | |
| Gene Alias | GSD11 | |
| Cytomap | 11p15.1 | |
| Gene Type | protein-coding | GO ID | GO:0000302 | UniProtAcc | P00338 |
Top |
Malignant transformation analysis |
| Identification of the aberrant gene expression in precancerous and cancerous lesions by comparing the gene expression of stem-like cells in diseased tissues with normal stem cells |
| Entrez ID | Symbol | Replicates | Species | Organ | Tissue | Adj P-value | Log2FC | Malignancy |
| 3939 | LDHA | GSM4909282 | Human | Breast | IDC | 6.57e-06 | 3.23e-01 | -0.0288 |
| 3939 | LDHA | GSM4909285 | Human | Breast | IDC | 1.61e-06 | 1.51e-01 | 0.21 |
| 3939 | LDHA | GSM4909286 | Human | Breast | IDC | 1.15e-27 | -5.78e-01 | 0.1081 |
| 3939 | LDHA | GSM4909291 | Human | Breast | IDC | 8.33e-11 | -6.29e-01 | 0.1753 |
| 3939 | LDHA | GSM4909293 | Human | Breast | IDC | 5.38e-12 | -2.86e-01 | 0.1581 |
| 3939 | LDHA | GSM4909296 | Human | Breast | IDC | 8.67e-21 | -6.80e-01 | 0.1524 |
| 3939 | LDHA | GSM4909297 | Human | Breast | IDC | 4.00e-06 | -3.28e-01 | 0.1517 |
| 3939 | LDHA | GSM4909298 | Human | Breast | IDC | 2.51e-10 | -2.35e-01 | 0.1551 |
| 3939 | LDHA | GSM4909299 | Human | Breast | IDC | 6.53e-08 | -3.05e-01 | 0.035 |
| 3939 | LDHA | GSM4909301 | Human | Breast | IDC | 3.05e-25 | -7.47e-01 | 0.1577 |
| 3939 | LDHA | GSM4909303 | Human | Breast | IDC | 6.64e-03 | -5.06e-01 | 0.0438 |
| 3939 | LDHA | GSM4909304 | Human | Breast | IDC | 1.06e-03 | 2.25e-01 | 0.1636 |
| 3939 | LDHA | GSM4909305 | Human | Breast | IDC | 1.70e-04 | -5.88e-02 | 0.0436 |
| 3939 | LDHA | GSM4909308 | Human | Breast | IDC | 1.83e-07 | 1.45e-01 | 0.158 |
| 3939 | LDHA | GSM4909311 | Human | Breast | IDC | 1.35e-27 | -4.26e-01 | 0.1534 |
| 3939 | LDHA | GSM4909315 | Human | Breast | IDC | 8.98e-55 | 7.44e-01 | 0.21 |
| 3939 | LDHA | GSM4909316 | Human | Breast | IDC | 7.79e-09 | 4.77e-01 | 0.21 |
| 3939 | LDHA | GSM4909319 | Human | Breast | IDC | 9.83e-37 | -6.32e-01 | 0.1563 |
| 3939 | LDHA | GSM4909320 | Human | Breast | IDC | 1.22e-15 | -9.16e-01 | 0.1575 |
| 3939 | LDHA | GSM4909321 | Human | Breast | IDC | 1.51e-05 | -3.85e-01 | 0.1559 |
| Page: 1 2 3 4 5 6 7 8 9 10 11 12 13 14 15 |
| Tissue | Expression Dynamics | Abbreviation |
| Breast | 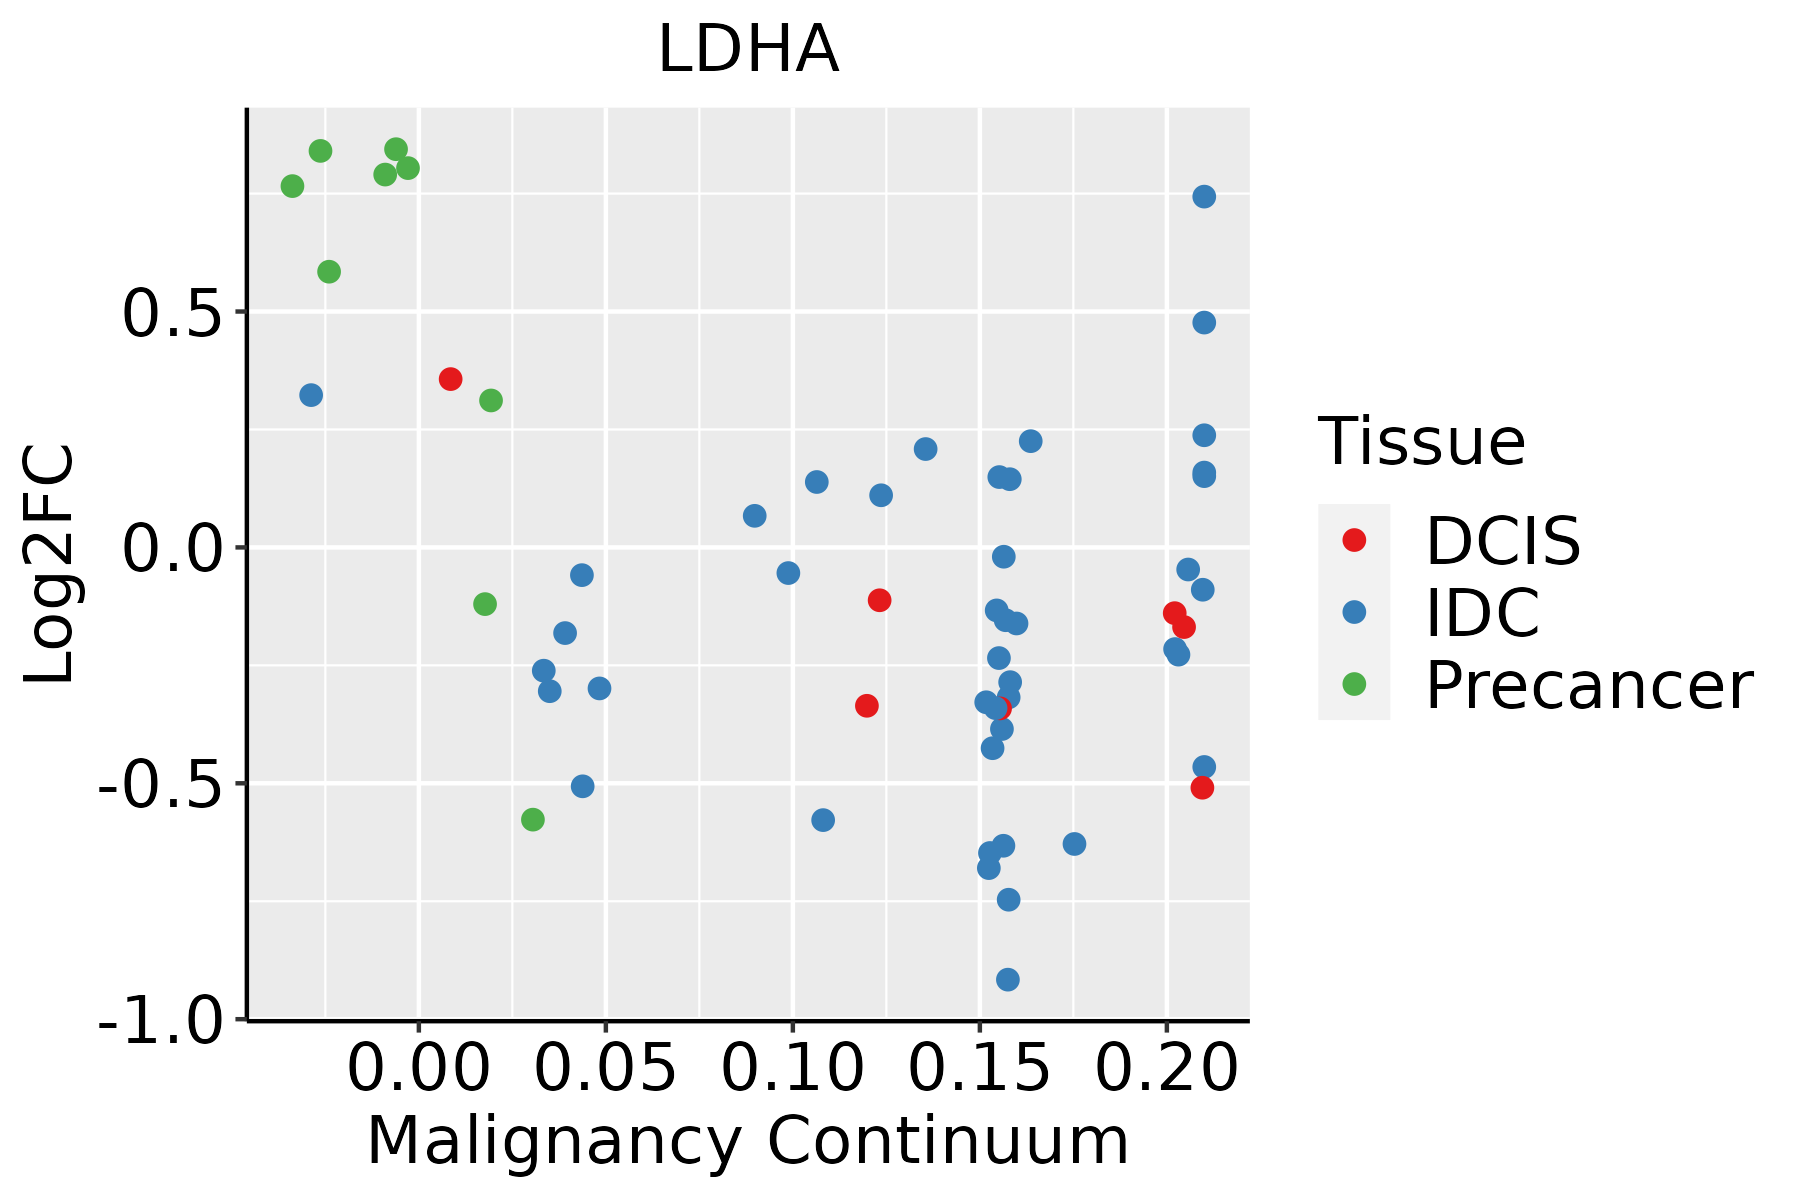 | IDC: Invasive ductal carcinoma |
| DCIS: Ductal carcinoma in situ | ||
| Precancer(BRCA1-mut): Precancerous lesion from BRCA1 mutation carriers | ||
| Cervix | 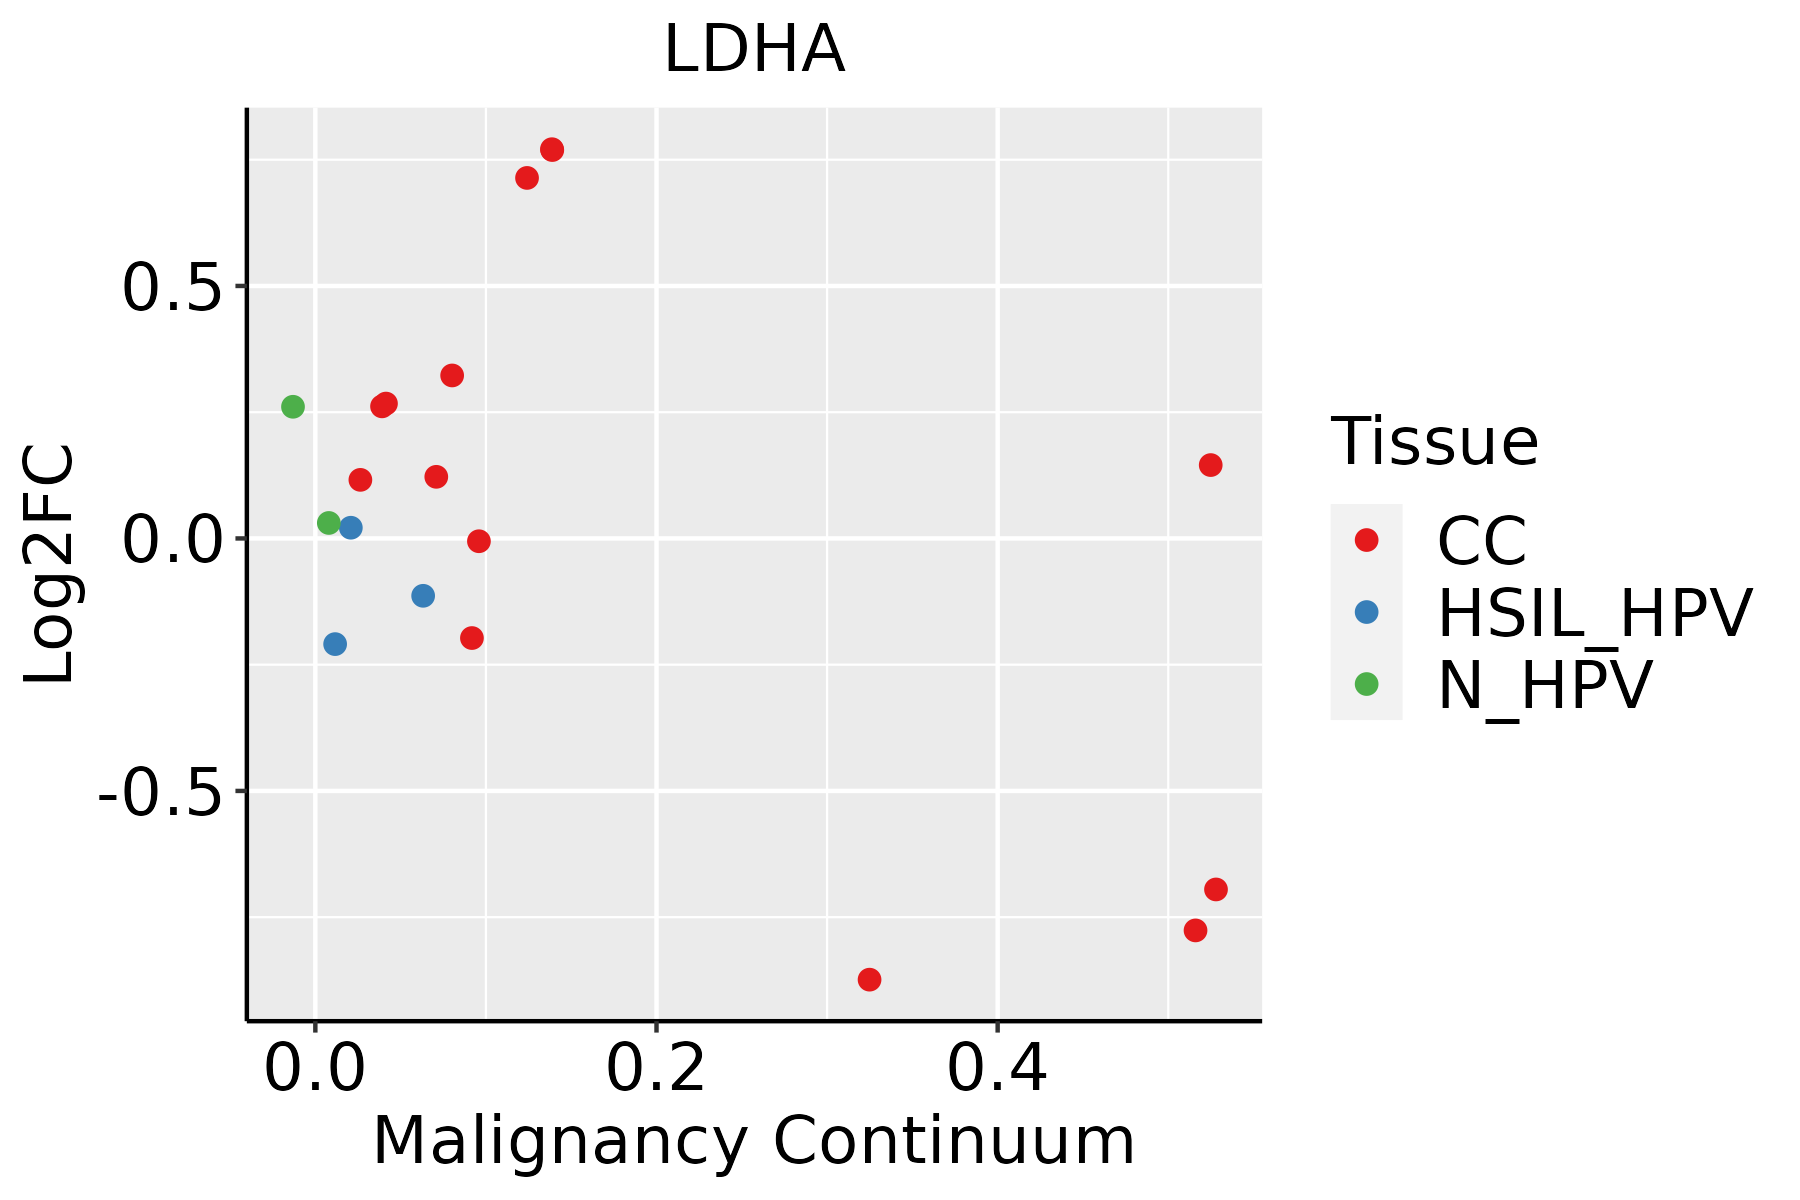 | CC: Cervix cancer |
| HSIL_HPV: HPV-infected high-grade squamous intraepithelial lesions | ||
| N_HPV: HPV-infected normal cervix | ||
| Colorectum (GSE201348) |  | FAP: Familial adenomatous polyposis |
| CRC: Colorectal cancer | ||
| Colorectum (HTA11) |  | AD: Adenomas |
| SER: Sessile serrated lesions | ||
| MSI-H: Microsatellite-high colorectal cancer | ||
| MSS: Microsatellite stable colorectal cancer | ||
| Endometrium |  | AEH: Atypical endometrial hyperplasia |
| EEC: Endometrioid Cancer | ||
| Esophagus | 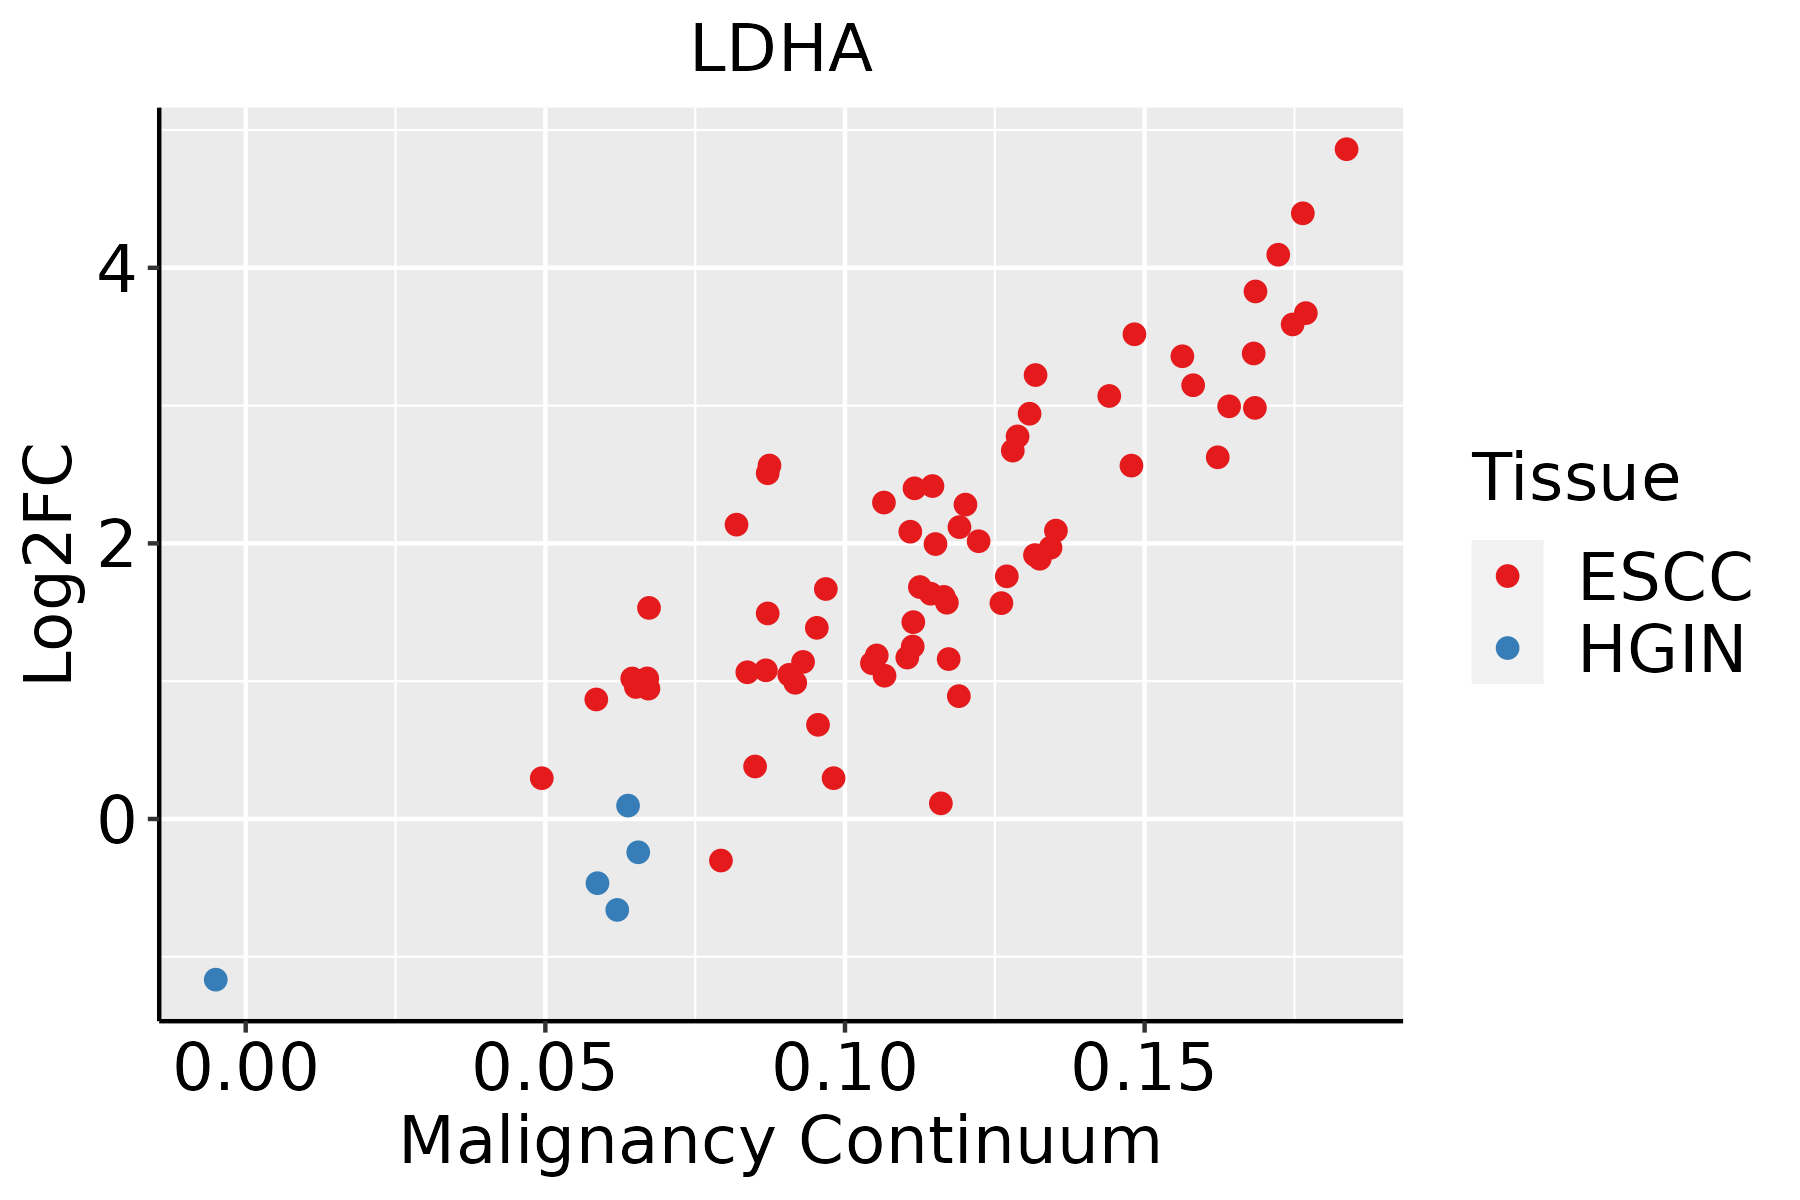 | ESCC: Esophageal squamous cell carcinoma |
| HGIN: High-grade intraepithelial neoplasias | ||
| LGIN: Low-grade intraepithelial neoplasias | ||
| GC | 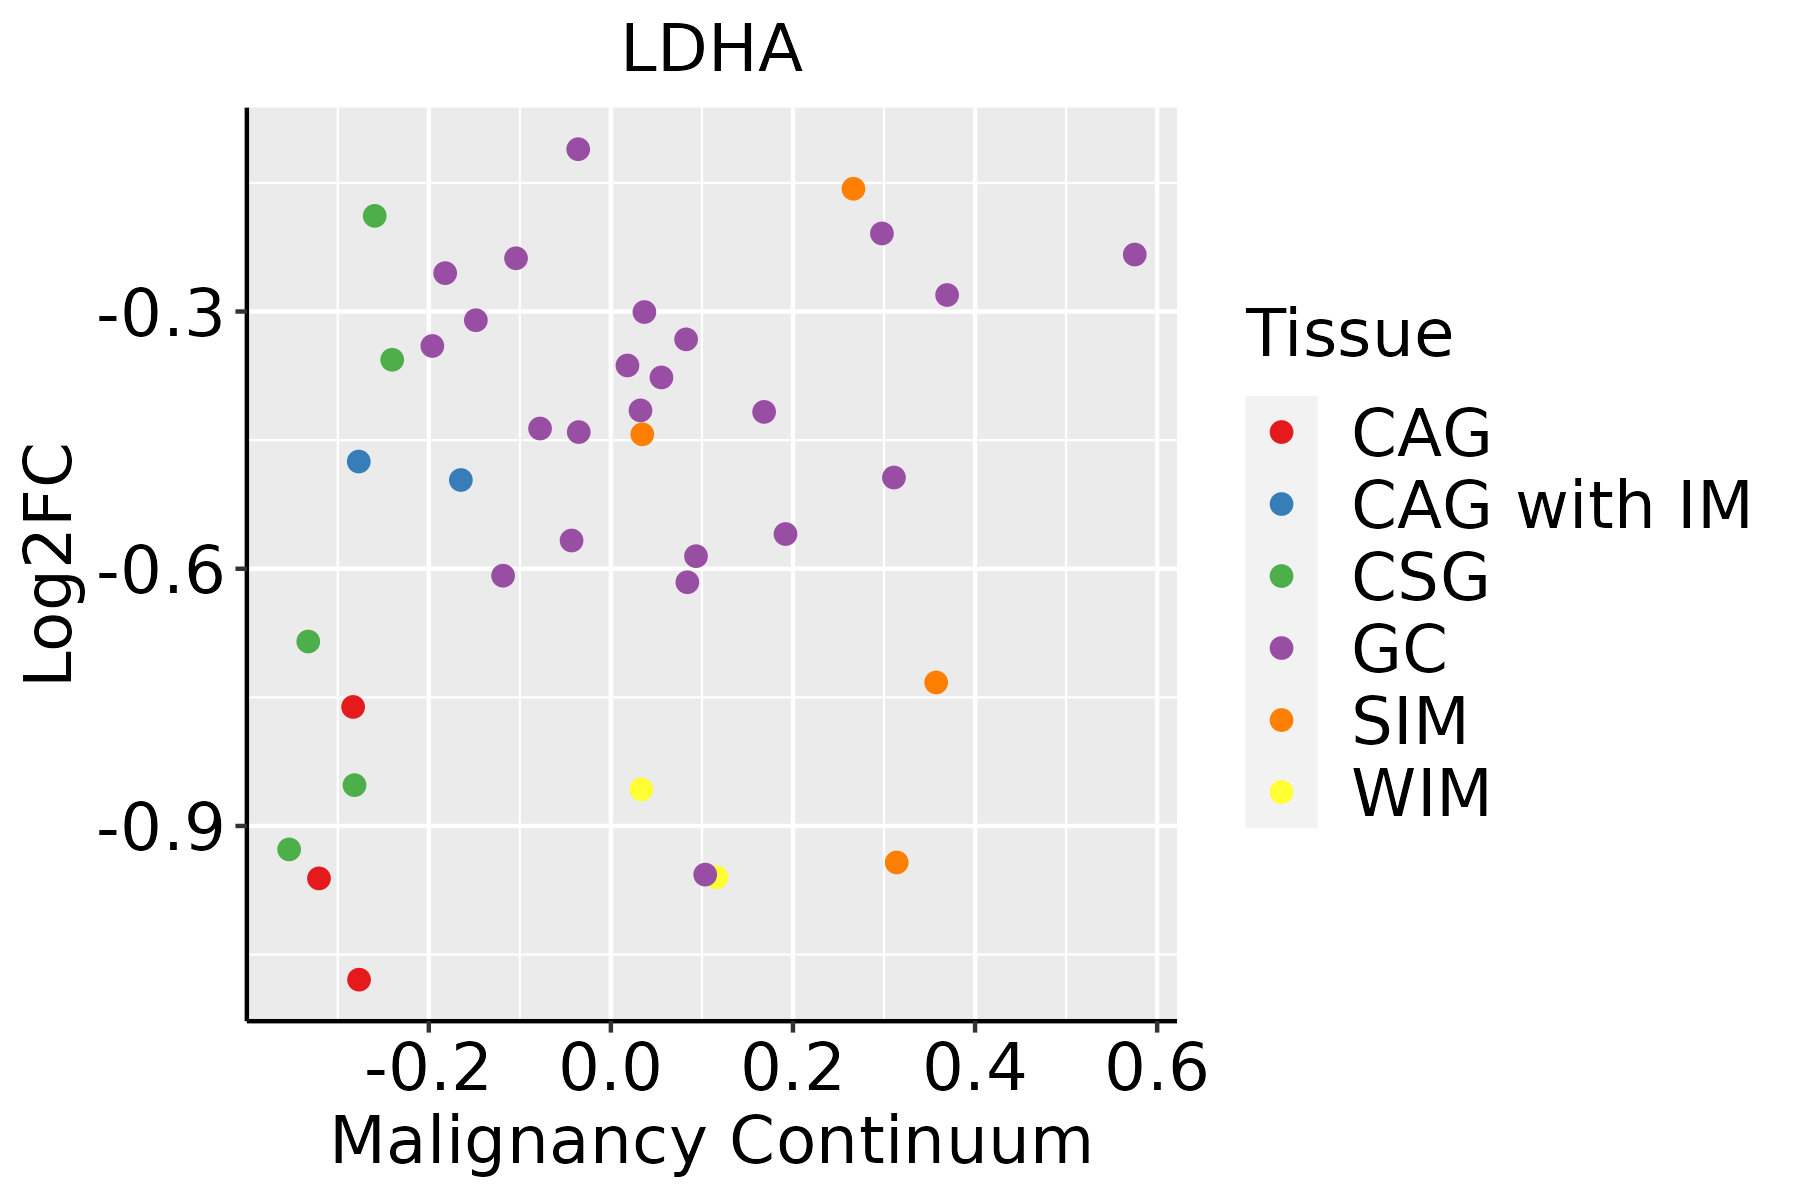 | CAG: Chronic atrophic gastritis |
| CAG with IM: Chronic atrophic gastritis with intestinal metaplasia | ||
| CSG: Chronic superficial gastritis | ||
| GC: Gastric cancer | ||
| SIM: Severe intestinal metaplasia | ||
| WIM: Wild intestinal metaplasia | ||
| Liver |  | HCC: Hepatocellular carcinoma |
| NAFLD: Non-alcoholic fatty liver disease | ||
| Oral Cavity |  | EOLP: Erosive Oral lichen planus |
| LP: leukoplakia | ||
| NEOLP: Non-erosive oral lichen planus | ||
| OSCC: Oral squamous cell carcinoma | ||
| Prostate | 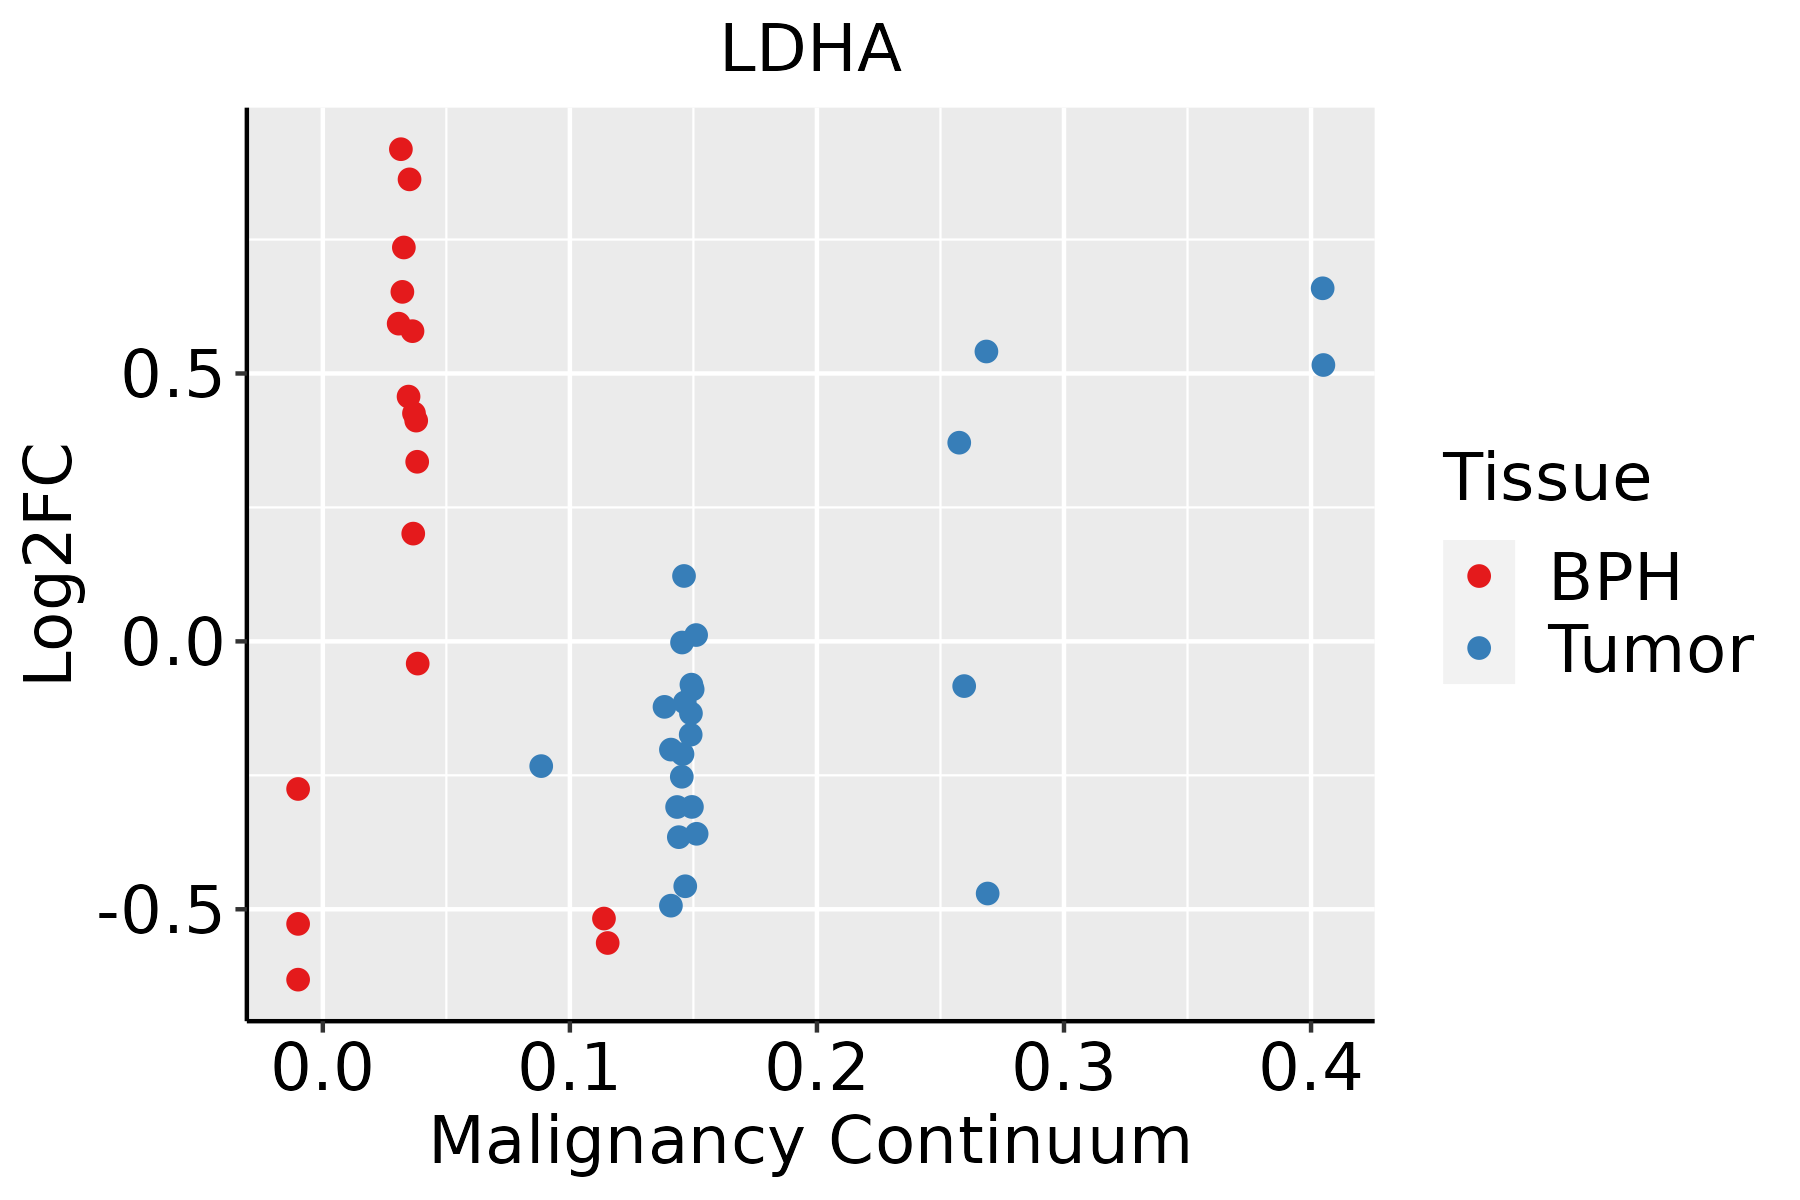 | BPH: Benign Prostatic Hyperplasia |
| Skin | 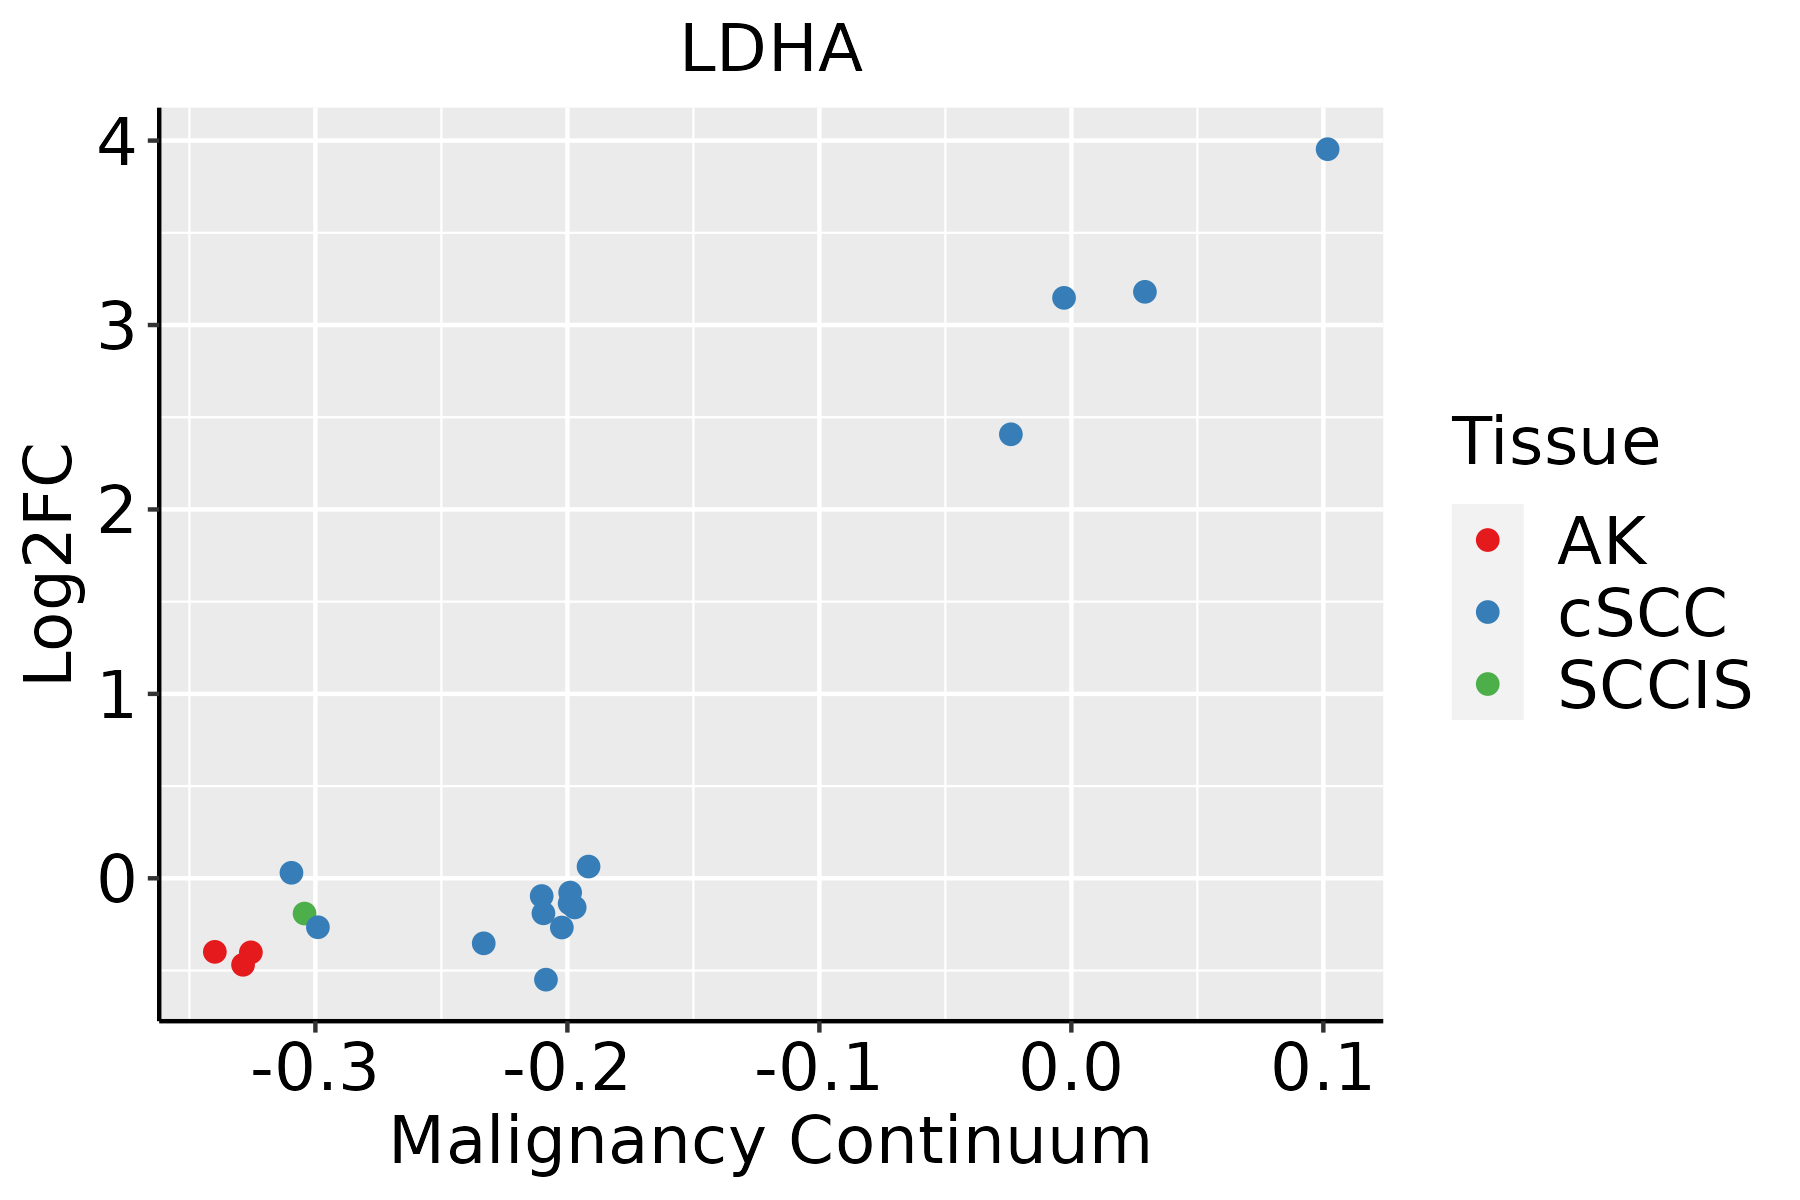 | AK: Actinic keratosis |
| cSCC: Cutaneous squamous cell carcinoma | ||
| SCCIS:squamous cell carcinoma in situ | ||
| Thyroid | 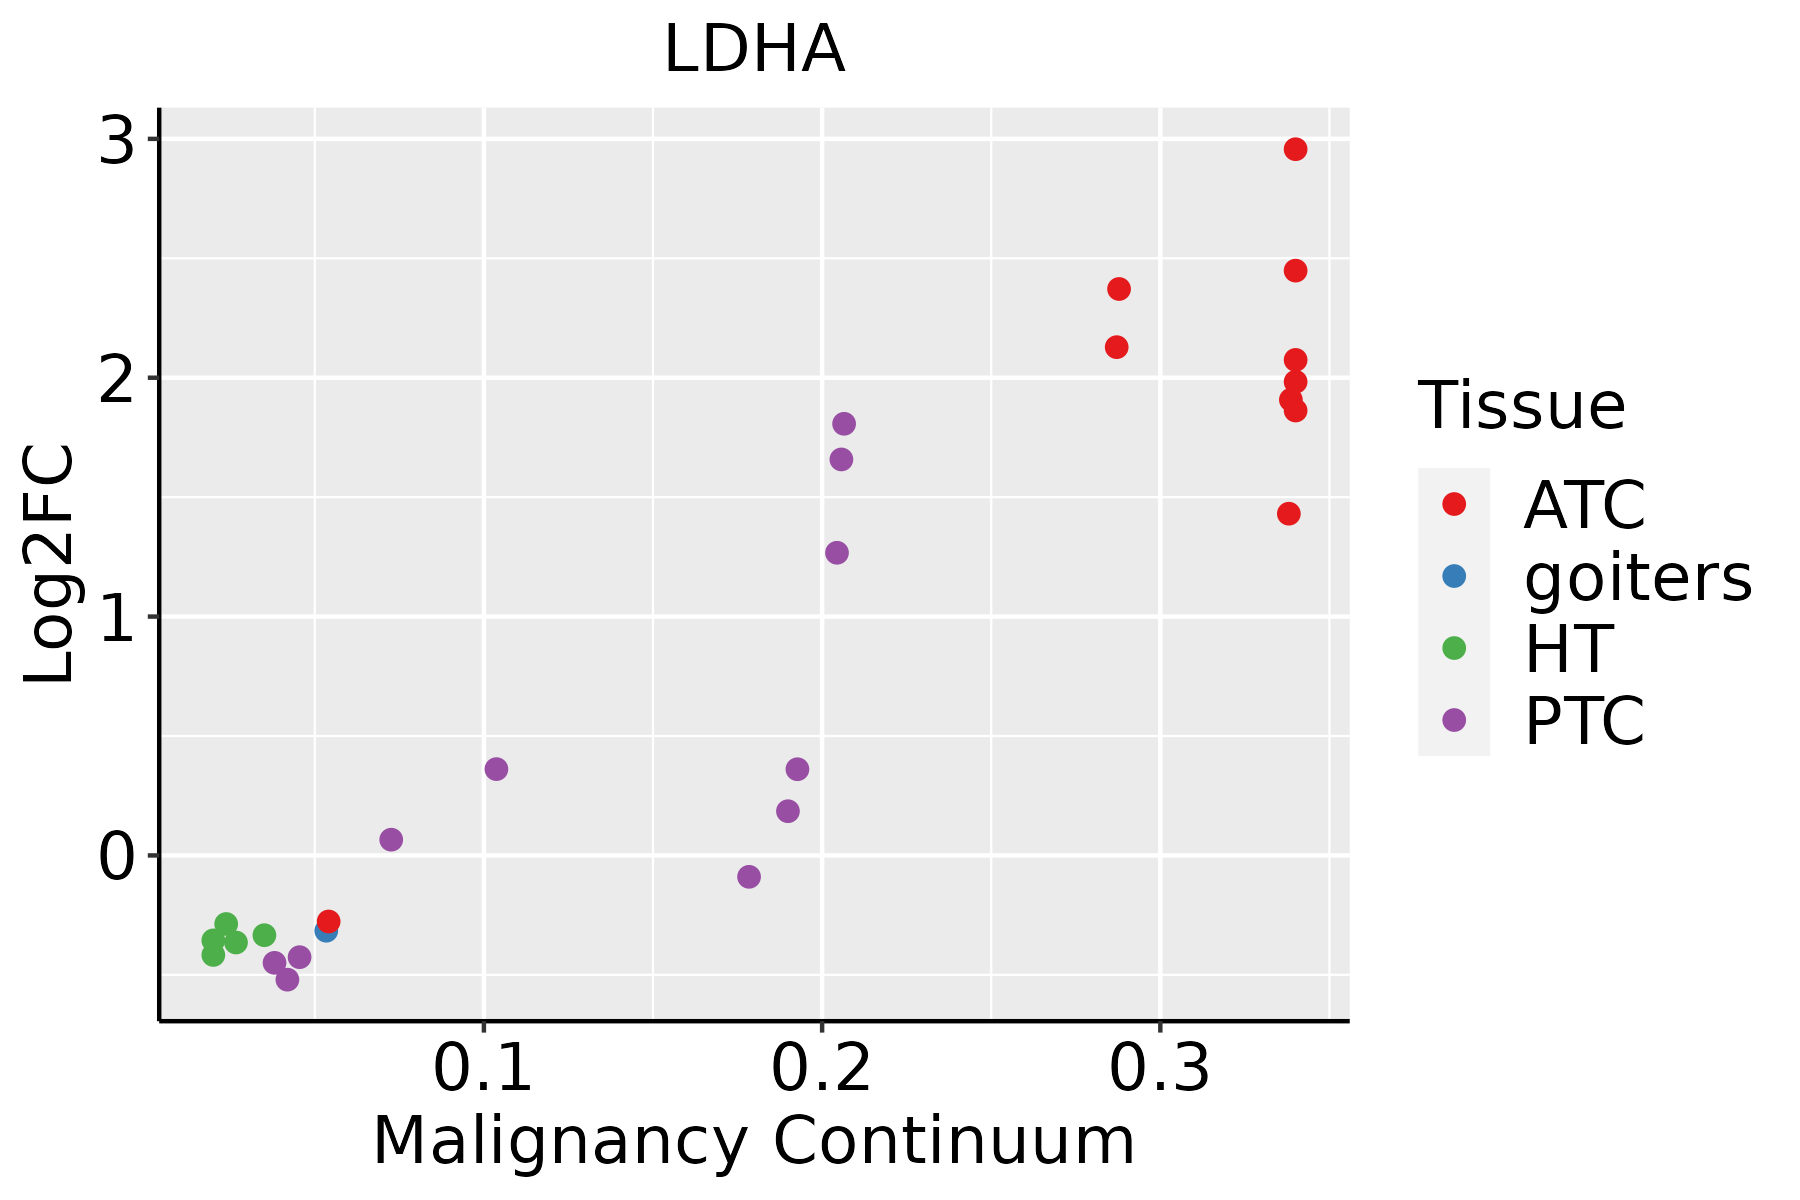 | ATC: Anaplastic thyroid cancer |
| HT: Hashimoto's thyroiditis | ||
| PTC: Papillary thyroid cancer |
| ∗log2FC in expression of this searched gene in stem-like cells from each diseased tissue sample relative to stem-like cells in normal samples in each tissue plotted against the malignancy continuum. Samples are colored based on if they are from different disease stage. |
Top |
Malignant transformation related pathway analysis |
| Find out the enriched GO biological processes and KEGG pathways involved in transition from healthy to precancer to cancer |
| Tissue | Disease Stage | Enriched GO biological Processes |
| Colorectum | AD |  |
| Colorectum | SER |  |
| Colorectum | MSS |  |
| Colorectum | MSI-H |  |
| Colorectum | FAP |  |
| ∗Top 15 enriched GO BP terms are showed in the bar plot of each disease state in each tissue. Each row represents a significant GO biological process which is colored according to the -log10(p.adjust). |
| Page: 1 2 3 4 5 6 7 8 9 |
| GO ID | Tissue | Disease Stage | Description | Gene Ratio | Bg Ratio | pvalue | p.adjust | Count |
| GO:000166631 | Stomach | CAG | response to hypoxia | 22/552 | 307/18723 | 1.23e-04 | 3.03e-03 | 22 |
| GO:00466833 | Stomach | CAG | response to organophosphorus | 13/552 | 131/18723 | 1.34e-04 | 3.22e-03 | 13 |
| GO:000974331 | Stomach | CAG | response to carbohydrate | 19/552 | 253/18723 | 1.93e-04 | 4.22e-03 | 19 |
| GO:003428431 | Stomach | CAG | response to monosaccharide | 17/552 | 225/18723 | 3.85e-04 | 6.98e-03 | 17 |
| GO:00515913 | Stomach | CAG | response to cAMP | 10/552 | 93/18723 | 4.12e-04 | 7.35e-03 | 10 |
| GO:00140743 | Stomach | CAG | response to purine-containing compound | 13/552 | 148/18723 | 4.47e-04 | 7.68e-03 | 13 |
| GO:000974631 | Stomach | CAG | response to hexose | 16/552 | 219/18723 | 8.13e-04 | 1.22e-02 | 16 |
| GO:000974931 | Stomach | CAG | response to glucose | 14/552 | 212/18723 | 4.23e-03 | 3.82e-02 | 14 |
| GO:004603441 | Stomach | WIM | ATP metabolic process | 33/426 | 277/18723 | 7.07e-15 | 1.40e-11 | 33 |
| GO:00094104 | Stomach | WIM | response to xenobiotic stimulus | 33/426 | 462/18723 | 7.26e-09 | 1.20e-06 | 33 |
| GO:000609141 | Stomach | WIM | generation of precursor metabolites and energy | 34/426 | 490/18723 | 8.83e-09 | 1.40e-06 | 34 |
| GO:000697941 | Stomach | WIM | response to oxidative stress | 30/426 | 446/18723 | 1.34e-07 | 1.30e-05 | 30 |
| GO:00316674 | Stomach | WIM | response to nutrient levels | 31/426 | 474/18723 | 1.54e-07 | 1.46e-05 | 31 |
| GO:000030241 | Stomach | WIM | response to reactive oxygen species | 20/426 | 222/18723 | 1.88e-07 | 1.69e-05 | 20 |
| GO:004254241 | Stomach | WIM | response to hydrogen peroxide | 16/426 | 146/18723 | 2.27e-07 | 1.96e-05 | 16 |
| GO:00362934 | Stomach | WIM | response to decreased oxygen levels | 23/426 | 322/18723 | 1.45e-06 | 9.57e-05 | 23 |
| GO:007048241 | Stomach | WIM | response to oxygen levels | 23/426 | 347/18723 | 5.09e-06 | 2.62e-04 | 23 |
| GO:000166641 | Stomach | WIM | response to hypoxia | 21/426 | 307/18723 | 8.11e-06 | 3.83e-04 | 21 |
| GO:003428441 | Stomach | WIM | response to monosaccharide | 17/426 | 225/18723 | 1.66e-05 | 6.85e-04 | 17 |
| GO:000974341 | Stomach | WIM | response to carbohydrate | 18/426 | 253/18723 | 2.12e-05 | 8.33e-04 | 18 |
| Page: 1 2 3 4 5 6 7 8 9 10 11 12 13 14 15 16 17 18 19 20 21 22 23 24 25 26 27 28 29 30 31 32 33 34 35 36 37 38 39 40 41 42 43 44 45 46 47 48 49 50 |
| Pathway ID | Tissue | Disease Stage | Description | Gene Ratio | Bg Ratio | pvalue | p.adjust | qvalue | Count |
| hsa0406616 | Breast | Precancer | HIF-1 signaling pathway | 23/684 | 109/8465 | 1.51e-05 | 1.59e-04 | 1.22e-04 | 23 |
| hsa0001010 | Breast | Precancer | Glycolysis / Gluconeogenesis | 13/684 | 67/8465 | 2.39e-03 | 1.51e-02 | 1.16e-02 | 13 |
| hsa052309 | Breast | Precancer | Central carbon metabolism in cancer | 13/684 | 70/8465 | 3.57e-03 | 2.17e-02 | 1.66e-02 | 13 |
| hsa0406617 | Breast | Precancer | HIF-1 signaling pathway | 23/684 | 109/8465 | 1.51e-05 | 1.59e-04 | 1.22e-04 | 23 |
| hsa0001013 | Breast | Precancer | Glycolysis / Gluconeogenesis | 13/684 | 67/8465 | 2.39e-03 | 1.51e-02 | 1.16e-02 | 13 |
| hsa0523012 | Breast | Precancer | Central carbon metabolism in cancer | 13/684 | 70/8465 | 3.57e-03 | 2.17e-02 | 1.66e-02 | 13 |
| hsa0406623 | Breast | IDC | HIF-1 signaling pathway | 22/867 | 109/8465 | 1.36e-03 | 1.00e-02 | 7.50e-03 | 22 |
| hsa0406633 | Breast | IDC | HIF-1 signaling pathway | 22/867 | 109/8465 | 1.36e-03 | 1.00e-02 | 7.50e-03 | 22 |
| hsa0406642 | Breast | DCIS | HIF-1 signaling pathway | 22/846 | 109/8465 | 9.83e-04 | 7.05e-03 | 5.20e-03 | 22 |
| hsa0406652 | Breast | DCIS | HIF-1 signaling pathway | 22/846 | 109/8465 | 9.83e-04 | 7.05e-03 | 5.20e-03 | 22 |
| hsa0406618 | Cervix | CC | HIF-1 signaling pathway | 27/1267 | 109/8465 | 4.72e-03 | 1.64e-02 | 9.72e-03 | 27 |
| hsa0523010 | Cervix | CC | Central carbon metabolism in cancer | 18/1267 | 70/8465 | 1.29e-02 | 3.87e-02 | 2.29e-02 | 18 |
| hsa0406619 | Cervix | CC | HIF-1 signaling pathway | 27/1267 | 109/8465 | 4.72e-03 | 1.64e-02 | 9.72e-03 | 27 |
| hsa0523013 | Cervix | CC | Central carbon metabolism in cancer | 18/1267 | 70/8465 | 1.29e-02 | 3.87e-02 | 2.29e-02 | 18 |
| hsa00620 | Colorectum | AD | Pyruvate metabolism | 28/2092 | 47/8465 | 3.71e-07 | 5.41e-06 | 3.45e-06 | 28 |
| hsa00010 | Colorectum | AD | Glycolysis / Gluconeogenesis | 34/2092 | 67/8465 | 3.63e-06 | 4.34e-05 | 2.77e-05 | 34 |
| hsa04066 | Colorectum | AD | HIF-1 signaling pathway | 48/2092 | 109/8465 | 7.25e-06 | 7.84e-05 | 5.00e-05 | 48 |
| hsa05230 | Colorectum | AD | Central carbon metabolism in cancer | 33/2092 | 70/8465 | 3.61e-05 | 3.19e-04 | 2.03e-04 | 33 |
| hsa00640 | Colorectum | AD | Propanoate metabolism | 18/2092 | 32/8465 | 1.33e-04 | 1.11e-03 | 7.08e-04 | 18 |
| hsa04922 | Colorectum | AD | Glucagon signaling pathway | 41/2092 | 107/8465 | 1.18e-03 | 7.75e-03 | 4.94e-03 | 41 |
| Page: 1 2 3 4 5 6 7 8 |
Top |
Cell-cell communication analysis |
| Identification of potential cell-cell interactions between two cell types and their ligand-receptor pairs for different disease states |
| Ligand | Receptor | LRpair | Pathway | Tissue | Disease Stage |
| Page: 1 |
Top |
Single-cell gene regulatory network inference analysis |
| Find out the significant the regulons (TFs) and the target genes of each regulon across cell types for different disease states |
| TF | Cell Type | Tissue | Disease Stage | Target Gene | RSS | Regulon Activity |
| ∗The dot plots of a searched regulon are shown for all cell subpopulations in each disease state of each tissue based on the regulon specific score inferred using pySCENIC and by calculating the average expression. |
| Page: 1 |
Top |
Somatic mutation of malignant transformation related genes |
| Annotation of somatic variants for genes involved in malignant transformation |
| Hugo Symbol | Variant Class | Variant Classification | dbSNP RS | HGVSc | HGVSp | HGVSp Short | SWISSPROT | BIOTYPE | SIFT | PolyPhen | Tumor Sample Barcode | Tissue | Histology | Sex | Age | Stage | Therapy Types | Drugs | Outcome |
| LDHA | SNV | Missense_Mutation | c.1018G>A | p.Glu340Lys | p.E340K | P00338 | protein_coding | tolerated(0.09) | benign(0.012) | TCGA-AC-A2B8-01 | Breast | breast invasive carcinoma | Female | >=65 | I/II | Chemotherapy | chemo | PD | |
| LDHA | SNV | Missense_Mutation | rs746460566 | c.448N>G | p.Ile150Val | p.I150V | P00338 | protein_coding | tolerated(0.16) | benign(0.039) | TCGA-AO-A128-01 | Breast | breast invasive carcinoma | Female | <65 | I/II | Chemotherapy | doxorubicin | SD |
| LDHA | SNV | Missense_Mutation | novel | c.169N>A | p.Val57Ile | p.V57I | P00338 | protein_coding | deleterious(0.04) | possibly_damaging(0.791) | TCGA-E9-A3QA-01 | Breast | breast invasive carcinoma | Female | <65 | I/II | Unknown | Unknown | SD |
| LDHA | SNV | Missense_Mutation | rs763532603 | c.382C>T | p.Arg128Cys | p.R128C | P00338 | protein_coding | tolerated(0.15) | benign(0.012) | TCGA-EA-A410-01 | Cervix | cervical & endocervical cancer | Female | <65 | I/II | Unknown | Unknown | SD |
| LDHA | SNV | Missense_Mutation | rs144856598 | c.250N>A | p.Glu84Lys | p.E84K | P00338 | protein_coding | tolerated(0.05) | benign(0.015) | TCGA-AG-3892-01 | Colorectum | rectum adenocarcinoma | Female | <65 | I/II | Unknown | Unknown | SD |
| LDHA | insertion | Frame_Shift_Ins | novel | c.765_766insAC | p.Trp256ThrfsTer16 | p.W256Tfs*16 | P00338 | protein_coding | TCGA-AM-5820-01 | Colorectum | colon adenocarcinoma | Female | <65 | I/II | Unknown | Unknown | SD | ||
| LDHA | deletion | Frame_Shift_Del | c.609delN | p.Glu205LysfsTer8 | p.E205Kfs*8 | P00338 | protein_coding | TCGA-CK-5916-01 | Colorectum | colon adenocarcinoma | Female | >=65 | I/II | Unknown | Unknown | PD | |||
| LDHA | SNV | Missense_Mutation | rs144856598 | c.250G>A | p.Glu84Lys | p.E84K | P00338 | protein_coding | tolerated(0.05) | benign(0.015) | TCGA-AJ-A5DW-01 | Endometrium | uterine corpus endometrioid carcinoma | Female | <65 | I/II | Unknown | Unknown | SD |
| LDHA | SNV | Missense_Mutation | rs200268273 | c.523N>A | p.Val175Met | p.V175M | P00338 | protein_coding | deleterious(0.01) | possibly_damaging(0.8) | TCGA-AP-A059-01 | Endometrium | uterine corpus endometrioid carcinoma | Female | >=65 | I/II | Unknown | Unknown | SD |
| LDHA | SNV | Missense_Mutation | rs140090654 | c.1031G>A | p.Arg344His | p.R344H | P00338 | protein_coding | tolerated(0.64) | benign(0.001) | TCGA-AP-A0LM-01 | Endometrium | uterine corpus endometrioid carcinoma | Female | <65 | III/IV | Chemotherapy | cisplatin | SD |
| Page: 1 2 3 4 |
Top |
Related drugs of malignant transformation related genes |
| Identification of chemicals and drugs interact with genes involved in malignant transfromation |
| (DGIdb 4.0) |
| Entrez ID | Symbol | Category | Interaction Types | Drug Claim Name | Drug Name | PMIDs |
| 3939 | LDHA | DRUGGABLE GENOME | ANTHRACYCLINES | 3458424 | ||
| 3939 | LDHA | DRUGGABLE GENOME | TETRAHYDRO-NAD | CHEMBL2058994 | 22417091 |
| Page: 1 |

Copyright 2023-Present -The University of Texas Health Science Center at Houston |