| Tissue | Expression Dynamics | Abbreviation |
| Cervix | 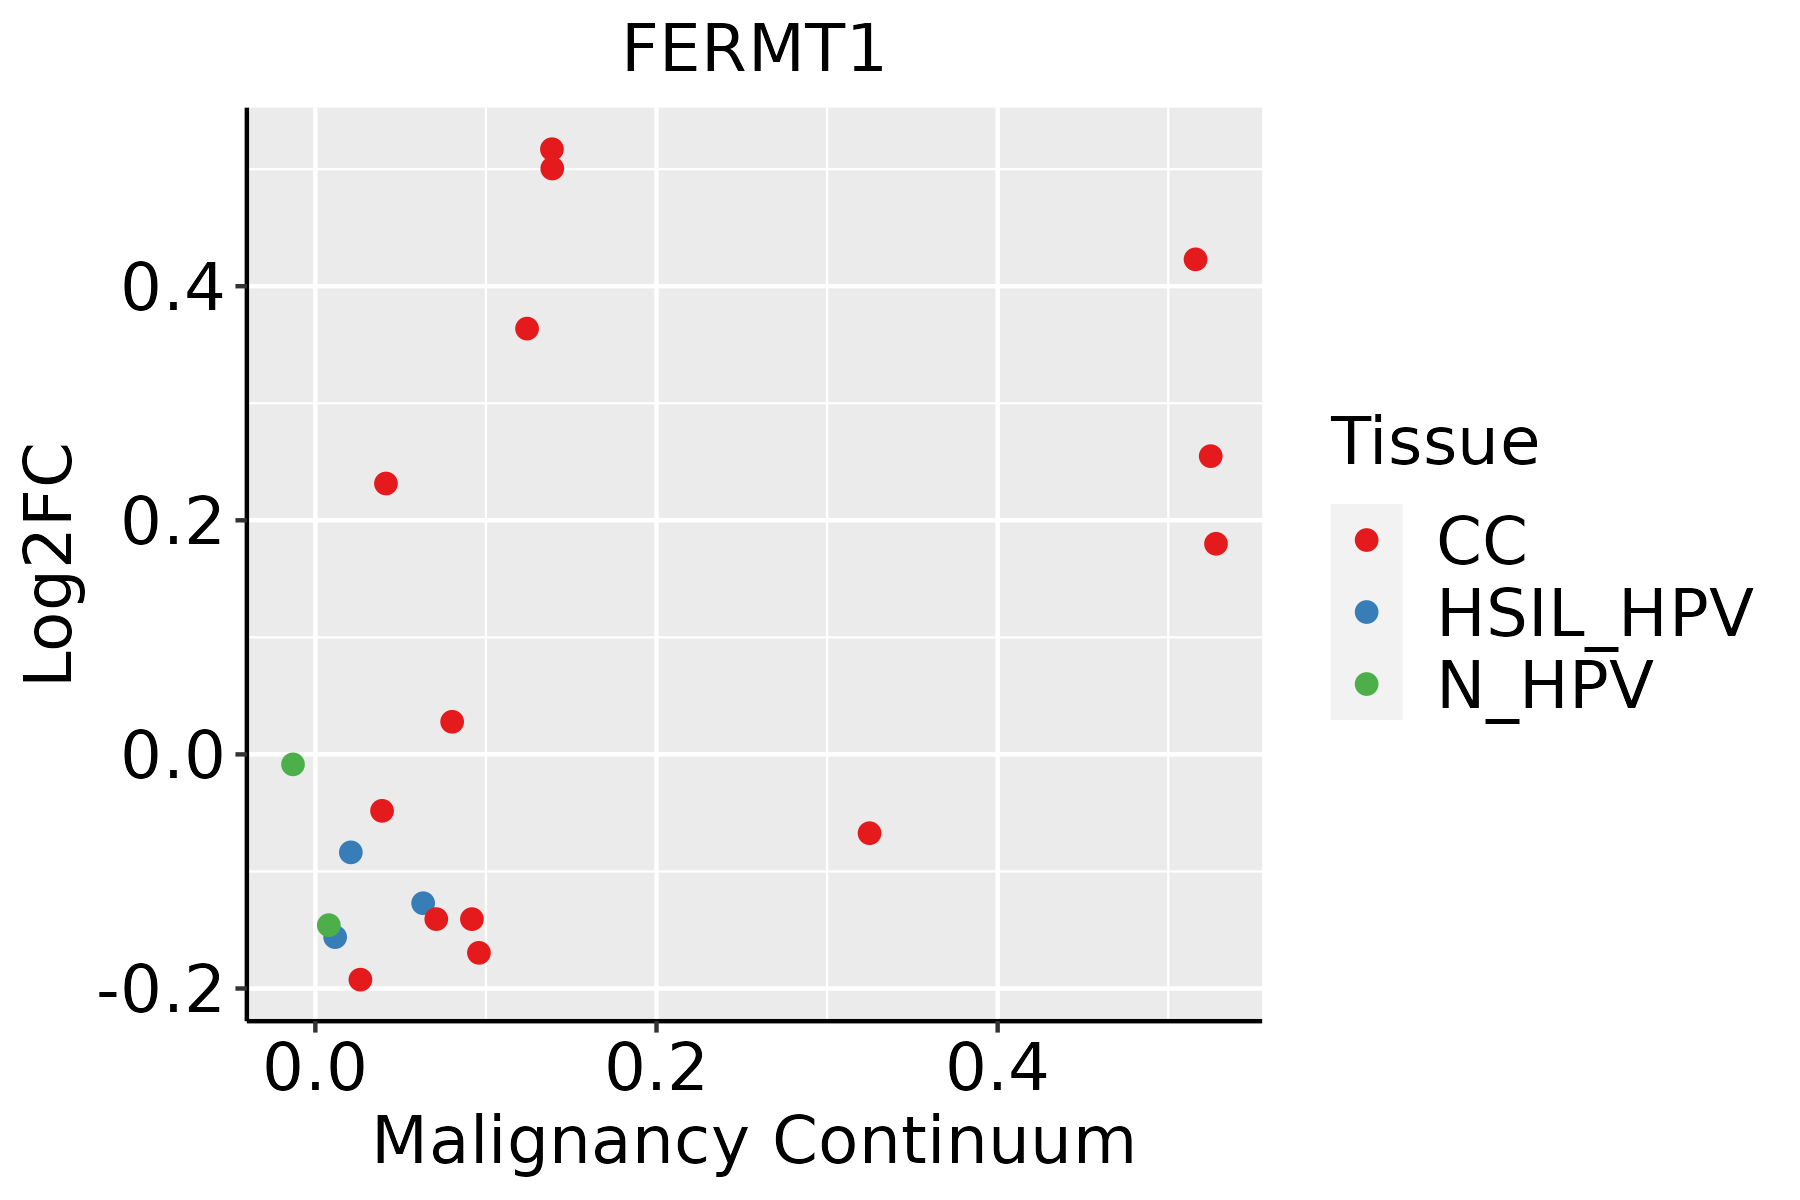 | CC: Cervix cancer |
| HSIL_HPV: HPV-infected high-grade squamous intraepithelial lesions |
| N_HPV: HPV-infected normal cervix |
| Colorectum (GSE201348) | 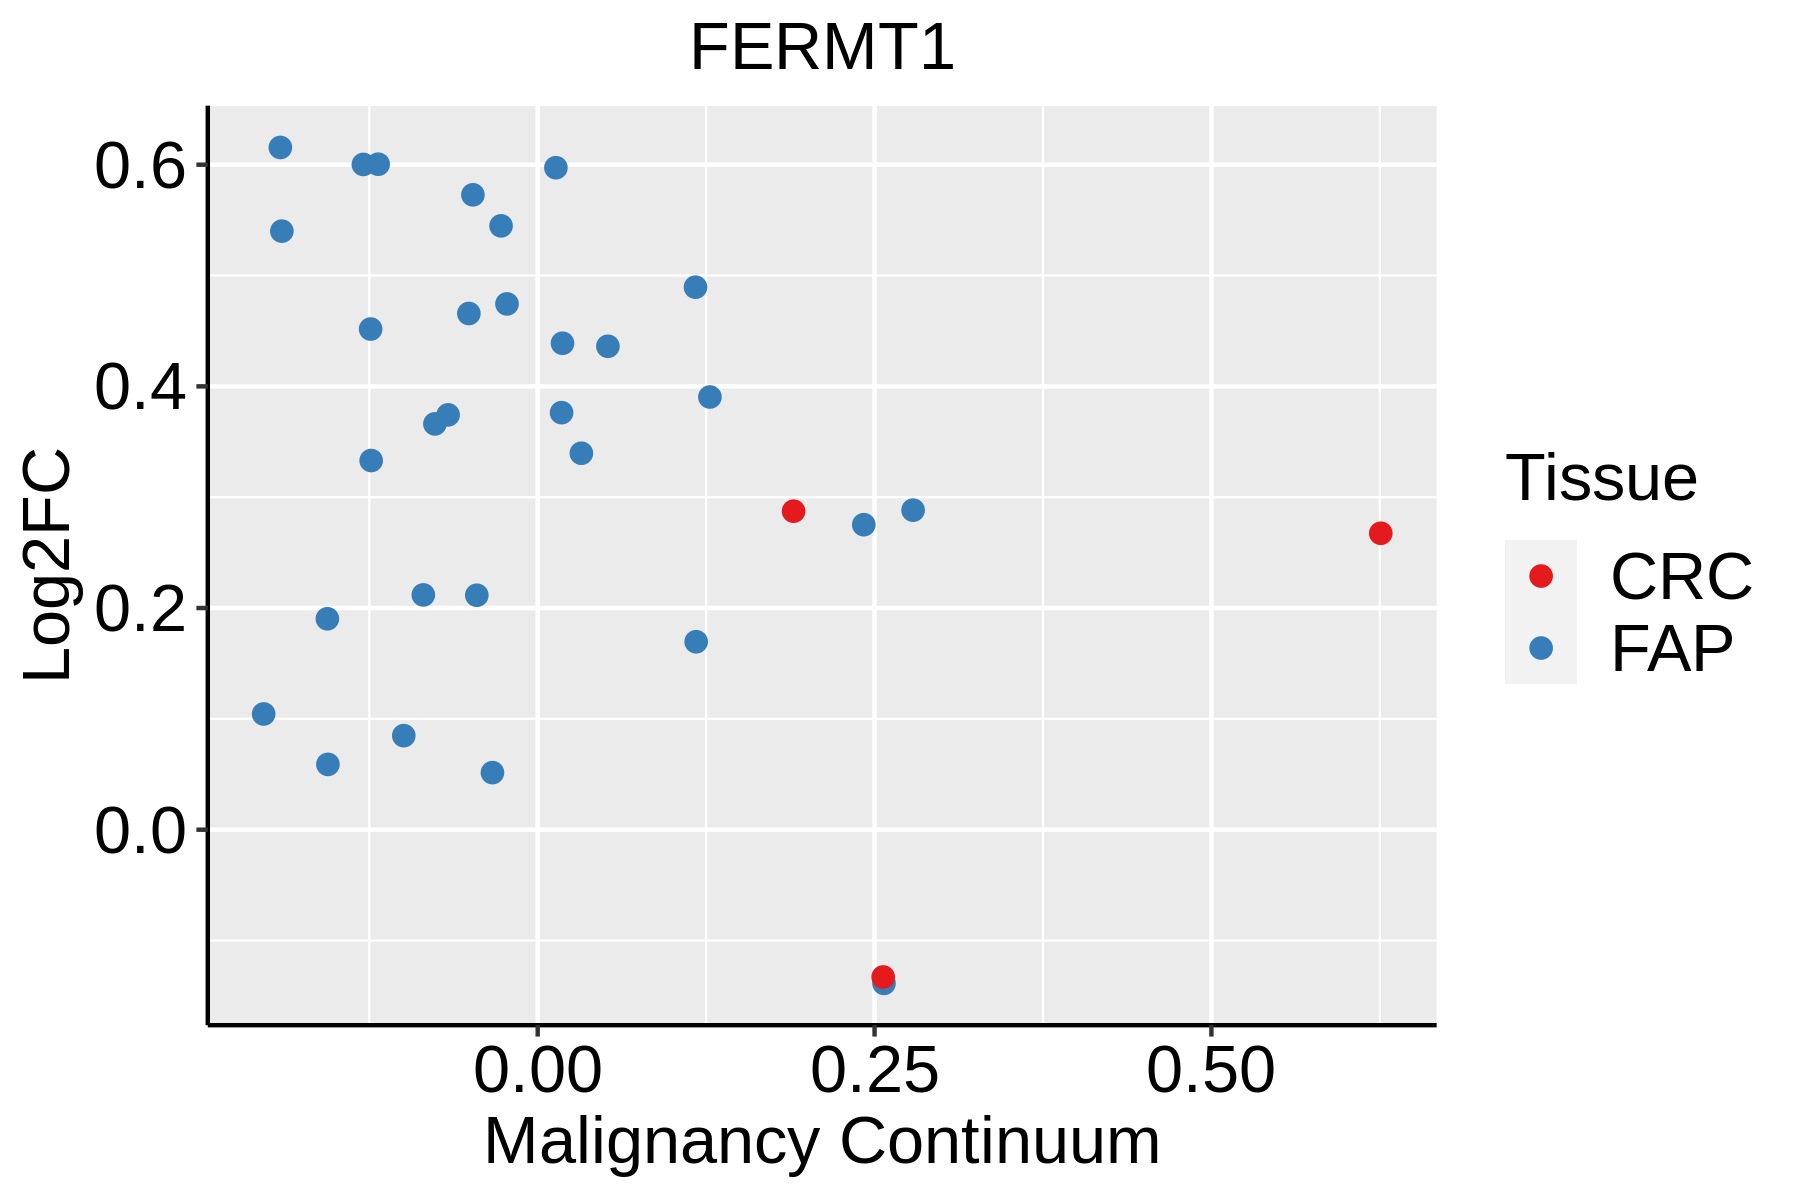 | FAP: Familial adenomatous polyposis |
| CRC: Colorectal cancer |
| Colorectum (HTA11) | 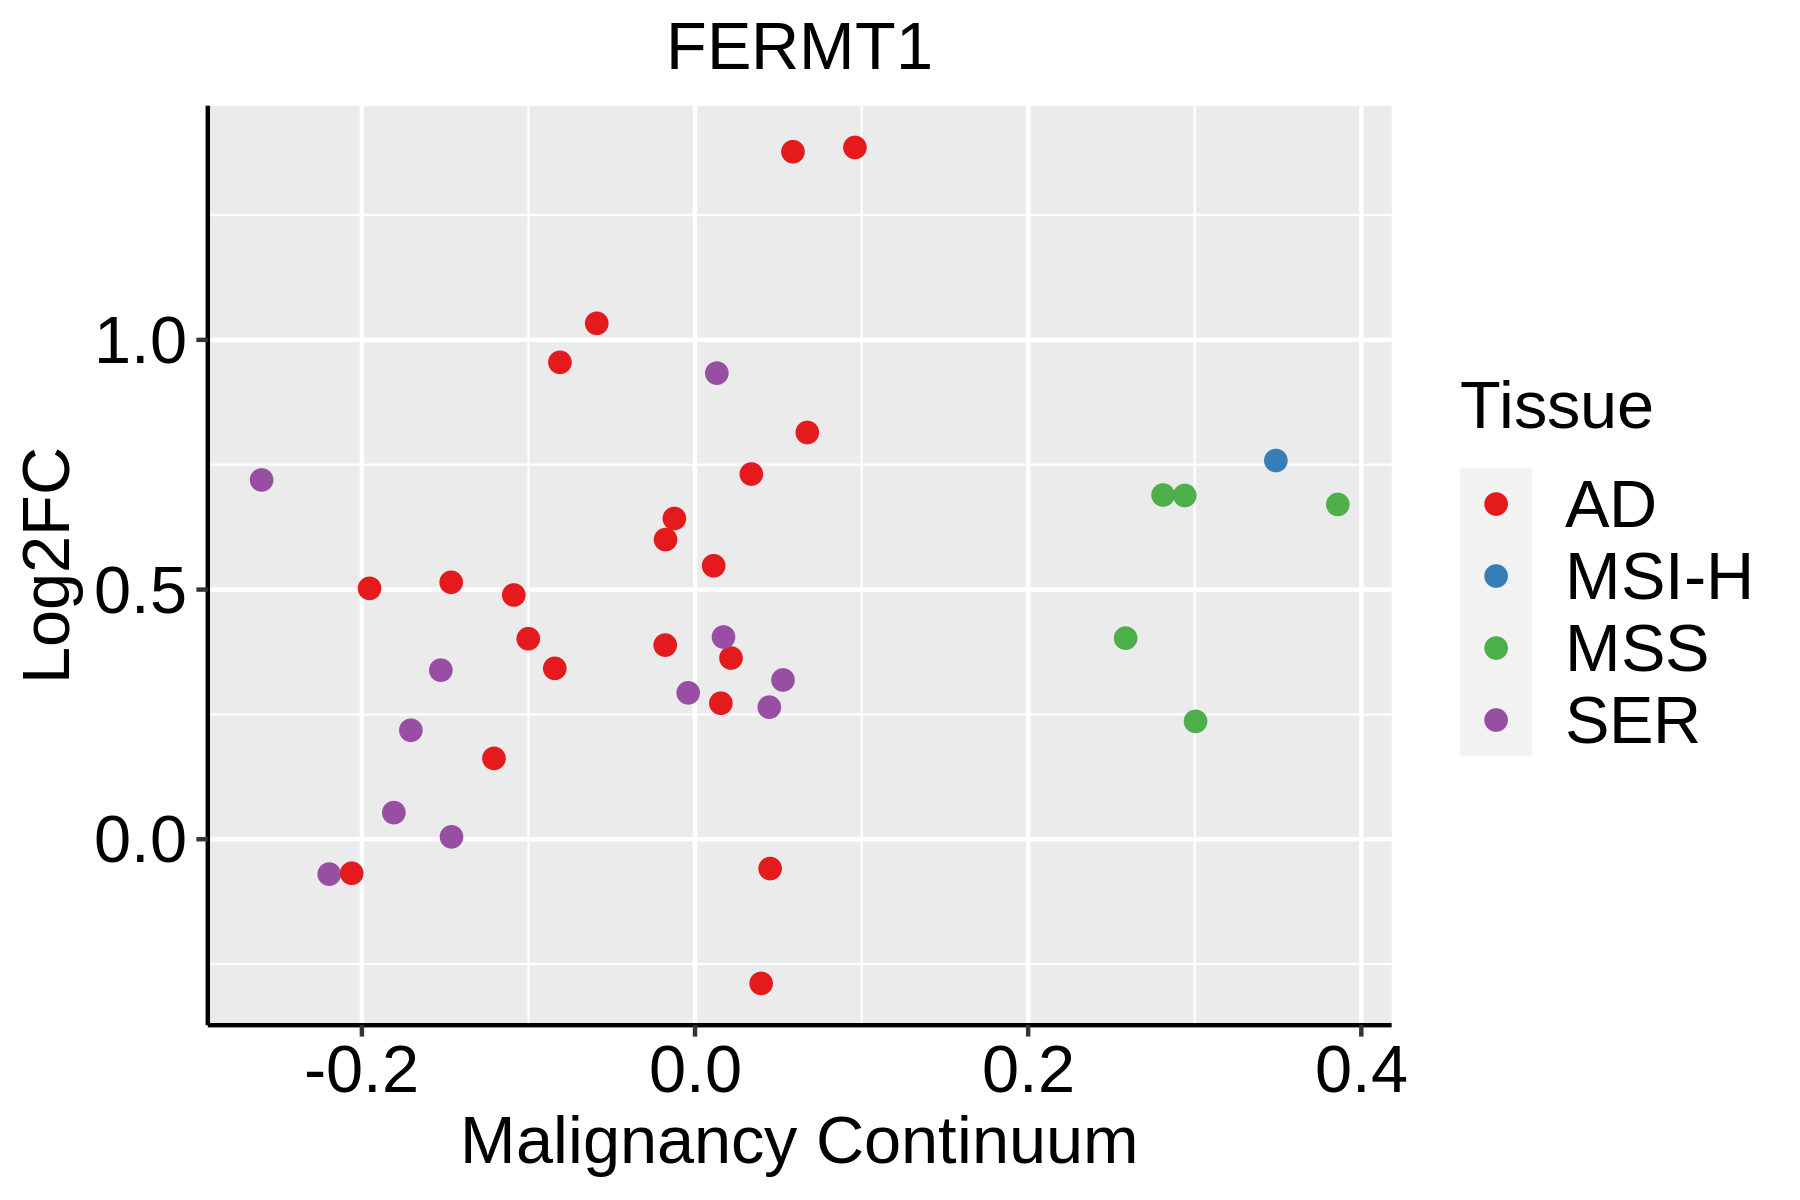 | AD: Adenomas |
| SER: Sessile serrated lesions |
| MSI-H: Microsatellite-high colorectal cancer |
| MSS: Microsatellite stable colorectal cancer |
| Esophagus | 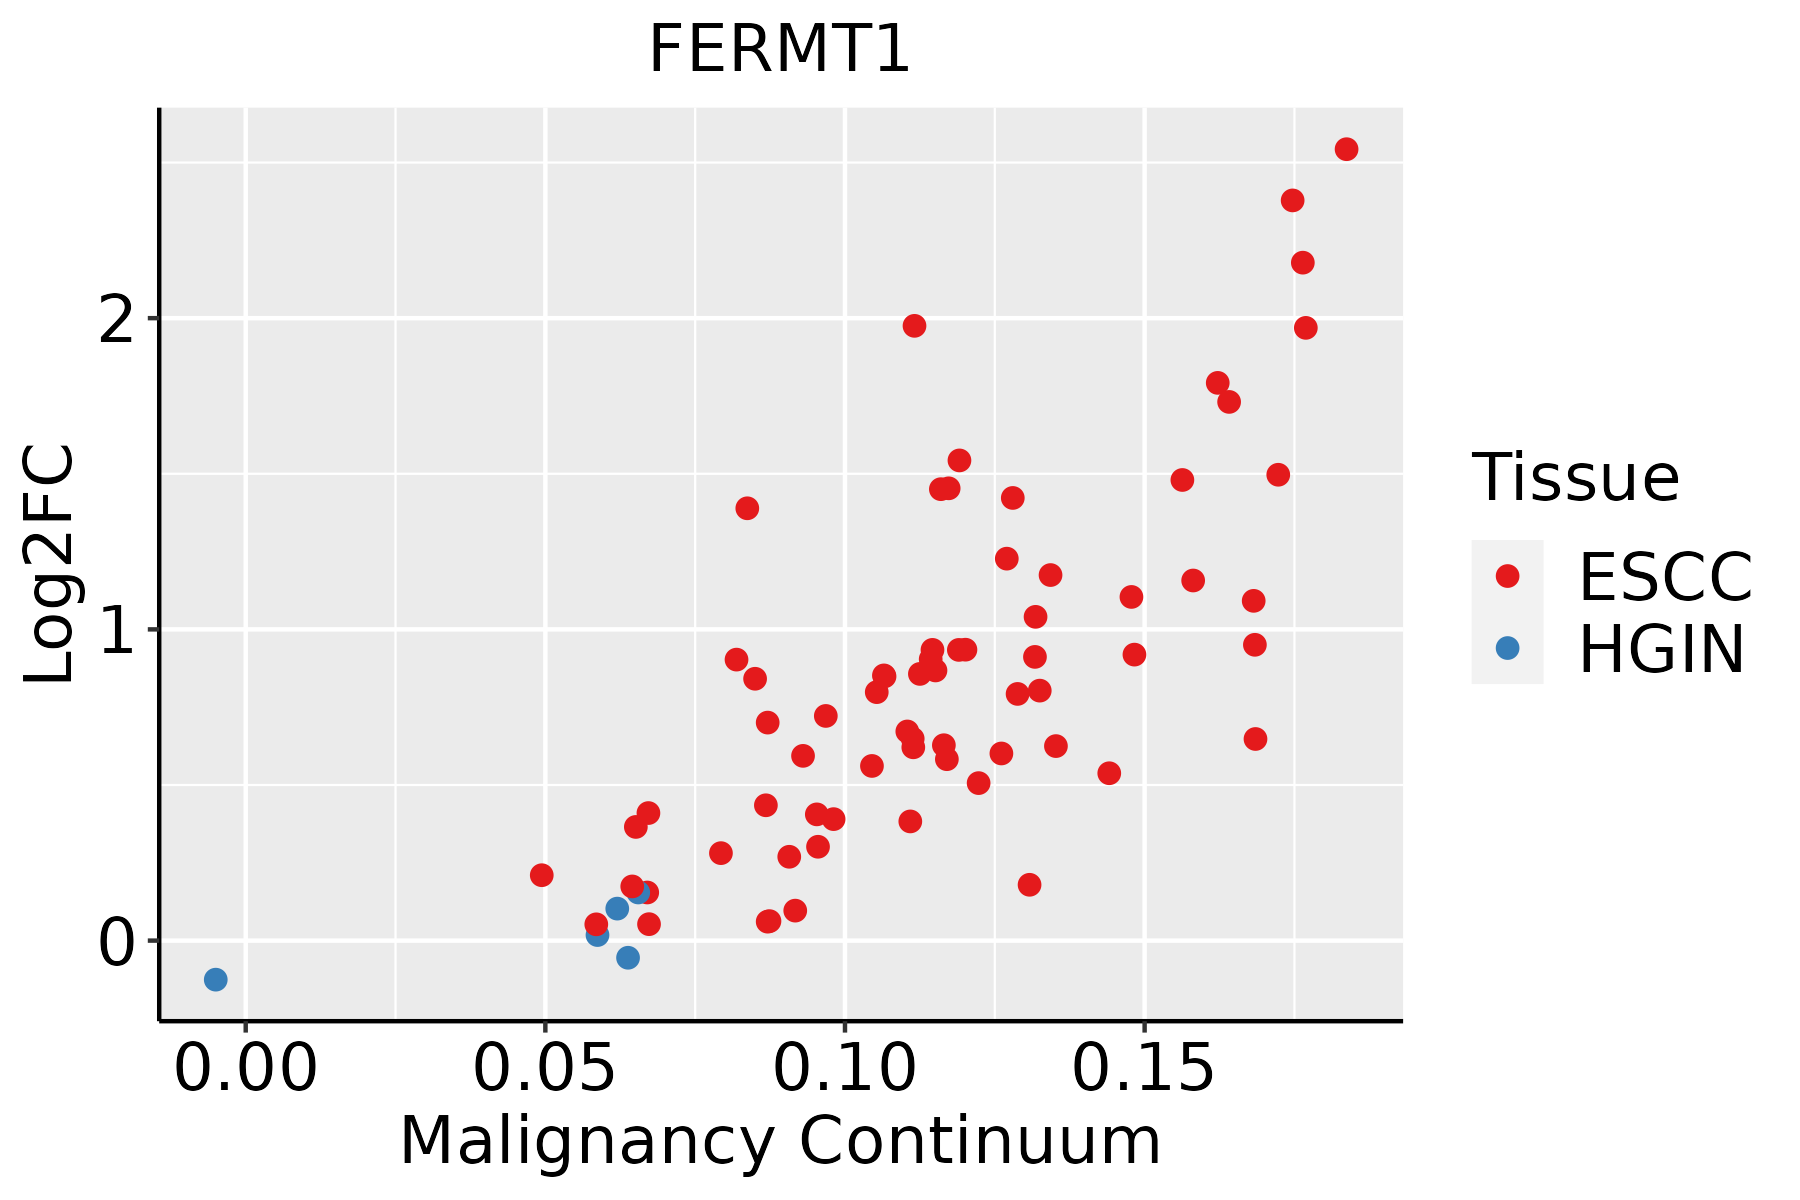 | ESCC: Esophageal squamous cell carcinoma |
| HGIN: High-grade intraepithelial neoplasias |
| LGIN: Low-grade intraepithelial neoplasias |
| Liver | 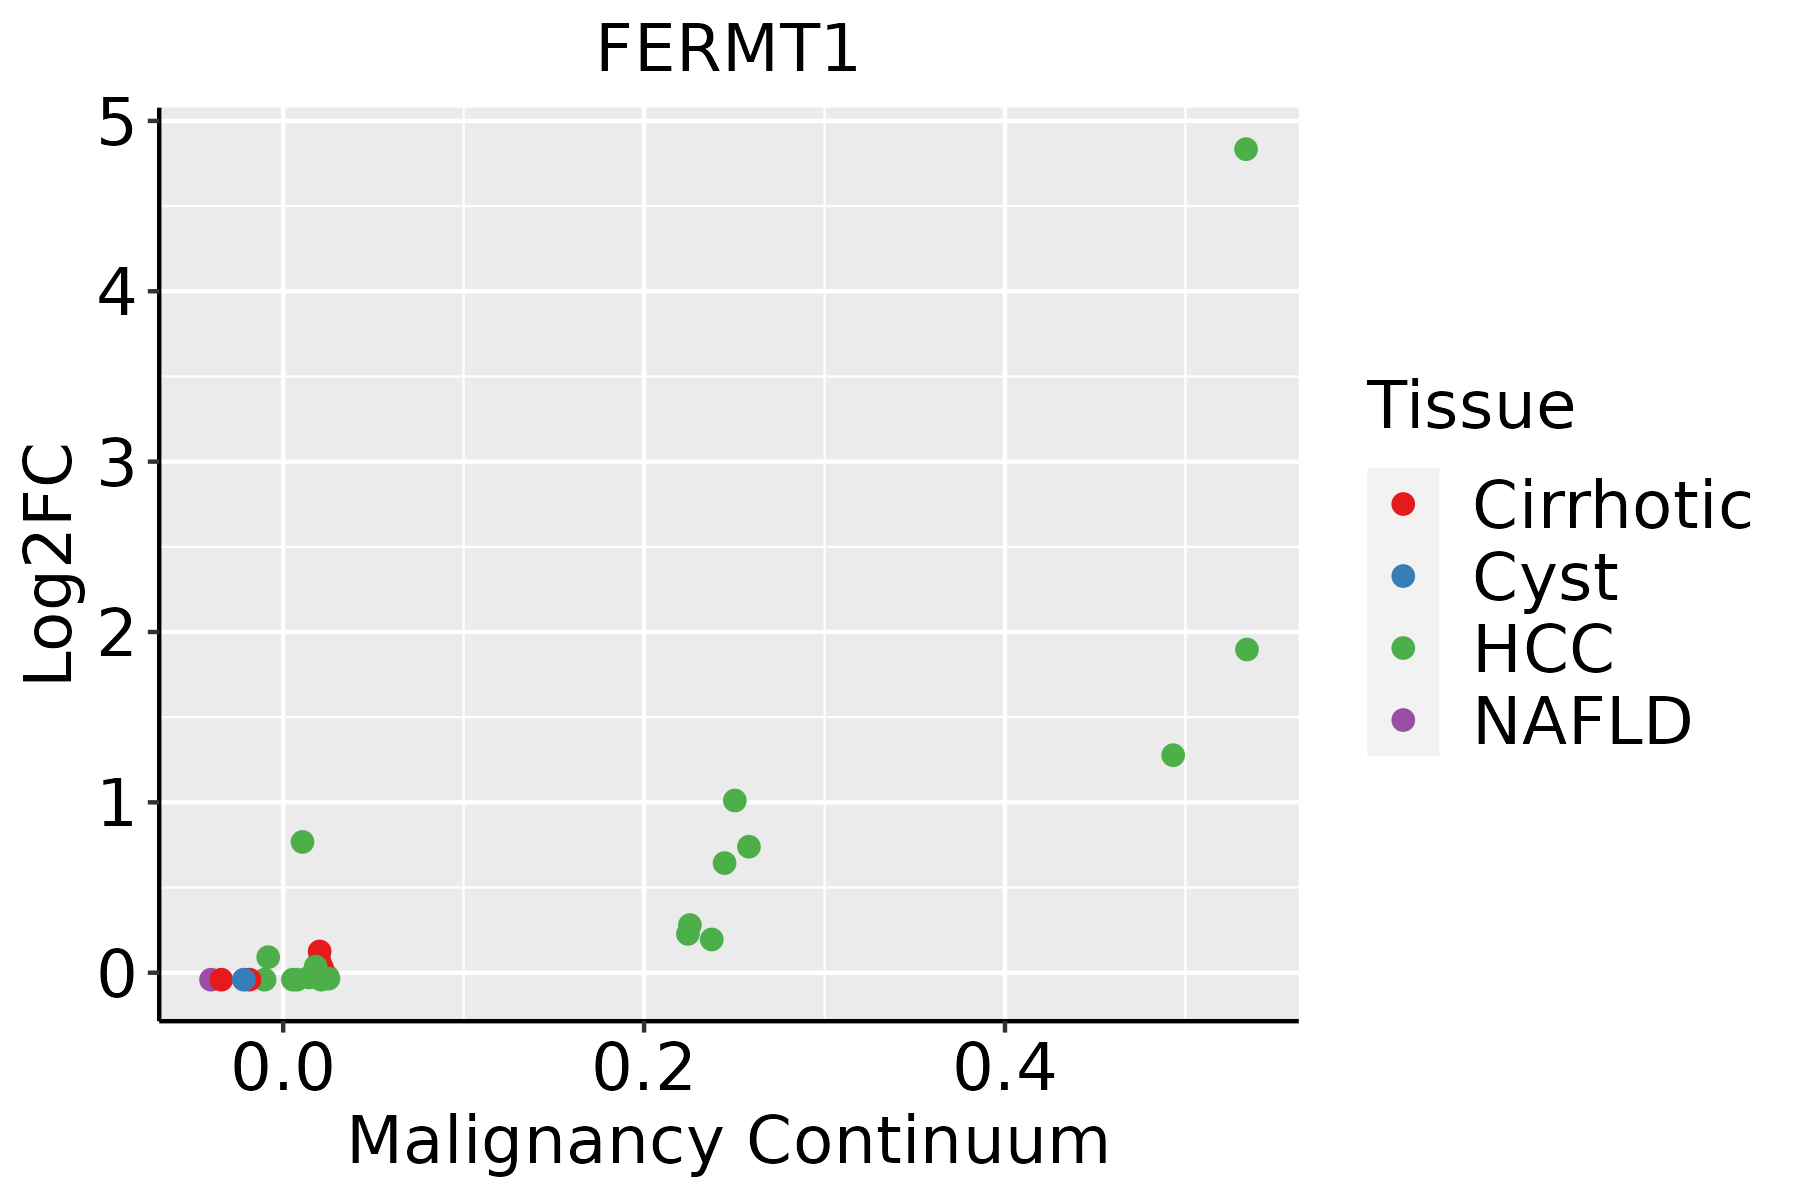 | HCC: Hepatocellular carcinoma |
| NAFLD: Non-alcoholic fatty liver disease |
| Oral Cavity | 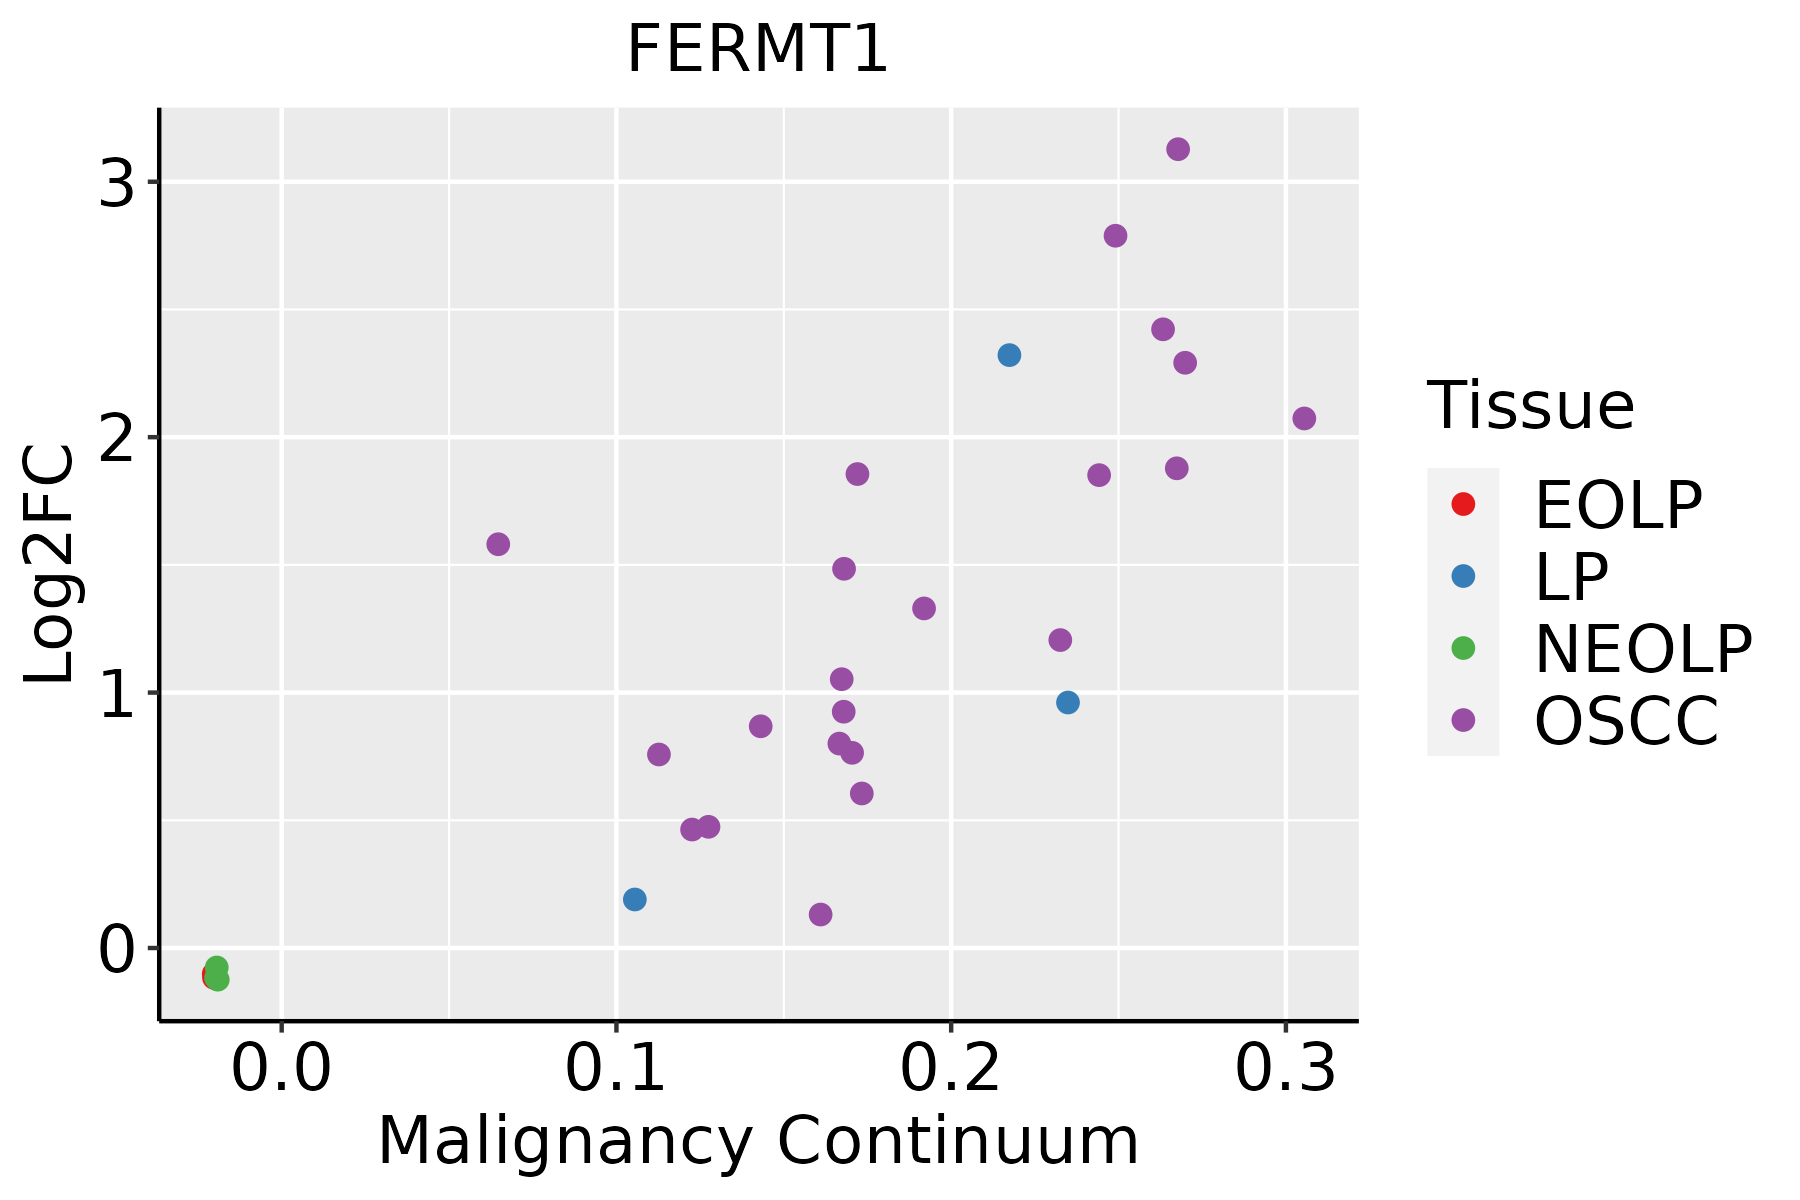 | EOLP: Erosive Oral lichen planus |
| LP: leukoplakia |
| NEOLP: Non-erosive oral lichen planus |
| OSCC: Oral squamous cell carcinoma |
| Prostate |  | BPH: Benign Prostatic Hyperplasia |
| Skin | 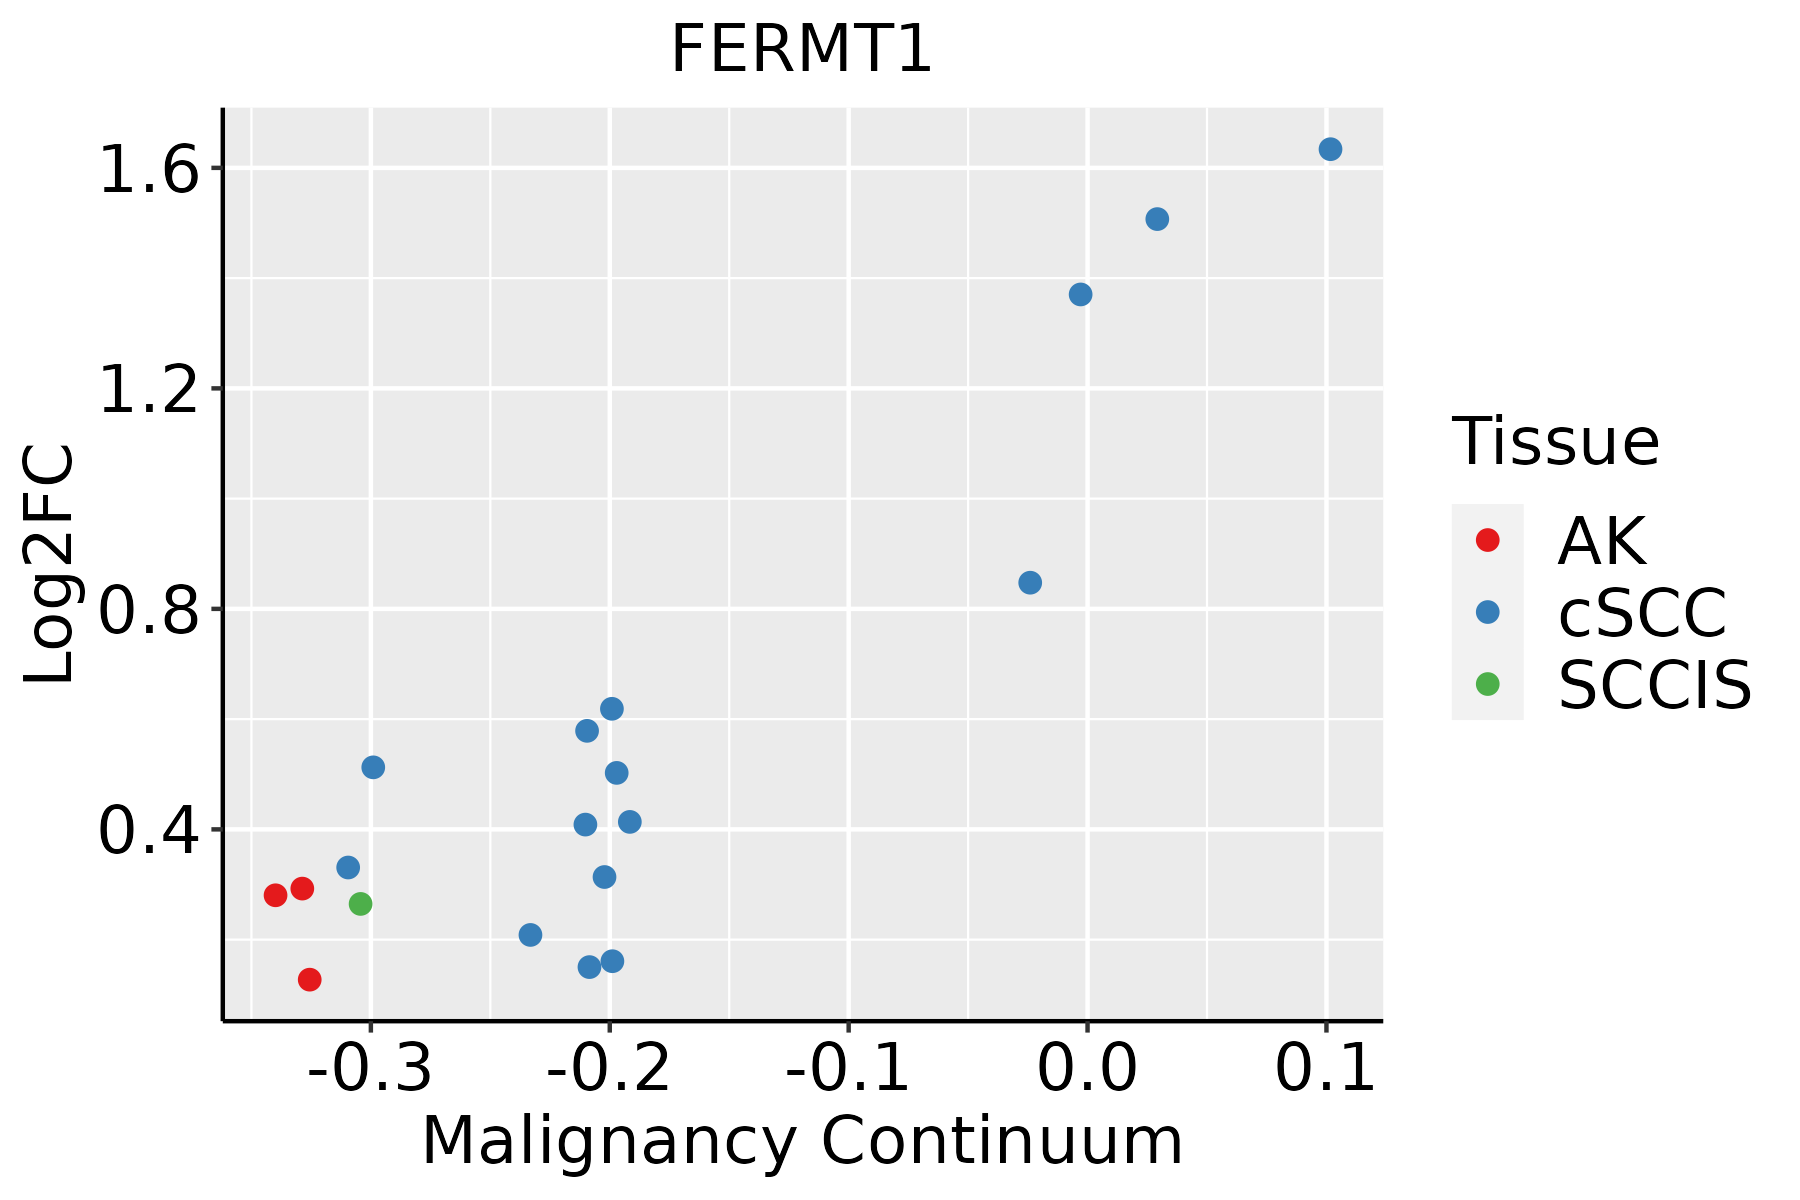 | AK: Actinic keratosis |
| cSCC: Cutaneous squamous cell carcinoma |
| SCCIS:squamous cell carcinoma in situ |
| GO ID | Tissue | Disease Stage | Description | Gene Ratio | Bg Ratio | pvalue | p.adjust | Count |
| GO:1903034110 | Skin | SCCIS | regulation of response to wounding | 22/919 | 167/18723 | 2.36e-05 | 6.65e-04 | 22 |
| GO:00301985 | Skin | SCCIS | extracellular matrix organization | 32/919 | 301/18723 | 3.46e-05 | 9.17e-04 | 32 |
| GO:00430625 | Skin | SCCIS | extracellular structure organization | 32/919 | 302/18723 | 3.69e-05 | 9.65e-04 | 32 |
| GO:00452295 | Skin | SCCIS | external encapsulating structure organization | 32/919 | 304/18723 | 4.20e-05 | 1.06e-03 | 32 |
| GO:009030316 | Skin | SCCIS | positive regulation of wound healing | 11/919 | 59/18723 | 1.21e-04 | 2.52e-03 | 11 |
| GO:003017814 | Skin | SCCIS | negative regulation of Wnt signaling pathway | 20/919 | 170/18723 | 2.62e-04 | 4.71e-03 | 20 |
| GO:0010811111 | Skin | SCCIS | positive regulation of cell-substrate adhesion | 16/919 | 123/18723 | 3.41e-04 | 5.86e-03 | 16 |
| GO:009009013 | Skin | SCCIS | negative regulation of canonical Wnt signaling pathway | 17/919 | 137/18723 | 3.97e-04 | 6.58e-03 | 17 |
| GO:0001954110 | Skin | SCCIS | positive regulation of cell-matrix adhesion | 10/919 | 58/18723 | 4.72e-04 | 7.47e-03 | 10 |
| GO:190303618 | Skin | SCCIS | positive regulation of response to wounding | 11/919 | 72/18723 | 7.28e-04 | 1.03e-02 | 11 |
| GO:004230311 | Skin | SCCIS | molting cycle | 14/919 | 107/18723 | 7.39e-04 | 1.03e-02 | 14 |
| GO:004263311 | Skin | SCCIS | hair cycle | 14/919 | 107/18723 | 7.39e-04 | 1.03e-02 | 14 |
| GO:00987731 | Skin | SCCIS | skin epidermis development | 12/919 | 85/18723 | 8.79e-04 | 1.14e-02 | 12 |
| GO:0006913111 | Skin | SCCIS | nucleocytoplasmic transport | 28/919 | 301/18723 | 9.23e-04 | 1.18e-02 | 28 |
| GO:0051169111 | Skin | SCCIS | nuclear transport | 28/919 | 301/18723 | 9.23e-04 | 1.18e-02 | 28 |
| GO:1900181 | Skin | SCCIS | negative regulation of protein localization to nucleus | 7/919 | 33/18723 | 9.34e-04 | 1.19e-02 | 7 |
| GO:004361613 | Skin | SCCIS | keratinocyte proliferation | 8/919 | 46/18723 | 1.62e-03 | 1.80e-02 | 8 |
| GO:000181918 | Skin | SCCIS | positive regulation of cytokine production | 38/919 | 467/18723 | 1.63e-03 | 1.81e-02 | 38 |
| GO:0072594111 | Skin | SCCIS | establishment of protein localization to organelle | 35/919 | 422/18723 | 1.77e-03 | 1.90e-02 | 35 |
| GO:190382814 | Skin | SCCIS | negative regulation of cellular protein localization | 14/919 | 117/18723 | 1.78e-03 | 1.91e-02 | 14 |
| Hugo Symbol | Variant Class | Variant Classification | dbSNP RS | HGVSc | HGVSp | HGVSp Short | SWISSPROT | BIOTYPE | SIFT | PolyPhen | Tumor Sample Barcode | Tissue | Histology | Sex | Age | Stage | Therapy Types | Drugs | Outcome |
| FERMT1 | SNV | Missense_Mutation | | c.1870N>A | p.Glu624Lys | p.E624K | Q9BQL6 | protein_coding | deleterious(0.01) | possibly_damaging(0.833) | TCGA-A8-A09I-01 | Breast | breast invasive carcinoma | Female | >=65 | I/II | Hormone Therapy | anastrozole | SD |
| FERMT1 | SNV | Missense_Mutation | | c.447G>C | p.Lys149Asn | p.K149N | Q9BQL6 | protein_coding | tolerated(0.22) | probably_damaging(0.983) | TCGA-AC-A23H-01 | Breast | breast invasive carcinoma | Female | >=65 | I/II | Unknown | Unknown | PD |
| FERMT1 | SNV | Missense_Mutation | | c.70G>C | p.Glu24Gln | p.E24Q | Q9BQL6 | protein_coding | tolerated(0.18) | benign(0.101) | TCGA-AC-A23H-01 | Breast | breast invasive carcinoma | Female | >=65 | I/II | Unknown | Unknown | PD |
| FERMT1 | SNV | Missense_Mutation | | c.509N>A | p.Ser170Tyr | p.S170Y | Q9BQL6 | protein_coding | tolerated(0.23) | possibly_damaging(0.703) | TCGA-AN-A046-01 | Breast | breast invasive carcinoma | Female | >=65 | I/II | Unknown | Unknown | SD |
| FERMT1 | SNV | Missense_Mutation | | c.2028N>T | p.Gln676His | p.Q676H | Q9BQL6 | protein_coding | tolerated(0.94) | possibly_damaging(0.732) | TCGA-AN-A0AK-01 | Breast | breast invasive carcinoma | Female | >=65 | I/II | Unknown | Unknown | SD |
| FERMT1 | SNV | Missense_Mutation | | c.1024G>A | p.Glu342Lys | p.E342K | Q9BQL6 | protein_coding | deleterious(0.01) | benign(0.232) | TCGA-AO-A0JC-01 | Breast | breast invasive carcinoma | Female | <65 | I/II | Chemotherapy | fluorouracil | SD |
| FERMT1 | SNV | Missense_Mutation | novel | c.757T>C | p.Ser253Pro | p.S253P | Q9BQL6 | protein_coding | deleterious(0.01) | probably_damaging(1) | TCGA-AO-A0JD-01 | Breast | breast invasive carcinoma | Female | <65 | III/IV | Chemotherapy | cyclophosphamide | SD |
| FERMT1 | SNV | Missense_Mutation | rs143876620 | c.1603N>T | p.Arg535Trp | p.R535W | Q9BQL6 | protein_coding | deleterious(0) | probably_damaging(0.98) | TCGA-2W-A8YY-01 | Cervix | cervical & endocervical cancer | Female | <65 | I/II | Chemotherapy | cisplatin | CR |
| FERMT1 | SNV | Missense_Mutation | novel | c.790N>A | p.Glu264Lys | p.E264K | Q9BQL6 | protein_coding | deleterious(0.02) | probably_damaging(0.976) | TCGA-MY-A5BF-01 | Cervix | cervical & endocervical cancer | Female | >=65 | I/II | Chemotherapy | cisplatin | CR |
| FERMT1 | SNV | Missense_Mutation | | c.1258N>A | p.Leu420Ile | p.L420I | Q9BQL6 | protein_coding | deleterious(0.03) | benign(0.236) | TCGA-AA-3977-01 | Colorectum | colon adenocarcinoma | Male | >=65 | I/II | Unknown | Unknown | SD |


