| Tissue | Expression Dynamics | Abbreviation |
| Breast | 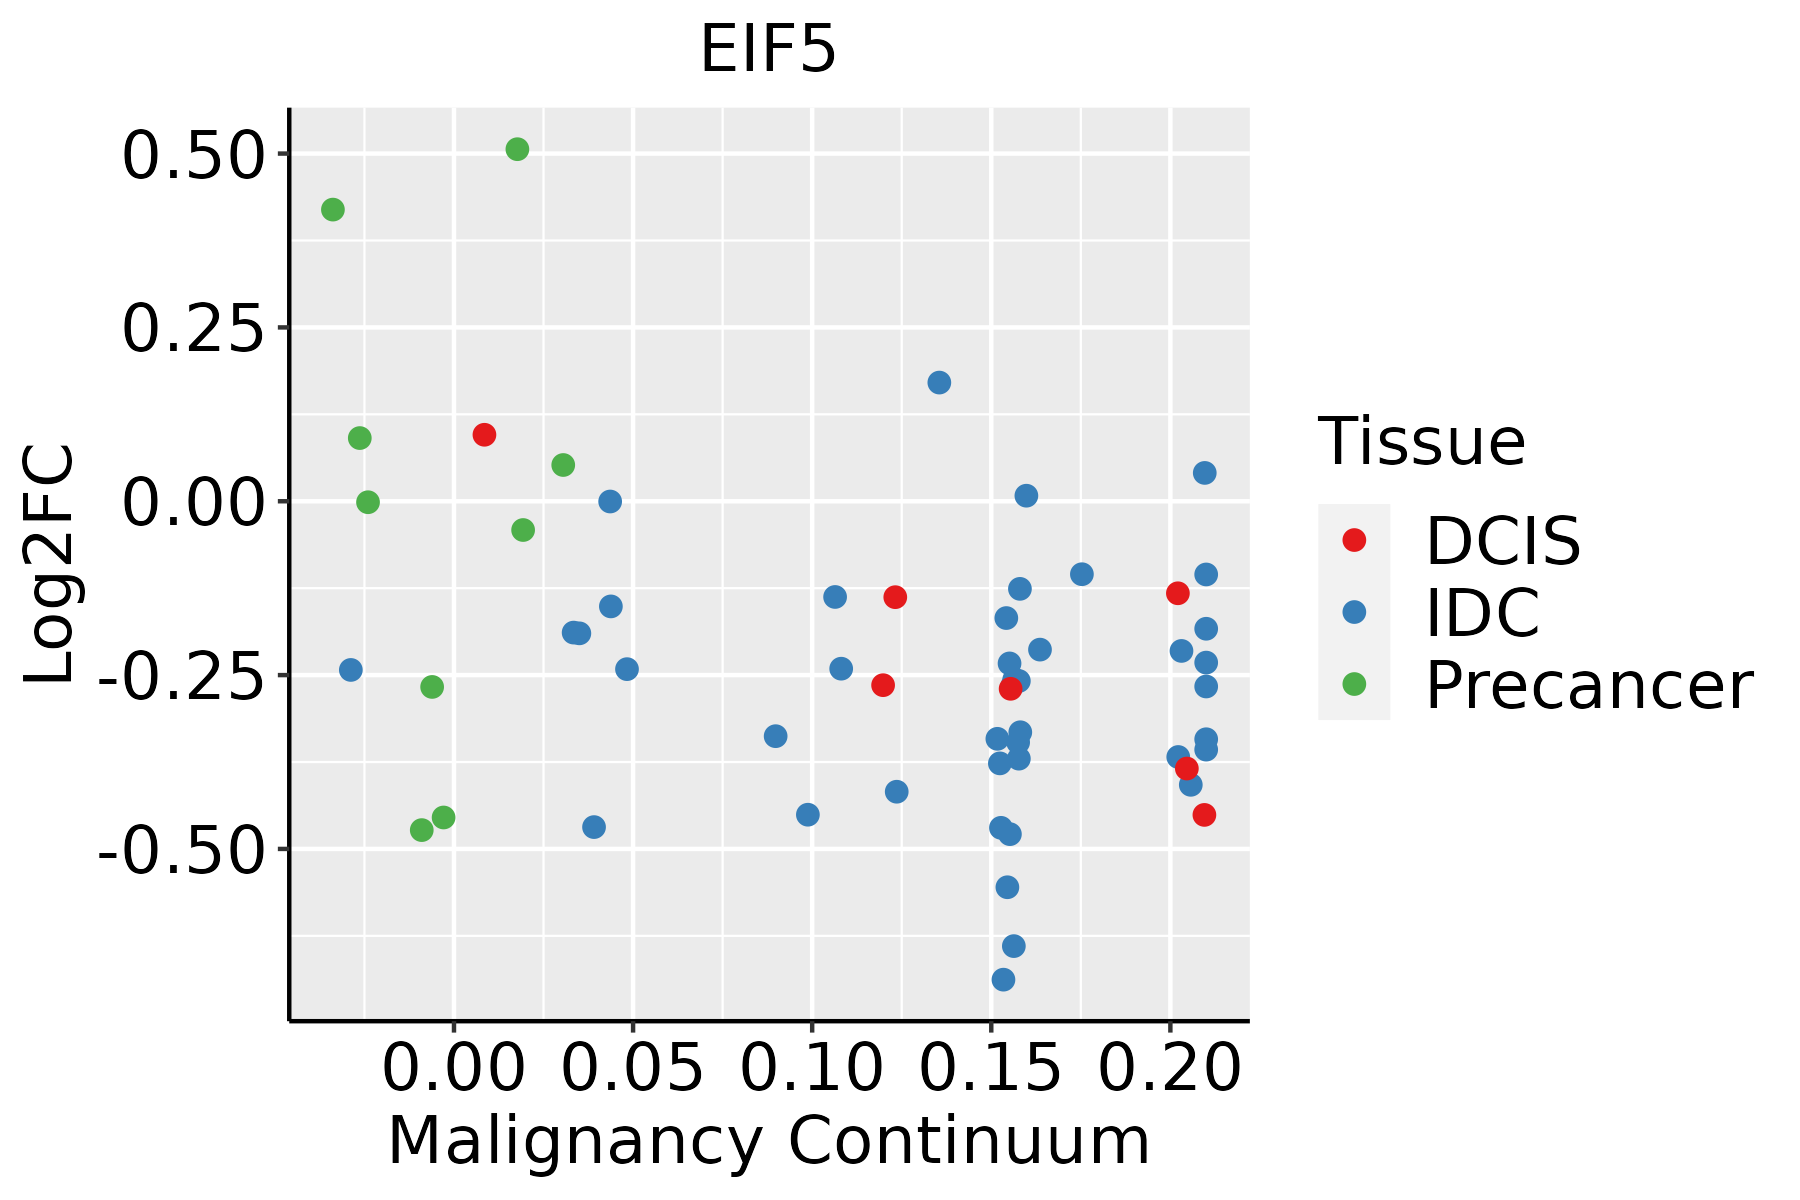 | IDC: Invasive ductal carcinoma |
| DCIS: Ductal carcinoma in situ |
| Precancer(BRCA1-mut): Precancerous lesion from BRCA1 mutation carriers |
| Cervix | 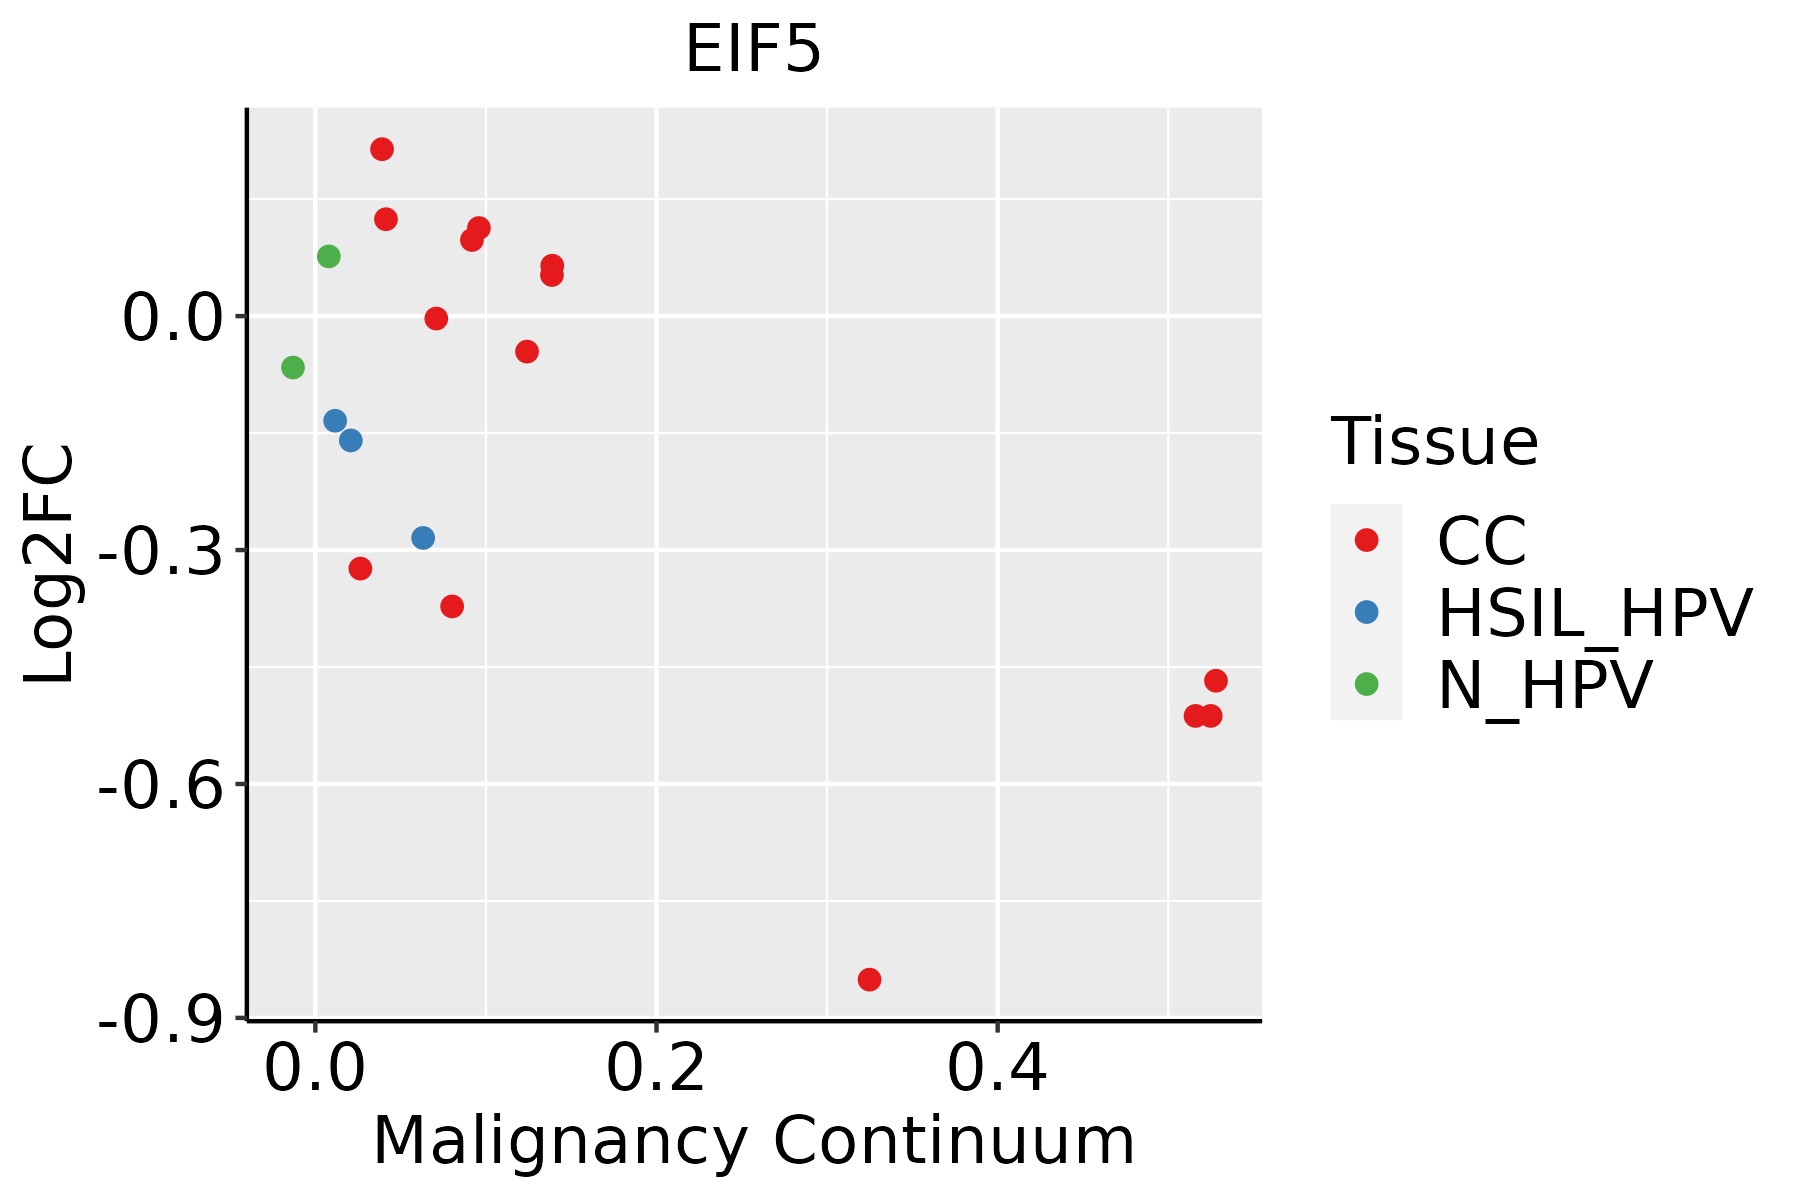 | CC: Cervix cancer |
| HSIL_HPV: HPV-infected high-grade squamous intraepithelial lesions |
| N_HPV: HPV-infected normal cervix |
| Colorectum (GSE201348) |  | FAP: Familial adenomatous polyposis |
| CRC: Colorectal cancer |
| Colorectum (HTA11) | 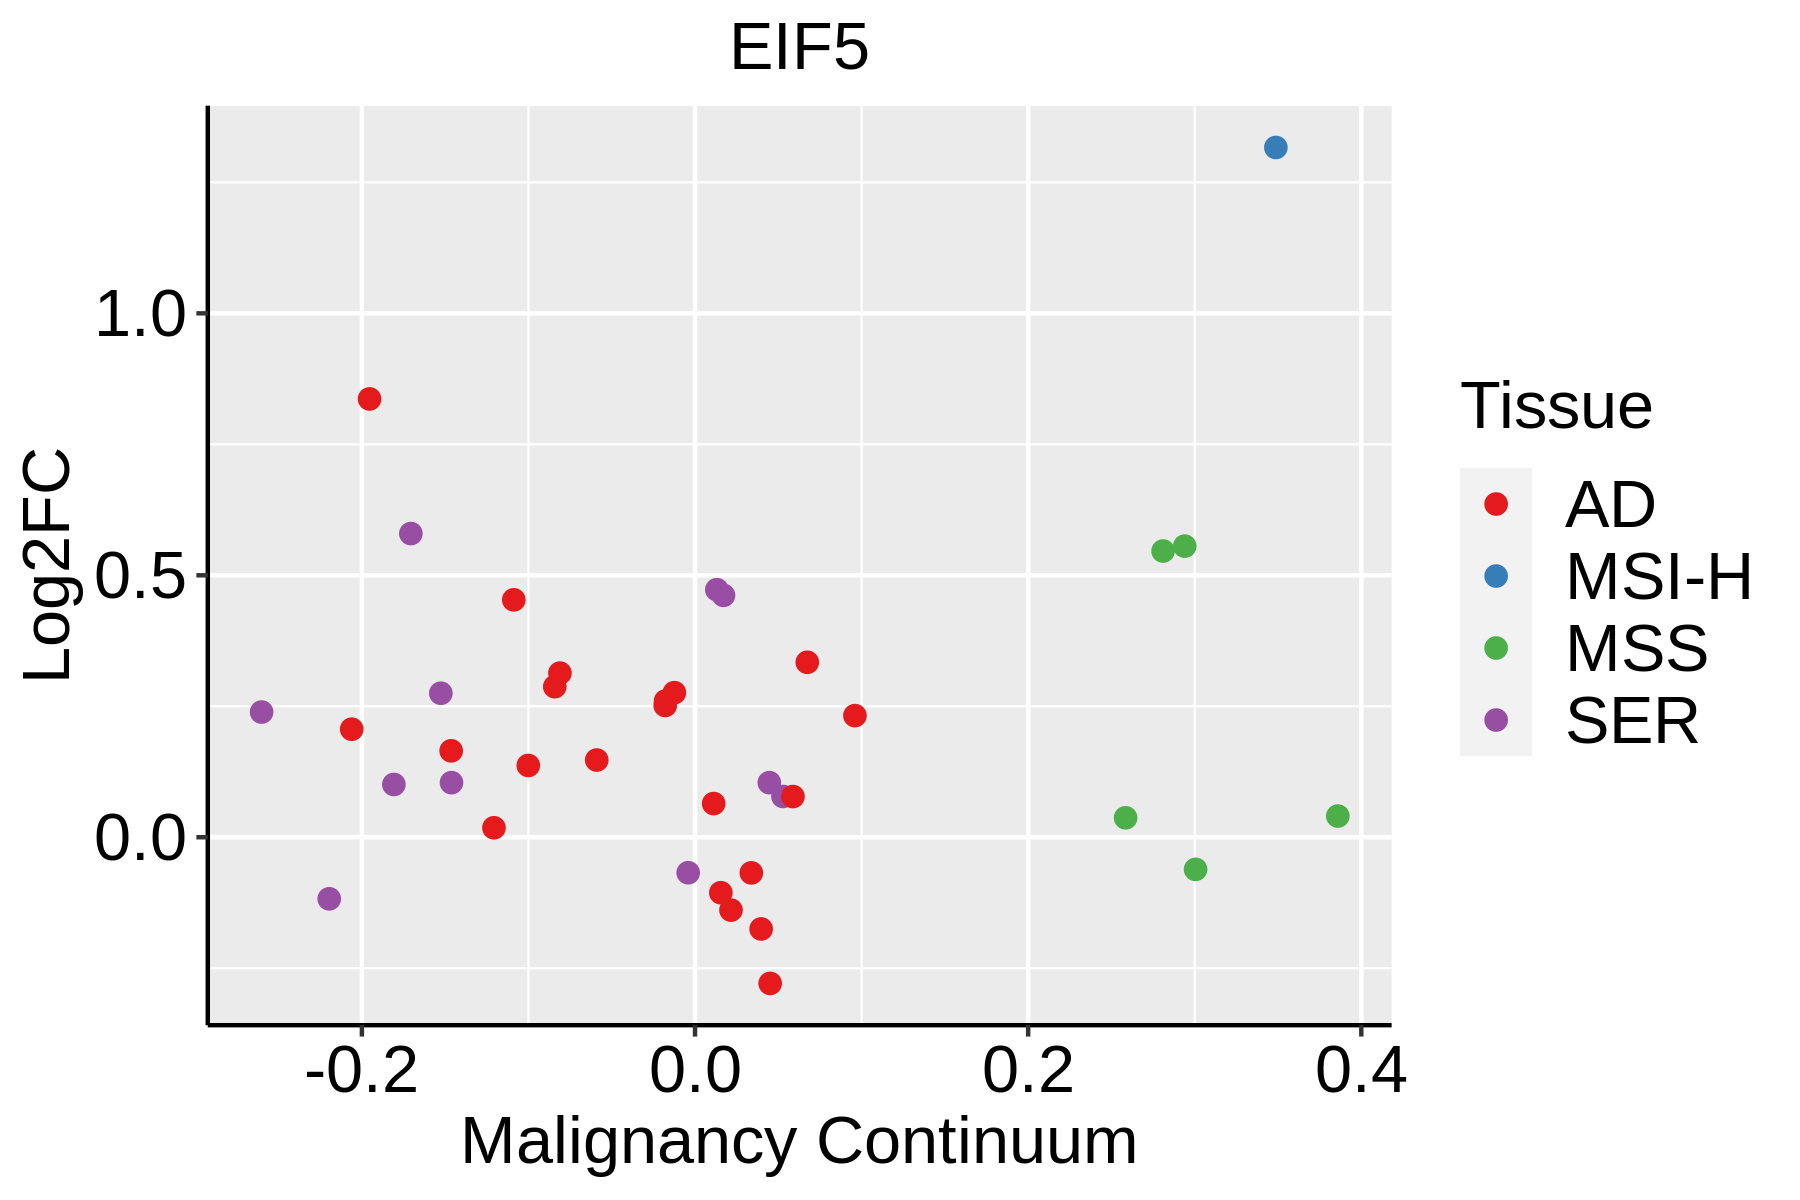 | AD: Adenomas |
| SER: Sessile serrated lesions |
| MSI-H: Microsatellite-high colorectal cancer |
| MSS: Microsatellite stable colorectal cancer |
| Endometrium |  | AEH: Atypical endometrial hyperplasia |
| EEC: Endometrioid Cancer |
| Esophagus | 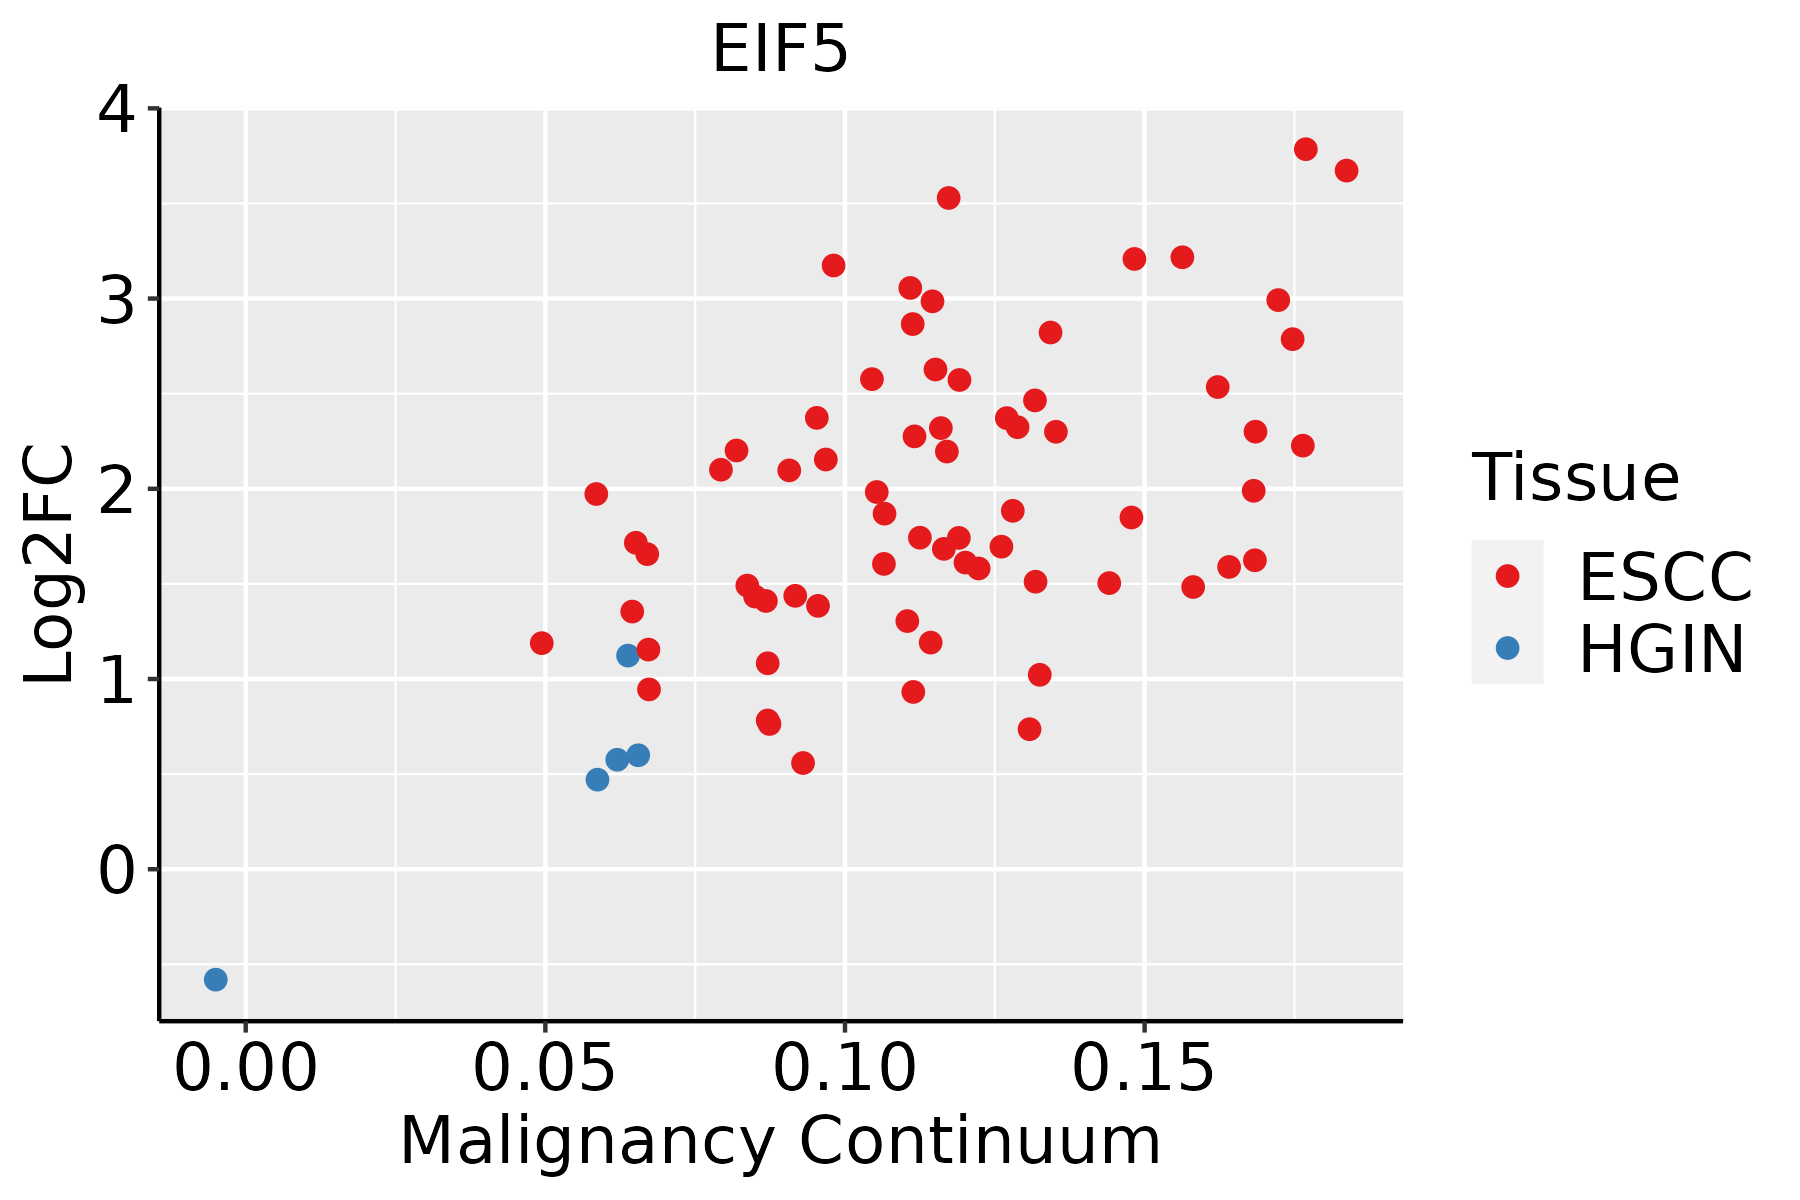 | ESCC: Esophageal squamous cell carcinoma |
| HGIN: High-grade intraepithelial neoplasias |
| LGIN: Low-grade intraepithelial neoplasias |
| Liver |  | HCC: Hepatocellular carcinoma |
| NAFLD: Non-alcoholic fatty liver disease |
| Lung | 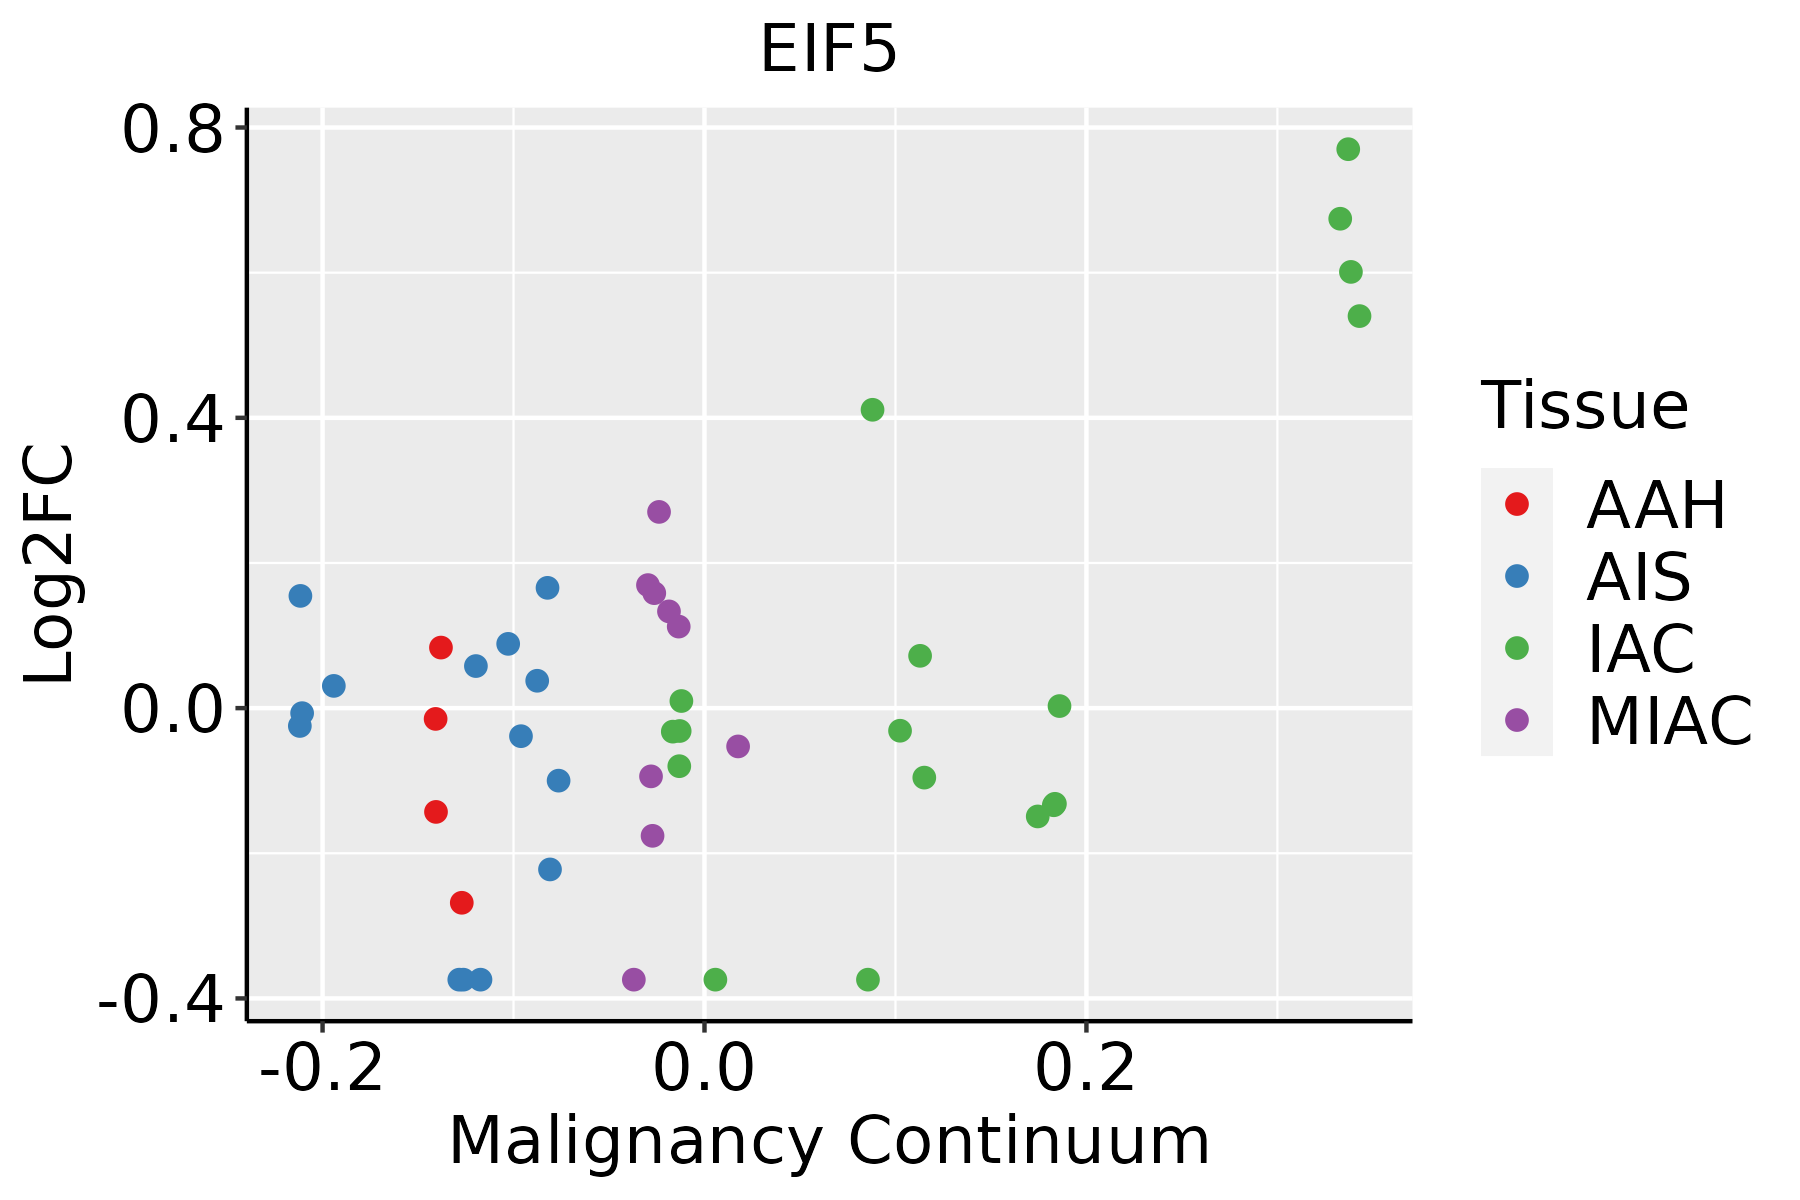 | AAH: Atypical adenomatous hyperplasia |
| AIS: Adenocarcinoma in situ |
| IAC: Invasive lung adenocarcinoma |
| MIA: Minimally invasive adenocarcinoma |
| Oral Cavity |  | EOLP: Erosive Oral lichen planus |
| LP: leukoplakia |
| NEOLP: Non-erosive oral lichen planus |
| OSCC: Oral squamous cell carcinoma |
| Prostate | 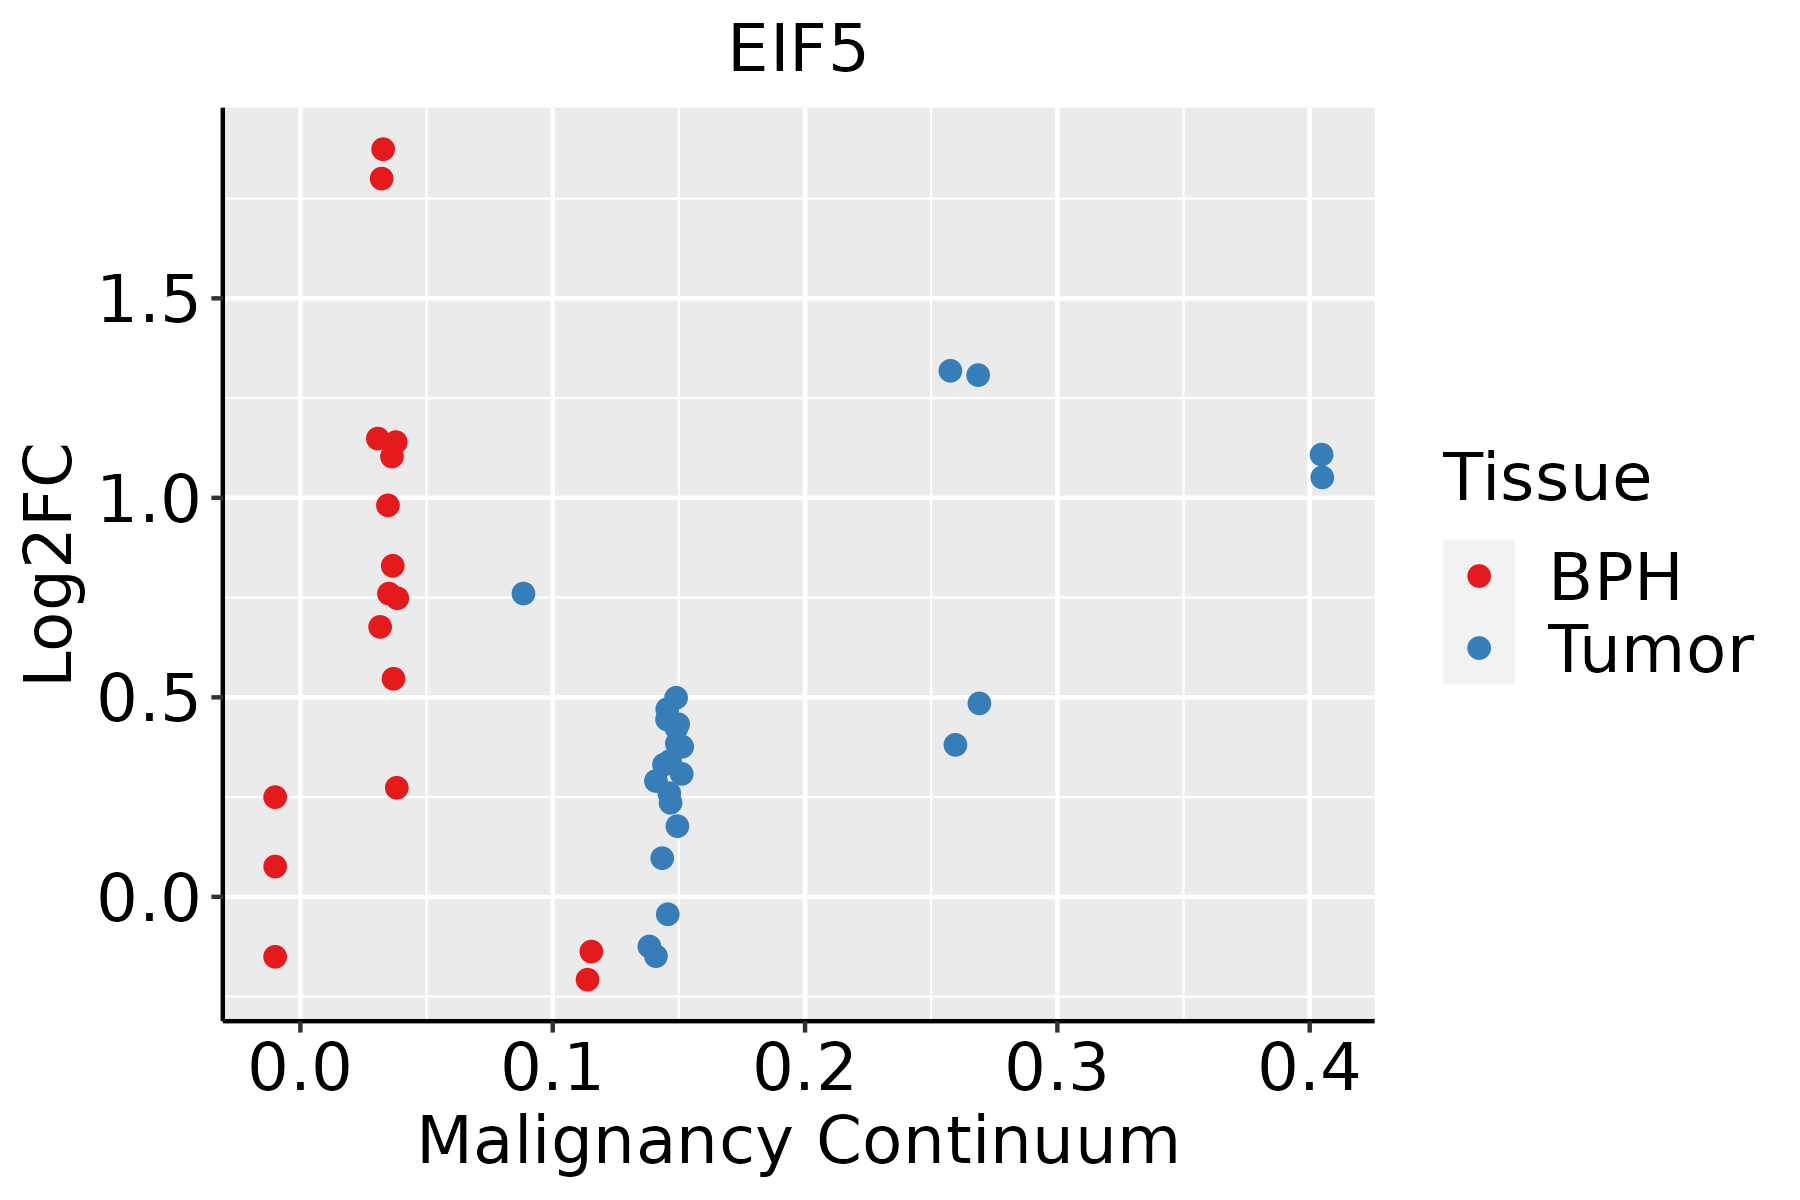 | BPH: Benign Prostatic Hyperplasia |
| Skin | 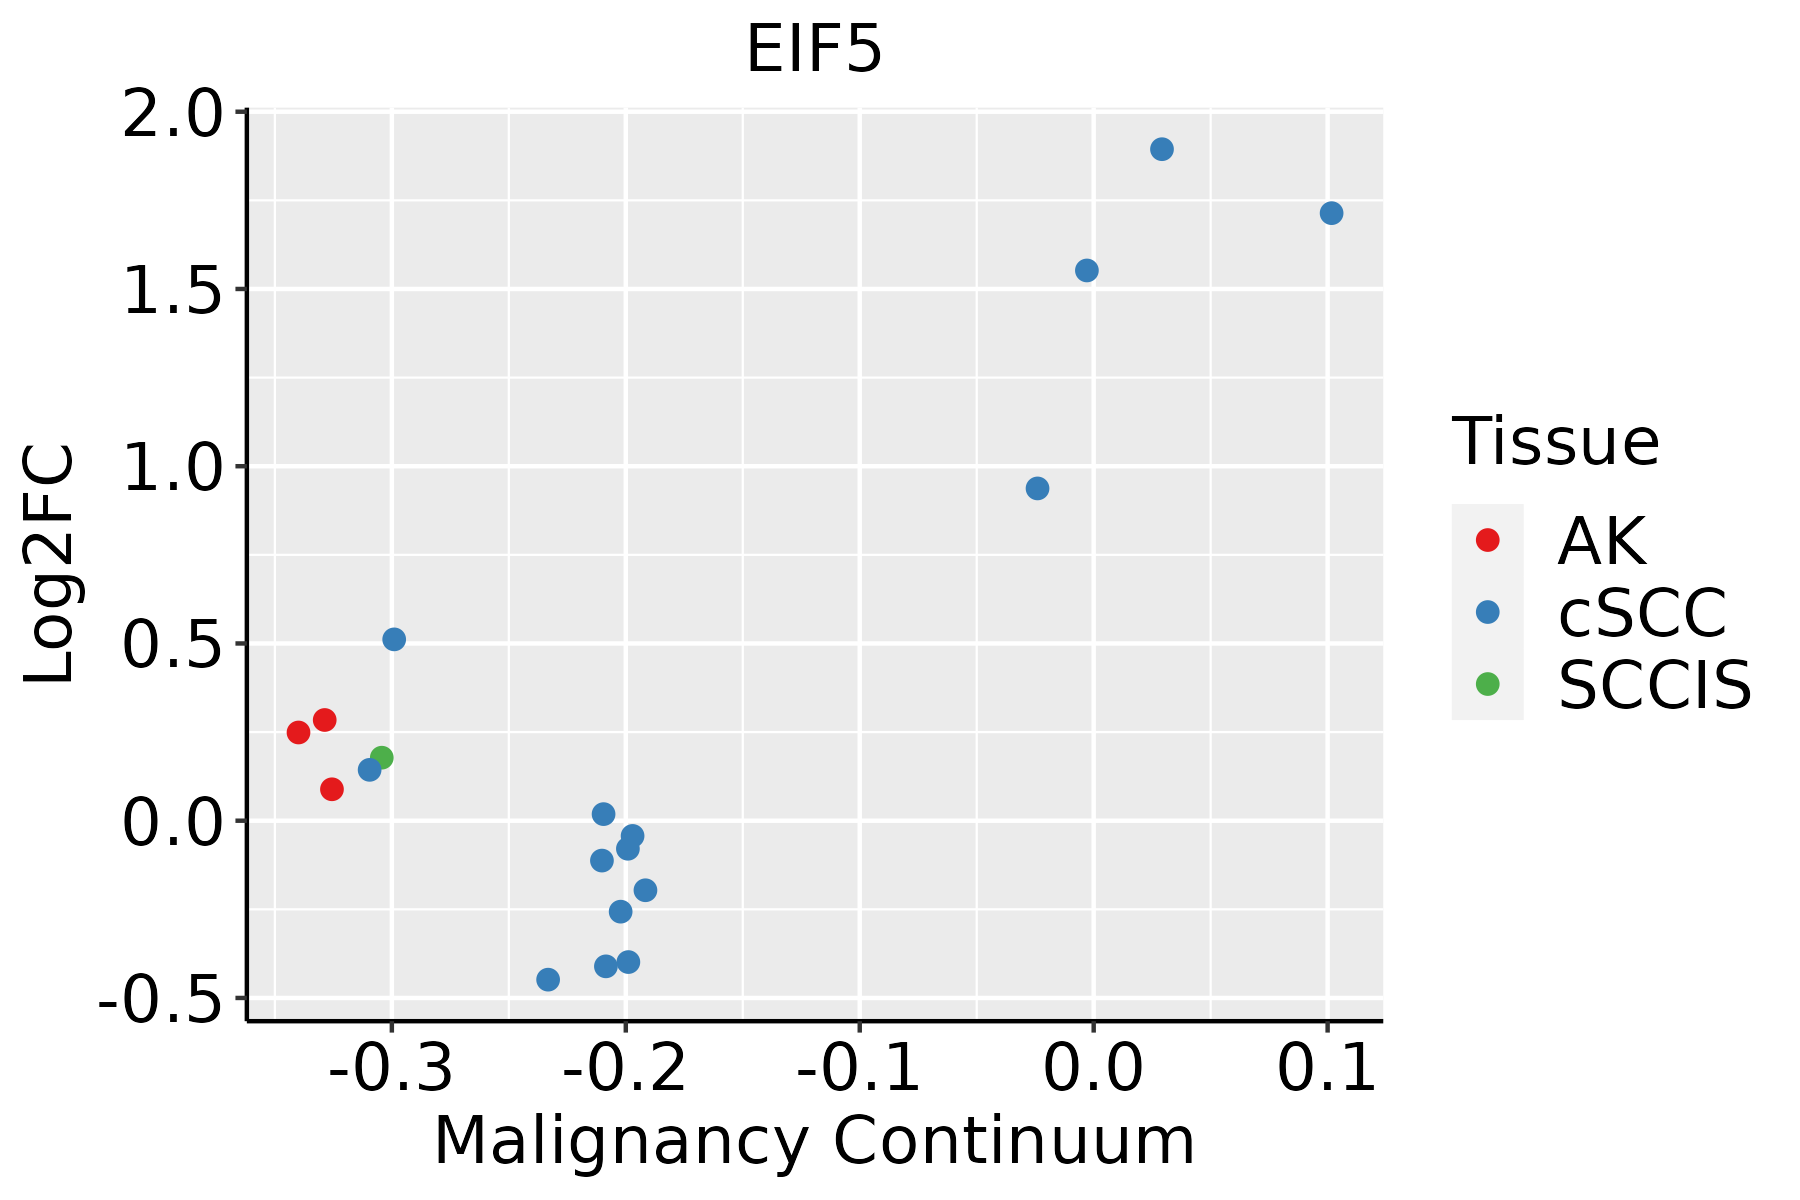 | AK: Actinic keratosis |
| cSCC: Cutaneous squamous cell carcinoma |
| SCCIS:squamous cell carcinoma in situ |
| Thyroid | 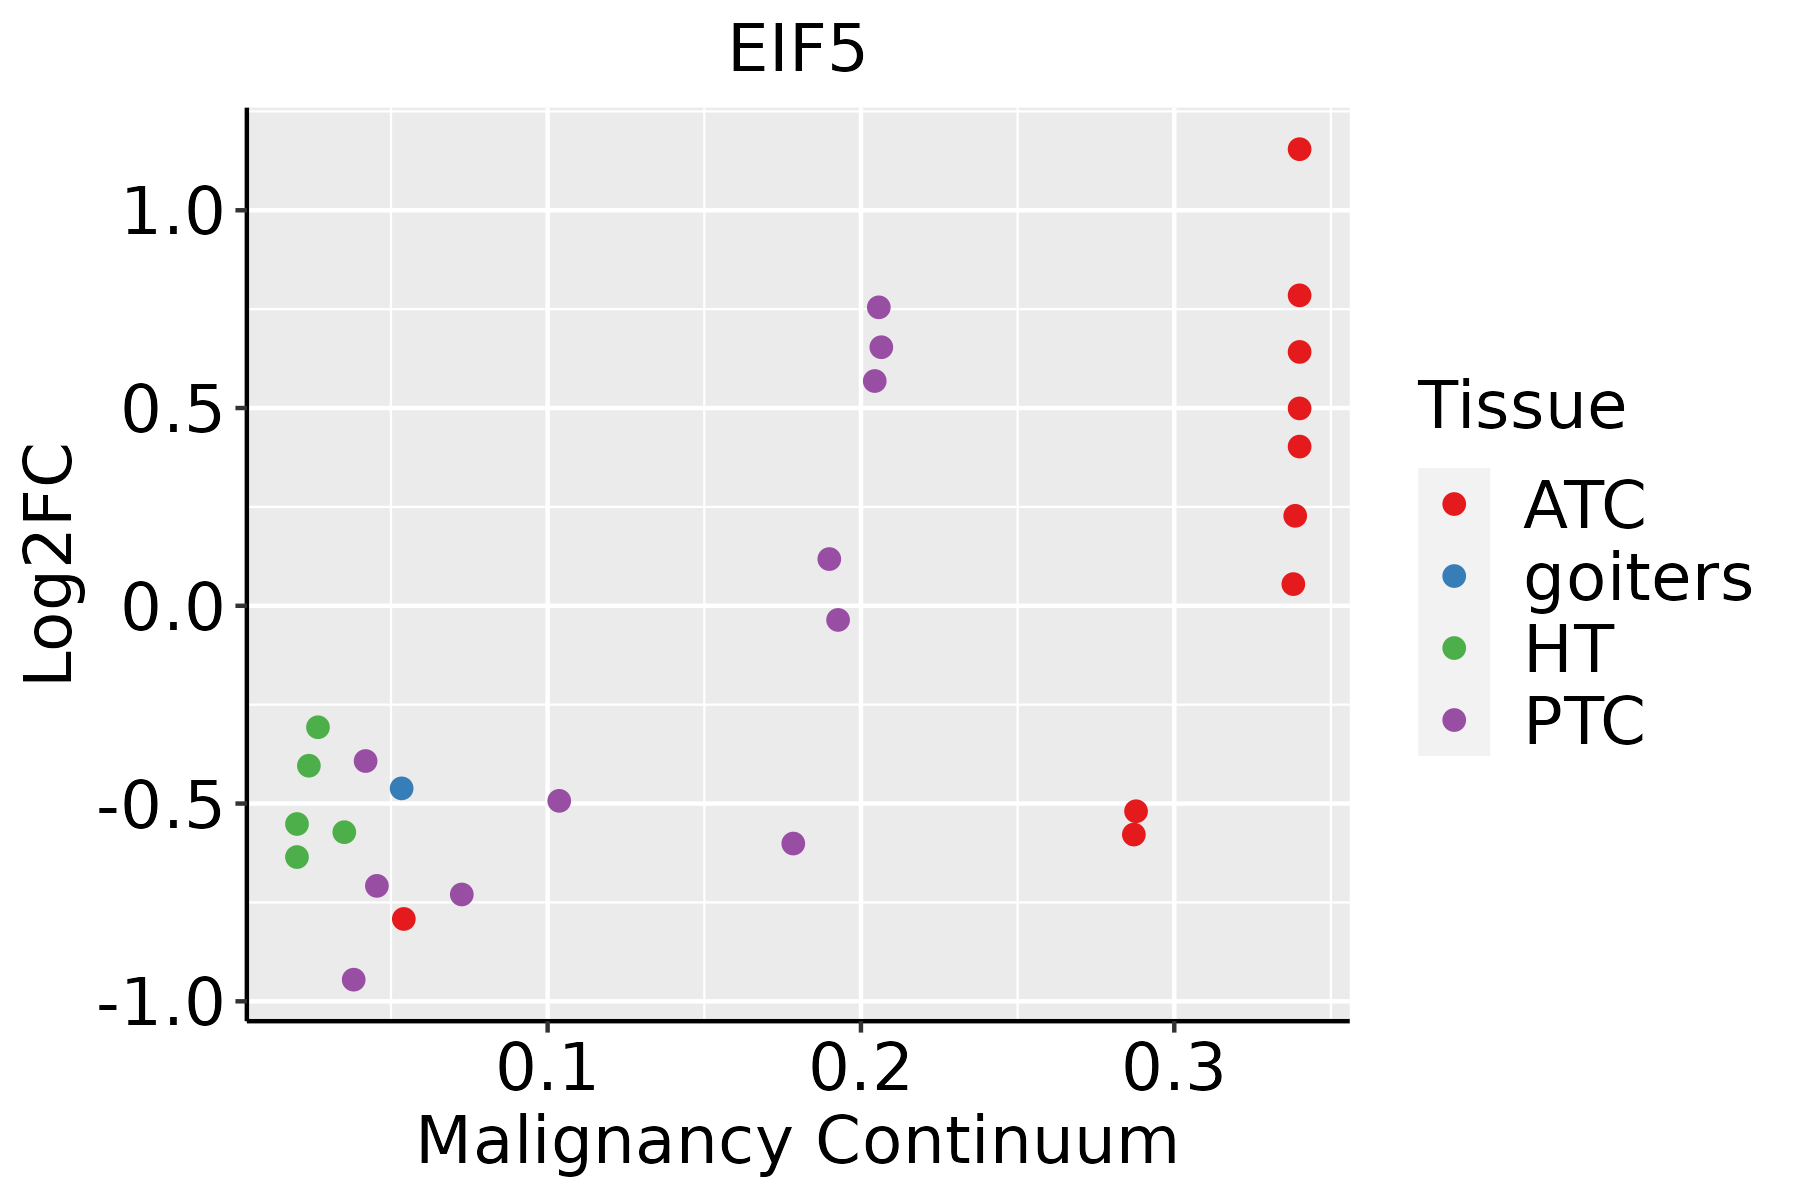 | ATC: Anaplastic thyroid cancer |
| HT: Hashimoto's thyroiditis |
| PTC: Papillary thyroid cancer |
| GO ID | Tissue | Disease Stage | Description | Gene Ratio | Bg Ratio | pvalue | p.adjust | Count |
| GO:004572721 | Stomach | CSG | positive regulation of translation | 22/1034 | 136/18723 | 5.27e-06 | 2.03e-04 | 22 |
| GO:003425021 | Stomach | CSG | positive regulation of cellular amide metabolic process | 23/1034 | 162/18723 | 2.92e-05 | 8.26e-04 | 23 |
| GO:00713562 | Stomach | CSG | cellular response to tumor necrosis factor | 28/1034 | 229/18723 | 6.78e-05 | 1.65e-03 | 28 |
| GO:00332092 | Stomach | CSG | tumor necrosis factor-mediated signaling pathway | 16/1034 | 99/18723 | 9.96e-05 | 2.22e-03 | 16 |
| GO:00346122 | Stomach | CSG | response to tumor necrosis factor | 29/1034 | 253/18723 | 1.61e-04 | 3.20e-03 | 29 |
| GO:007233221 | Stomach | CSG | intrinsic apoptotic signaling pathway by p53 class mediator | 13/1034 | 76/18723 | 2.45e-04 | 4.49e-03 | 13 |
| GO:00096152 | Stomach | CSG | response to virus | 36/1034 | 367/18723 | 6.16e-04 | 8.96e-03 | 36 |
| GO:000641721 | Stomach | CSG | regulation of translation | 43/1034 | 468/18723 | 7.58e-04 | 1.04e-02 | 43 |
| GO:200123521 | Stomach | CSG | positive regulation of apoptotic signaling pathway | 16/1034 | 126/18723 | 1.56e-03 | 1.75e-02 | 16 |
| GO:190179621 | Stomach | CSG | regulation of signal transduction by p53 class mediator | 13/1034 | 93/18723 | 1.76e-03 | 1.90e-02 | 13 |
| GO:002241111 | Stomach | CSG | cellular component disassembly | 38/1034 | 443/18723 | 4.84e-03 | 4.04e-02 | 38 |
| GO:0098586 | Stomach | CSG | cellular response to virus | 11/1034 | 84/18723 | 6.37e-03 | 4.92e-02 | 11 |
| GO:009719331 | Stomach | CAG | intrinsic apoptotic signaling pathway | 31/552 | 288/18723 | 5.37e-10 | 1.47e-07 | 31 |
| GO:200124231 | Stomach | CAG | regulation of intrinsic apoptotic signaling pathway | 23/552 | 164/18723 | 5.59e-10 | 1.47e-07 | 23 |
| GO:200123331 | Stomach | CAG | regulation of apoptotic signaling pathway | 34/552 | 356/18723 | 1.85e-09 | 3.66e-07 | 34 |
| GO:004572731 | Stomach | CAG | positive regulation of translation | 16/552 | 136/18723 | 2.62e-06 | 1.38e-04 | 16 |
| GO:003425031 | Stomach | CAG | positive regulation of cellular amide metabolic process | 17/552 | 162/18723 | 6.20e-06 | 2.75e-04 | 17 |
| GO:00713563 | Stomach | CAG | cellular response to tumor necrosis factor | 19/552 | 229/18723 | 5.18e-05 | 1.55e-03 | 19 |
| GO:00346123 | Stomach | CAG | response to tumor necrosis factor | 20/552 | 253/18723 | 6.54e-05 | 1.85e-03 | 20 |
| GO:007233131 | Stomach | CAG | signal transduction by p53 class mediator | 15/552 | 163/18723 | 9.93e-05 | 2.62e-03 | 15 |
| Hugo Symbol | Variant Class | Variant Classification | dbSNP RS | HGVSc | HGVSp | HGVSp Short | SWISSPROT | BIOTYPE | SIFT | PolyPhen | Tumor Sample Barcode | Tissue | Histology | Sex | Age | Stage | Therapy Types | Drugs | Outcome |
| EIF5 | SNV | Missense_Mutation | | c.39C>G | p.Phe13Leu | p.F13L | P55010 | protein_coding | deleterious(0.03) | possibly_damaging(0.558) | TCGA-A2-A0YL-01 | Breast | breast invasive carcinoma | Female | <65 | III/IV | Chemotherapy | cytoxan | SD |
| EIF5 | SNV | Missense_Mutation | | c.238C>T | p.His80Tyr | p.H80Y | P55010 | protein_coding | deleterious(0) | benign(0.277) | TCGA-A2-A0YL-01 | Breast | breast invasive carcinoma | Female | <65 | III/IV | Chemotherapy | cytoxan | SD |
| EIF5 | SNV | Missense_Mutation | rs779336285 | c.124G>A | p.Val42Ile | p.V42I | P55010 | protein_coding | tolerated(0.55) | benign(0.013) | TCGA-D8-A1JD-01 | Breast | breast invasive carcinoma | Female | <65 | I/II | Chemotherapy | adriamycin | SD |
| EIF5 | SNV | Missense_Mutation | | c.33N>G | p.Asp11Glu | p.D11E | P55010 | protein_coding | deleterious(0) | possibly_damaging(0.87) | TCGA-E2-A14O-01 | Breast | breast invasive carcinoma | Female | >=65 | III/IV | Hormone Therapy | arimidex | SD |
| EIF5 | insertion | In_Frame_Ins | novel | c.321_322insTGTCTTGCAGCTTATTCGCCTCAT | p.Thr107_Asp108insCysLeuAlaAlaTyrSerProHis | p.T107_D108insCLAAYSPH | P55010 | protein_coding | | | TCGA-A7-A0CE-01 | Breast | breast invasive carcinoma | Female | <65 | I/II | Chemotherapy | adriamycin | SD |
| EIF5 | insertion | Nonsense_Mutation | novel | c.507_508insCGAGGTCAGGAGTTCTAGACCAGCCTAGCCAACAT | p.Asn170ArgfsTer6 | p.N170Rfs*6 | P55010 | protein_coding | | | TCGA-A8-A09W-01 | Breast | breast invasive carcinoma | Female | >=65 | III/IV | Unknown | Unknown | SD |
| EIF5 | insertion | Nonsense_Mutation | novel | c.311_312insCGTCTGATTGCCAAGGTAATAAACTGCTCTTCAATTTAGT | p.Pro105ValfsTer2 | p.P105Vfs*2 | P55010 | protein_coding | | | TCGA-A8-A09X-01 | Breast | breast invasive carcinoma | Female | <65 | III/IV | Unknown | Unknown | SD |
| EIF5 | SNV | Missense_Mutation | novel | c.1204N>A | p.Glu402Lys | p.E402K | P55010 | protein_coding | deleterious(0.02) | benign(0.173) | TCGA-C5-A1MN-01 | Cervix | cervical & endocervical cancer | Female | <65 | III/IV | Chemotherapy | cisplatin | SD |
| EIF5 | SNV | Missense_Mutation | novel | c.89N>G | p.Asn30Ser | p.N30S | P55010 | protein_coding | deleterious(0) | probably_damaging(0.946) | TCGA-MA-AA3Z-01 | Cervix | cervical & endocervical cancer | Female | <65 | I/II | Unknown | Unknown | SD |
| EIF5 | SNV | Missense_Mutation | novel | c.173N>T | p.Gly58Val | p.G58V | P55010 | protein_coding | deleterious(0) | benign(0.267) | TCGA-VS-A9V5-01 | Cervix | cervical & endocervical cancer | Female | <65 | I/II | Chemotherapy | carboplatin | PD |


