
|
|||||
|
 | |
| |
| |
| |
| |
| |
|
Gene: PTGES |
Gene summary for PTGES |
| Gene information | Species | Human | Gene symbol | PTGES | Gene ID | 9536 |
| Gene name | prostaglandin E synthase | |
| Gene Alias | MGST-IV | |
| Cytomap | 9q34.11 | |
| Gene Type | protein-coding | GO ID | GO:0001516 | UniProtAcc | O14684 |
Top |
Malignant transformation analysis |
| Identification of the aberrant gene expression in precancerous and cancerous lesions by comparing the gene expression of stem-like cells in diseased tissues with normal stem cells |
| Entrez ID | Symbol | Replicates | Species | Organ | Tissue | Adj P-value | Log2FC | Malignancy |
| 9536 | PTGES | LZE8T | Human | Esophagus | ESCC | 1.39e-02 | 2.31e-01 | 0.067 |
| 9536 | PTGES | LZE20T | Human | Esophagus | ESCC | 4.35e-12 | 9.43e-01 | 0.0662 |
| 9536 | PTGES | LZE22T | Human | Esophagus | ESCC | 7.45e-04 | 6.20e-01 | 0.068 |
| 9536 | PTGES | LZE24D1 | Human | Esophagus | HGIN | 1.13e-02 | 1.06e+00 | 0.054 |
| 9536 | PTGES | LZE24T | Human | Esophagus | ESCC | 1.44e-04 | 5.23e-01 | 0.0596 |
| 9536 | PTGES | LZE21T | Human | Esophagus | ESCC | 5.87e-03 | 2.90e-01 | 0.0655 |
| 9536 | PTGES | LZE6T | Human | Esophagus | ESCC | 1.46e-11 | 1.75e+00 | 0.0845 |
| 9536 | PTGES | P1T-E | Human | Esophagus | ESCC | 1.79e-06 | 1.24e+00 | 0.0875 |
| 9536 | PTGES | P2T-E | Human | Esophagus | ESCC | 5.31e-23 | 6.63e-01 | 0.1177 |
| 9536 | PTGES | P4T-E | Human | Esophagus | ESCC | 5.86e-12 | 5.34e-01 | 0.1323 |
| 9536 | PTGES | P8T-E | Human | Esophagus | ESCC | 1.85e-32 | 1.21e+00 | 0.0889 |
| 9536 | PTGES | P11T-E | Human | Esophagus | ESCC | 1.08e-12 | 1.20e+00 | 0.1426 |
| 9536 | PTGES | P15T-E | Human | Esophagus | ESCC | 1.69e-05 | 4.01e-01 | 0.1149 |
| 9536 | PTGES | P17T-E | Human | Esophagus | ESCC | 6.20e-08 | 6.62e-01 | 0.1278 |
| 9536 | PTGES | P21T-E | Human | Esophagus | ESCC | 1.45e-22 | 6.97e-01 | 0.1617 |
| 9536 | PTGES | P22T-E | Human | Esophagus | ESCC | 7.63e-11 | 2.53e-01 | 0.1236 |
| 9536 | PTGES | P23T-E | Human | Esophagus | ESCC | 1.27e-18 | 1.47e+00 | 0.108 |
| 9536 | PTGES | P24T-E | Human | Esophagus | ESCC | 1.52e-18 | 8.49e-01 | 0.1287 |
| 9536 | PTGES | P26T-E | Human | Esophagus | ESCC | 9.26e-13 | 5.03e-01 | 0.1276 |
| 9536 | PTGES | P27T-E | Human | Esophagus | ESCC | 8.02e-03 | 1.12e-01 | 0.1055 |
| Page: 1 2 3 4 |
| Tissue | Expression Dynamics | Abbreviation |
| Esophagus | 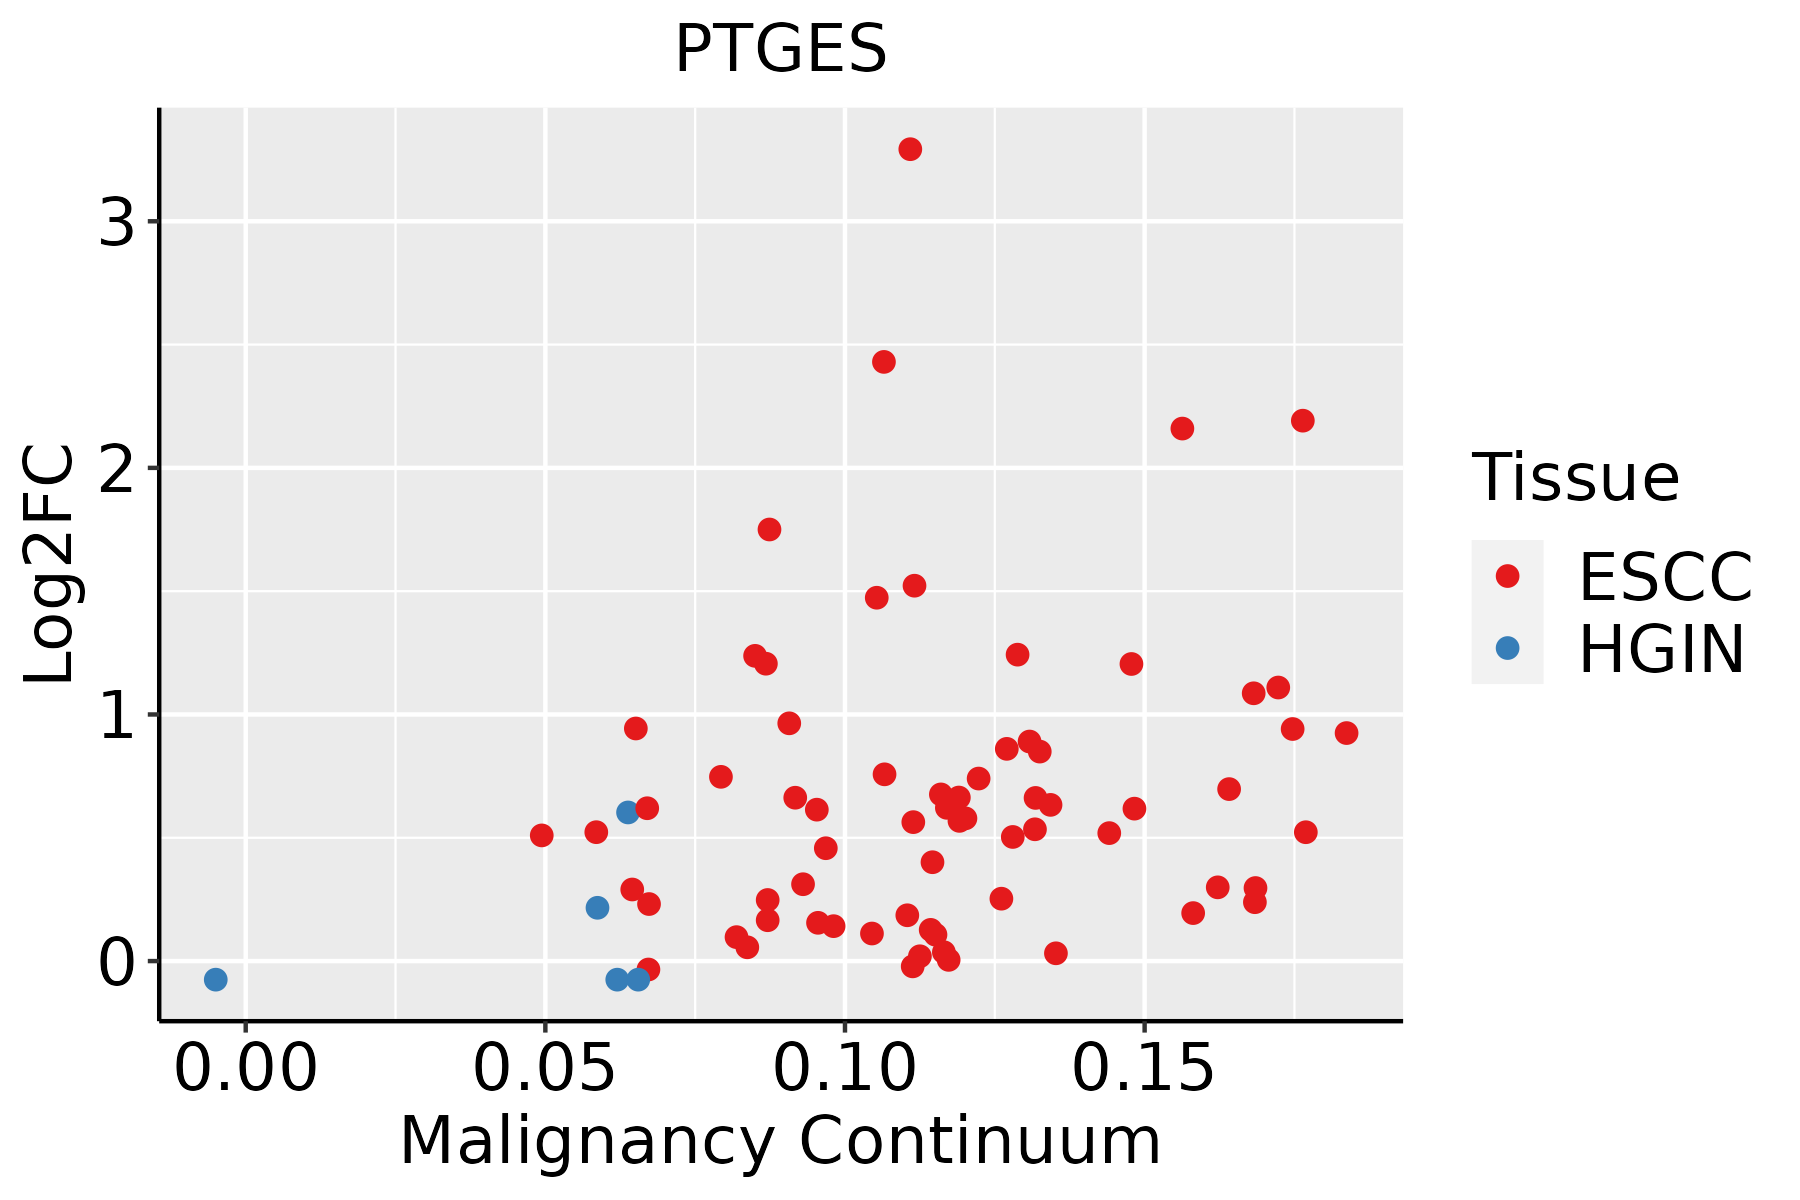 | ESCC: Esophageal squamous cell carcinoma |
| HGIN: High-grade intraepithelial neoplasias | ||
| LGIN: Low-grade intraepithelial neoplasias | ||
| Liver | 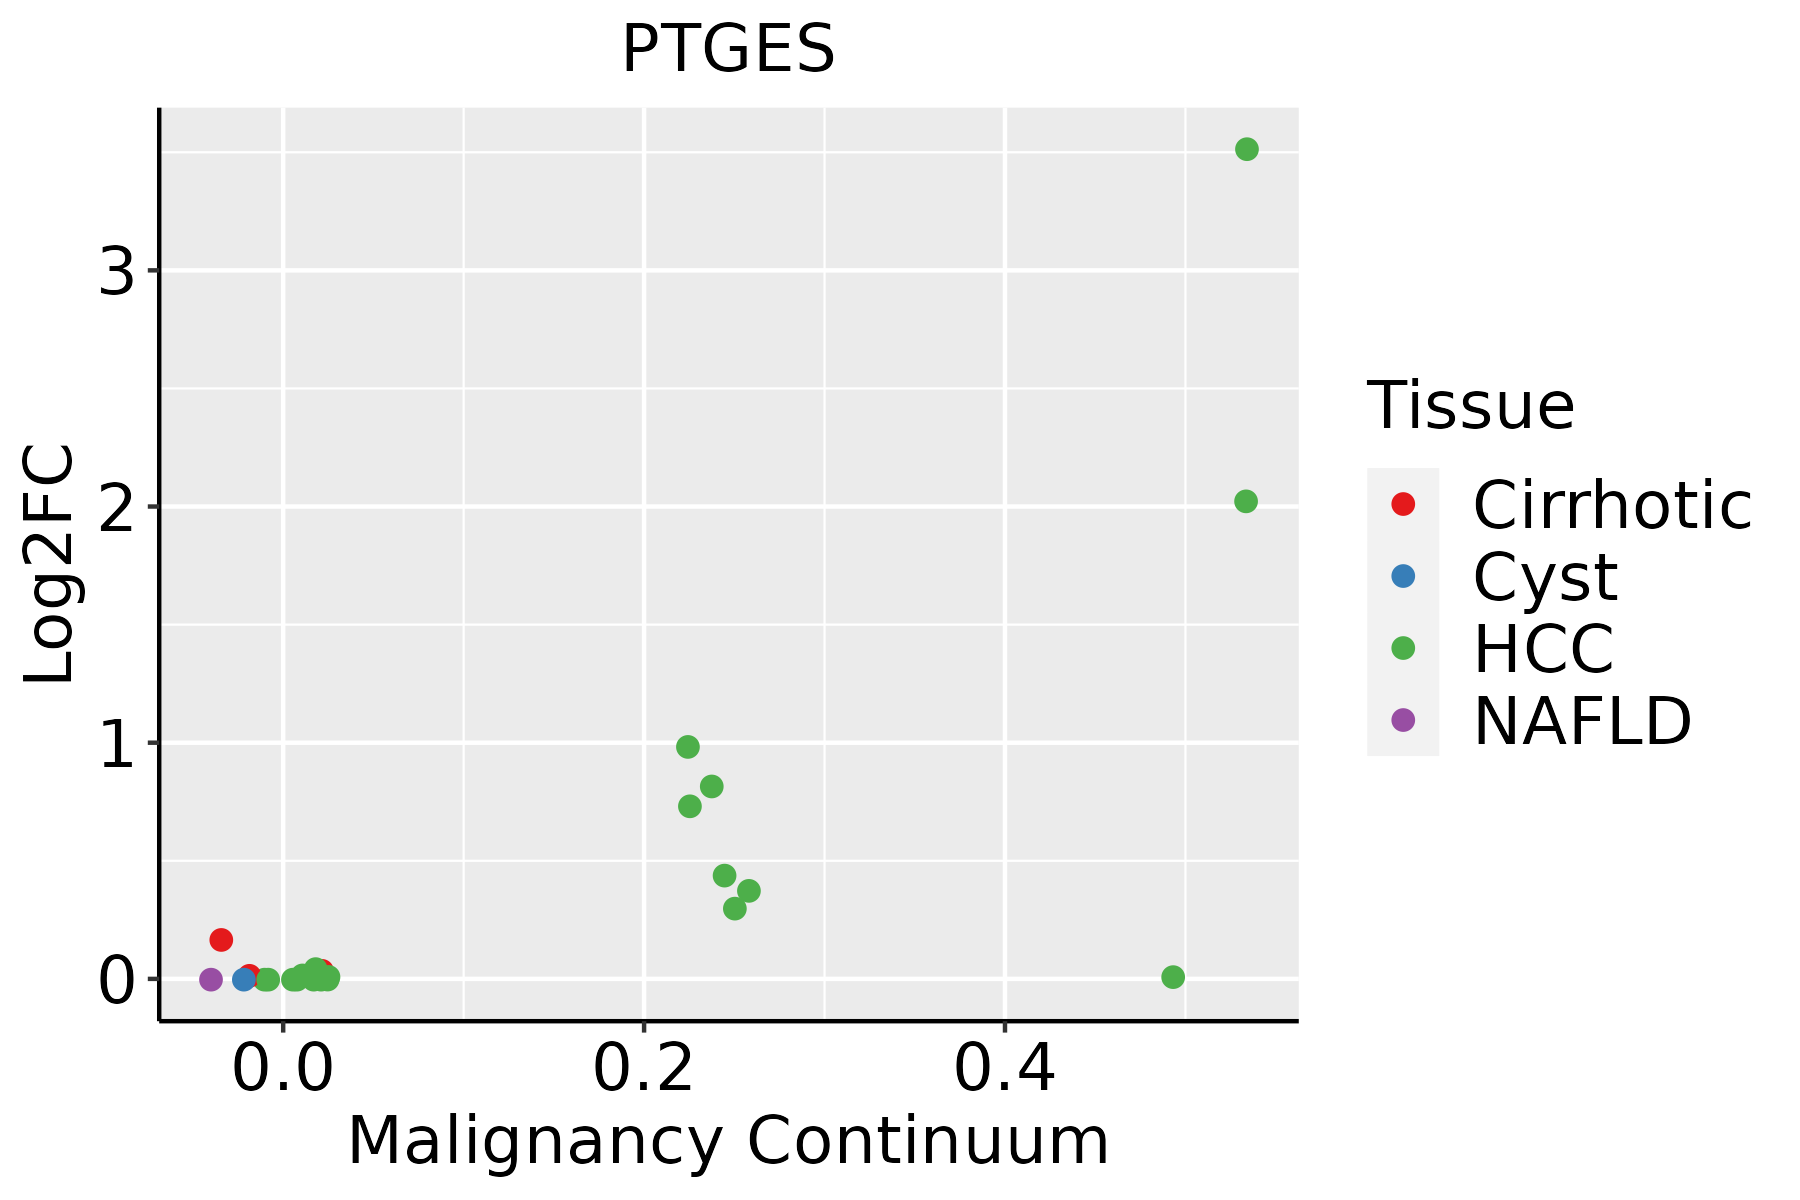 | HCC: Hepatocellular carcinoma |
| NAFLD: Non-alcoholic fatty liver disease | ||
| Oral Cavity | 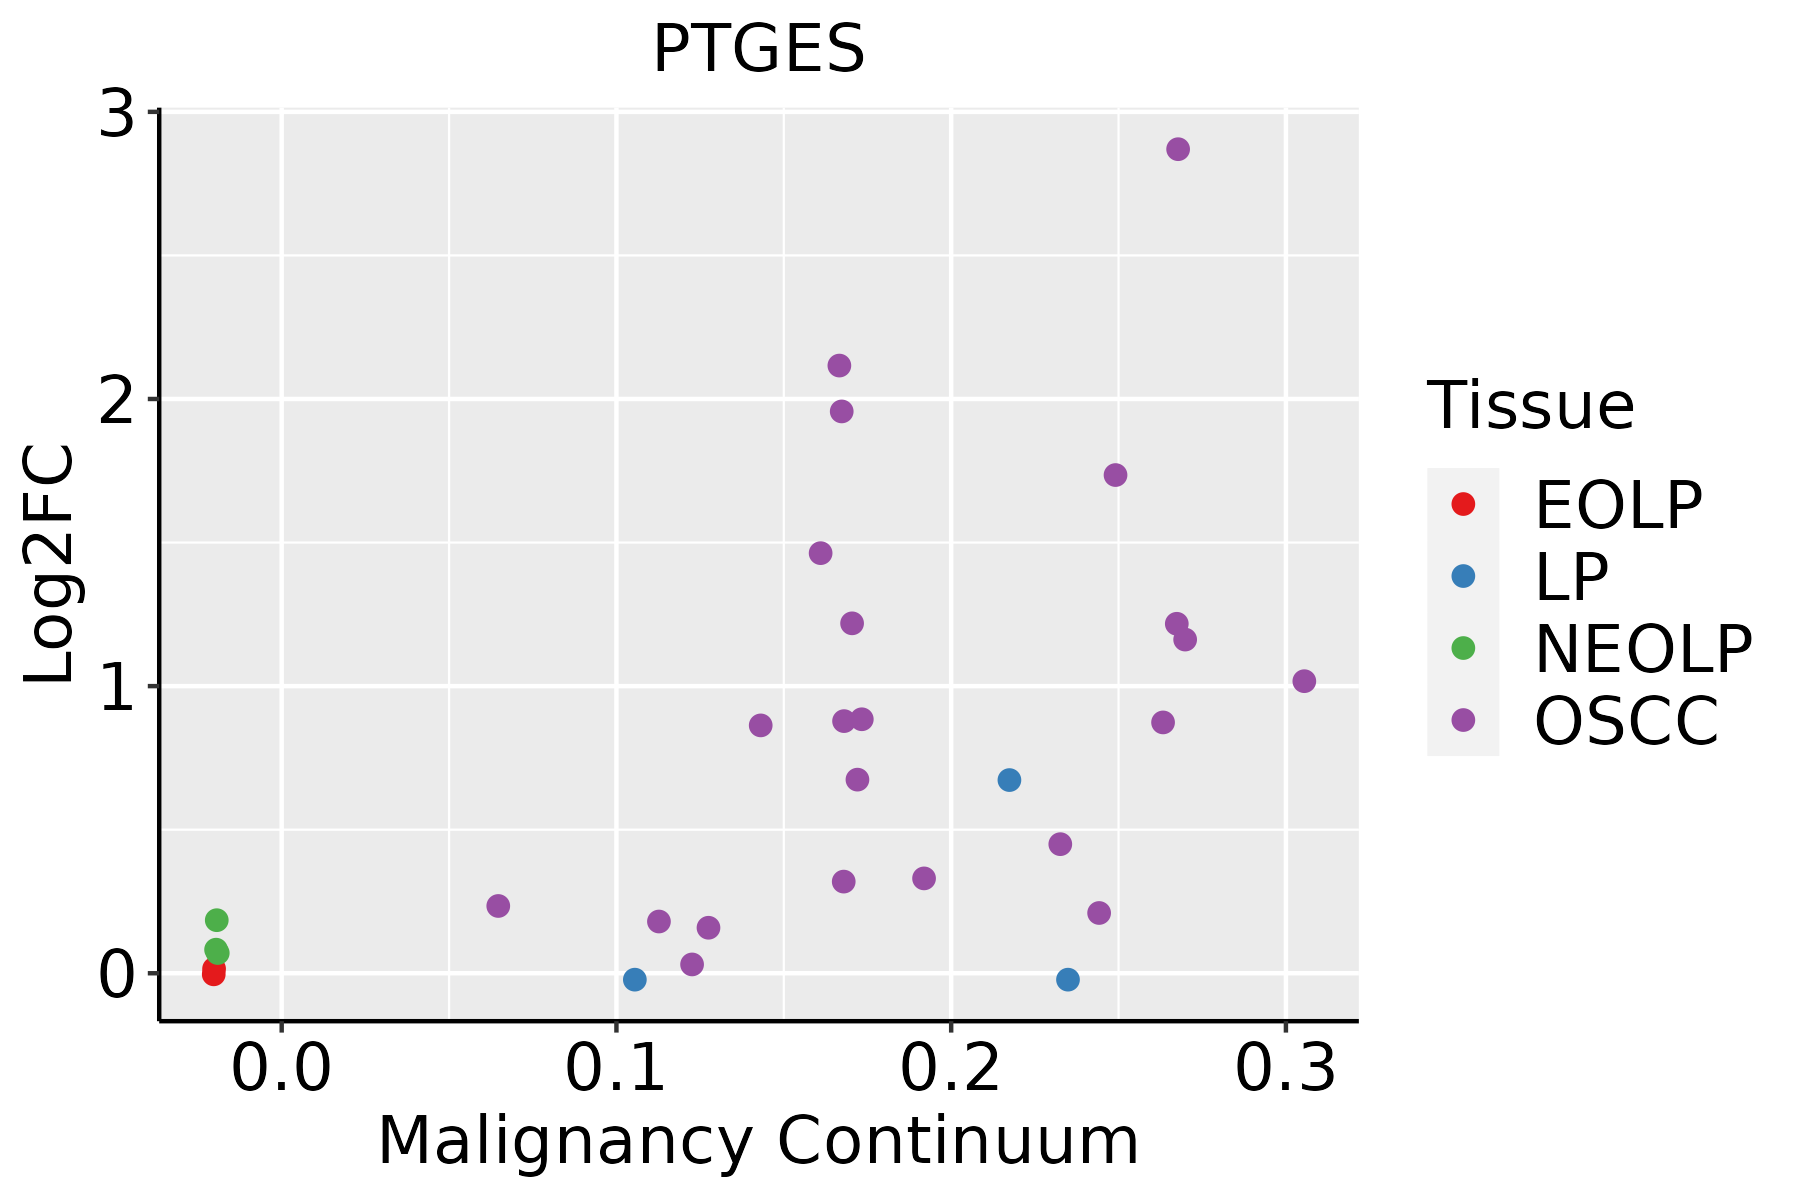 | EOLP: Erosive Oral lichen planus |
| LP: leukoplakia | ||
| NEOLP: Non-erosive oral lichen planus | ||
| OSCC: Oral squamous cell carcinoma |
| ∗log2FC in expression of this searched gene in stem-like cells from each diseased tissue sample relative to stem-like cells in normal samples in each tissue plotted against the malignancy continuum. Samples are colored based on if they are from different disease stage. |
Top |
Malignant transformation related pathway analysis |
| Find out the enriched GO biological processes and KEGG pathways involved in transition from healthy to precancer to cancer |
| Tissue | Disease Stage | Enriched GO biological Processes |
| Colorectum | AD |  |
| Colorectum | SER |  |
| Colorectum | MSS |  |
| Colorectum | MSI-H |  |
| Colorectum | FAP |  |
| ∗Top 15 enriched GO BP terms are showed in the bar plot of each disease state in each tissue. Each row represents a significant GO biological process which is colored according to the -log10(p.adjust). |
| Page: 1 2 3 4 5 6 7 8 9 |
| GO ID | Tissue | Disease Stage | Description | Gene Ratio | Bg Ratio | pvalue | p.adjust | Count |
| GO:00066315 | Stomach | GC | fatty acid metabolic process | 55/1159 | 390/18723 | 8.63e-09 | 8.38e-07 | 55 |
| GO:00064586 | Stomach | GC | 'de novo' protein folding | 15/1159 | 43/18723 | 2.01e-08 | 1.63e-06 | 15 |
| GO:00610776 | Stomach | GC | chaperone-mediated protein folding | 18/1159 | 67/18723 | 8.05e-08 | 5.15e-06 | 18 |
| GO:0033559 | Stomach | GC | unsaturated fatty acid metabolic process | 24/1159 | 116/18723 | 1.43e-07 | 8.35e-06 | 24 |
| GO:00510846 | Stomach | GC | 'de novo' posttranslational protein folding | 13/1159 | 39/18723 | 3.28e-07 | 1.75e-05 | 13 |
| GO:0006690 | Stomach | GC | icosanoid metabolic process | 24/1159 | 123/18723 | 4.49e-07 | 2.32e-05 | 24 |
| GO:00510856 | Stomach | GC | chaperone cofactor-dependent protein refolding | 12/1159 | 34/18723 | 4.59e-07 | 2.35e-05 | 12 |
| GO:00316476 | Stomach | GC | regulation of protein stability | 40/1159 | 298/18723 | 3.23e-06 | 1.31e-04 | 40 |
| GO:0006692 | Stomach | GC | prostanoid metabolic process | 13/1159 | 49/18723 | 5.93e-06 | 2.30e-04 | 13 |
| GO:0006693 | Stomach | GC | prostaglandin metabolic process | 13/1159 | 49/18723 | 5.93e-06 | 2.30e-04 | 13 |
| GO:00508216 | Stomach | GC | protein stabilization | 29/1159 | 191/18723 | 6.65e-06 | 2.54e-04 | 29 |
| GO:0120254 | Stomach | GC | olefinic compound metabolic process | 25/1159 | 153/18723 | 7.68e-06 | 2.77e-04 | 25 |
| GO:00485456 | Stomach | GC | response to steroid hormone | 42/1159 | 339/18723 | 1.40e-05 | 4.54e-04 | 42 |
| GO:0006633 | Stomach | GC | fatty acid biosynthetic process | 25/1159 | 163/18723 | 2.36e-05 | 6.90e-04 | 25 |
| GO:00718266 | Stomach | GC | ribonucleoprotein complex subunit organization | 30/1159 | 227/18723 | 7.06e-05 | 1.57e-03 | 30 |
| GO:00226186 | Stomach | GC | ribonucleoprotein complex assembly | 29/1159 | 220/18723 | 9.69e-05 | 1.97e-03 | 29 |
| GO:00463944 | Stomach | GC | carboxylic acid biosynthetic process | 37/1159 | 314/18723 | 1.28e-04 | 2.41e-03 | 37 |
| GO:00160534 | Stomach | GC | organic acid biosynthetic process | 37/1159 | 316/18723 | 1.46e-04 | 2.67e-03 | 37 |
| GO:00226136 | Stomach | GC | ribonucleoprotein complex biogenesis | 49/1159 | 463/18723 | 1.72e-04 | 3.02e-03 | 49 |
| GO:0072330 | Stomach | GC | monocarboxylic acid biosynthetic process | 27/1159 | 214/18723 | 3.41e-04 | 5.40e-03 | 27 |
| Page: 1 2 3 4 5 6 7 8 9 10 11 12 13 14 15 16 17 18 19 20 21 22 23 24 25 26 27 28 29 30 31 32 33 34 35 36 37 38 39 40 41 42 43 44 45 46 47 48 49 50 51 52 53 54 55 56 |
| Pathway ID | Tissue | Disease Stage | Description | Gene Ratio | Bg Ratio | pvalue | p.adjust | qvalue | Count |
| Page: 1 |
Top |
Cell-cell communication analysis |
| Identification of potential cell-cell interactions between two cell types and their ligand-receptor pairs for different disease states |
| Ligand | Receptor | LRpair | Pathway | Tissue | Disease Stage |
| Page: 1 |
Top |
Single-cell gene regulatory network inference analysis |
| Find out the significant the regulons (TFs) and the target genes of each regulon across cell types for different disease states |
| TF | Cell Type | Tissue | Disease Stage | Target Gene | RSS | Regulon Activity |
| ∗The dot plots of a searched regulon are shown for all cell subpopulations in each disease state of each tissue based on the regulon specific score inferred using pySCENIC and by calculating the average expression. |
| Page: 1 |
Top |
Somatic mutation of malignant transformation related genes |
| Annotation of somatic variants for genes involved in malignant transformation |
| Hugo Symbol | Variant Class | Variant Classification | dbSNP RS | HGVSc | HGVSp | HGVSp Short | SWISSPROT | BIOTYPE | SIFT | PolyPhen | Tumor Sample Barcode | Tissue | Histology | Sex | Age | Stage | Therapy Types | Drugs | Outcome |
| PTGES | SNV | Missense_Mutation | c.296N>T | p.Ala99Val | p.A99V | O14684 | protein_coding | deleterious(0) | probably_damaging(0.997) | TCGA-G4-6628-01 | Colorectum | colon adenocarcinoma | Male | >=65 | I/II | Unknown | Unknown | SD | |
| PTGES | SNV | Missense_Mutation | c.421N>C | p.Ala141Pro | p.A141P | O14684 | protein_coding | deleterious(0) | probably_damaging(0.971) | TCGA-EI-7002-01 | Colorectum | rectum adenocarcinoma | Male | <65 | III/IV | Chemotherapy | irinotecan+5-fluorouracilim | SD | |
| PTGES | SNV | Missense_Mutation | rs551621700 | c.365G>A | p.Arg122Gln | p.R122Q | O14684 | protein_coding | tolerated(0.2) | benign(0.024) | TCGA-D1-A103-01 | Endometrium | uterine corpus endometrioid carcinoma | Female | >=65 | I/II | Unknown | Unknown | SD |
| PTGES | SNV | Missense_Mutation | c.374T>C | p.Ile125Thr | p.I125T | O14684 | protein_coding | tolerated(1) | benign(0) | TCGA-D1-A17Q-01 | Endometrium | uterine corpus endometrioid carcinoma | Female | <65 | I/II | Unknown | Unknown | SD | |
| PTGES | SNV | Missense_Mutation | c.244N>A | p.Phe82Ile | p.F82I | O14684 | protein_coding | deleterious(0) | probably_damaging(1) | TCGA-FV-A3R3-01 | Liver | liver hepatocellular carcinoma | Female | <65 | I/II | Unknown | Unknown | SD | |
| PTGES | SNV | Missense_Mutation | c.190N>C | p.Asp64His | p.D64H | O14684 | protein_coding | tolerated(0.05) | probably_damaging(0.971) | TCGA-18-3409-01 | Lung | lung squamous cell carcinoma | Male | >=65 | I/II | Unknown | Unknown | PD | |
| PTGES | SNV | Missense_Mutation | novel | c.167C>A | p.Pro56His | p.P56H | O14684 | protein_coding | tolerated(0.14) | benign(0.343) | TCGA-37-3789-01 | Lung | lung squamous cell carcinoma | Male | >=65 | I/II | Unknown | Unknown | SD |
| PTGES | deletion | Frame_Shift_Del | c.189delC | p.Asp64ThrfsTer65 | p.D64Tfs*65 | O14684 | protein_coding | TCGA-BR-8078-01 | Stomach | stomach adenocarcinoma | Female | >=65 | I/II | Unknown | Unknown | SD |
| Page: 1 |
Top |
Related drugs of malignant transformation related genes |
| Identification of chemicals and drugs interact with genes involved in malignant transfromation |
| (DGIdb 4.0) |
| Entrez ID | Symbol | Category | Interaction Types | Drug Claim Name | Drug Name | PMIDs |
| 9536 | PTGES | DRUGGABLE GENOME, ENZYME | Benzamide derivative 14 | |||
| 9536 | PTGES | DRUGGABLE GENOME, ENZYME | Benzimidazole derivative 13 | |||
| 9536 | PTGES | DRUGGABLE GENOME, ENZYME | VEGF | 16155957 | ||
| 9536 | PTGES | DRUGGABLE GENOME, ENZYME | Imidazopyridine derivative 5 | |||
| 9536 | PTGES | DRUGGABLE GENOME, ENZYME | Imidazole benzamide derivative 1 | |||
| 9536 | PTGES | DRUGGABLE GENOME, ENZYME | inhibitor | 252827532 | ||
| 9536 | PTGES | DRUGGABLE GENOME, ENZYME | Alpha-substituted pirinixic acid and pirinixic acid ester derivative 1 | |||
| 9536 | PTGES | DRUGGABLE GENOME, ENZYME | Imidazopyridine derivative 6 | |||
| 9536 | PTGES | DRUGGABLE GENOME, ENZYME | PMID28627961-Compound-30 | |||
| 9536 | PTGES | DRUGGABLE GENOME, ENZYME | Methyl-piperidine compound 1 |
| Page: 1 2 3 4 5 |

Copyright 2023-Present -The University of Texas Health Science Center at Houston |