
|
|||||
|
 | |
| |
| |
| |
| |
| |
|
Gene: NIPBL |
Gene summary for NIPBL |
| Gene information | Species | Human | Gene symbol | NIPBL | Gene ID | 25836 |
| Gene name | NIPBL cohesin loading factor | |
| Gene Alias | CDLS | |
| Cytomap | 5p13.2 | |
| Gene Type | protein-coding | GO ID | GO:0000003 | UniProtAcc | Q6KC79 |
Top |
Malignant transformation analysis |
| Identification of the aberrant gene expression in precancerous and cancerous lesions by comparing the gene expression of stem-like cells in diseased tissues with normal stem cells |
| Entrez ID | Symbol | Replicates | Species | Organ | Tissue | Adj P-value | Log2FC | Malignancy |
| 25836 | NIPBL | CA_HPV_1 | Human | Cervix | CC | 1.37e-04 | -2.30e-02 | 0.0264 |
| 25836 | NIPBL | CCI_1 | Human | Cervix | CC | 9.89e-10 | 1.17e+00 | 0.528 |
| 25836 | NIPBL | CCI_2 | Human | Cervix | CC | 4.93e-14 | 1.43e+00 | 0.5249 |
| 25836 | NIPBL | CCI_3 | Human | Cervix | CC | 7.15e-22 | 1.54e+00 | 0.516 |
| 25836 | NIPBL | L1 | Human | Cervix | CC | 3.45e-02 | -2.24e-01 | 0.0802 |
| 25836 | NIPBL | HTA11_3410_2000001011 | Human | Colorectum | AD | 2.54e-22 | -5.55e-01 | 0.0155 |
| 25836 | NIPBL | HTA11_2487_2000001011 | Human | Colorectum | SER | 7.15e-08 | -5.15e-01 | -0.1808 |
| 25836 | NIPBL | HTA11_2951_2000001011 | Human | Colorectum | AD | 3.09e-06 | -9.36e-01 | 0.0216 |
| 25836 | NIPBL | HTA11_347_2000001011 | Human | Colorectum | AD | 2.04e-02 | 3.42e-01 | -0.1954 |
| 25836 | NIPBL | HTA11_3361_2000001011 | Human | Colorectum | AD | 7.59e-05 | -6.33e-01 | -0.1207 |
| 25836 | NIPBL | HTA11_5212_2000001011 | Human | Colorectum | AD | 2.95e-05 | -6.37e-01 | -0.2061 |
| 25836 | NIPBL | HTA11_7862_2000001011 | Human | Colorectum | AD | 8.56e-04 | -5.34e-01 | -0.0179 |
| 25836 | NIPBL | HTA11_866_3004761011 | Human | Colorectum | AD | 9.82e-07 | -5.06e-01 | 0.096 |
| 25836 | NIPBL | HTA11_4255_2000001011 | Human | Colorectum | SER | 1.75e-02 | -4.71e-01 | 0.0446 |
| 25836 | NIPBL | HTA11_8622_2000001021 | Human | Colorectum | SER | 3.33e-03 | -5.94e-01 | 0.0528 |
| 25836 | NIPBL | HTA11_10711_2000001011 | Human | Colorectum | AD | 1.04e-08 | -5.15e-01 | 0.0338 |
| 25836 | NIPBL | HTA11_7696_3000711011 | Human | Colorectum | AD | 4.25e-11 | -4.70e-01 | 0.0674 |
| 25836 | NIPBL | HTA11_7469_2000001011 | Human | Colorectum | AD | 1.52e-02 | -8.13e-01 | -0.0124 |
| 25836 | NIPBL | HTA11_11156_2000001011 | Human | Colorectum | AD | 3.91e-03 | -7.98e-01 | 0.0397 |
| 25836 | NIPBL | HTA11_6818_2000001021 | Human | Colorectum | AD | 4.22e-02 | -4.12e-01 | 0.0588 |
| Page: 1 2 3 4 5 6 7 8 9 10 11 12 13 |
| Tissue | Expression Dynamics | Abbreviation |
| Cervix | 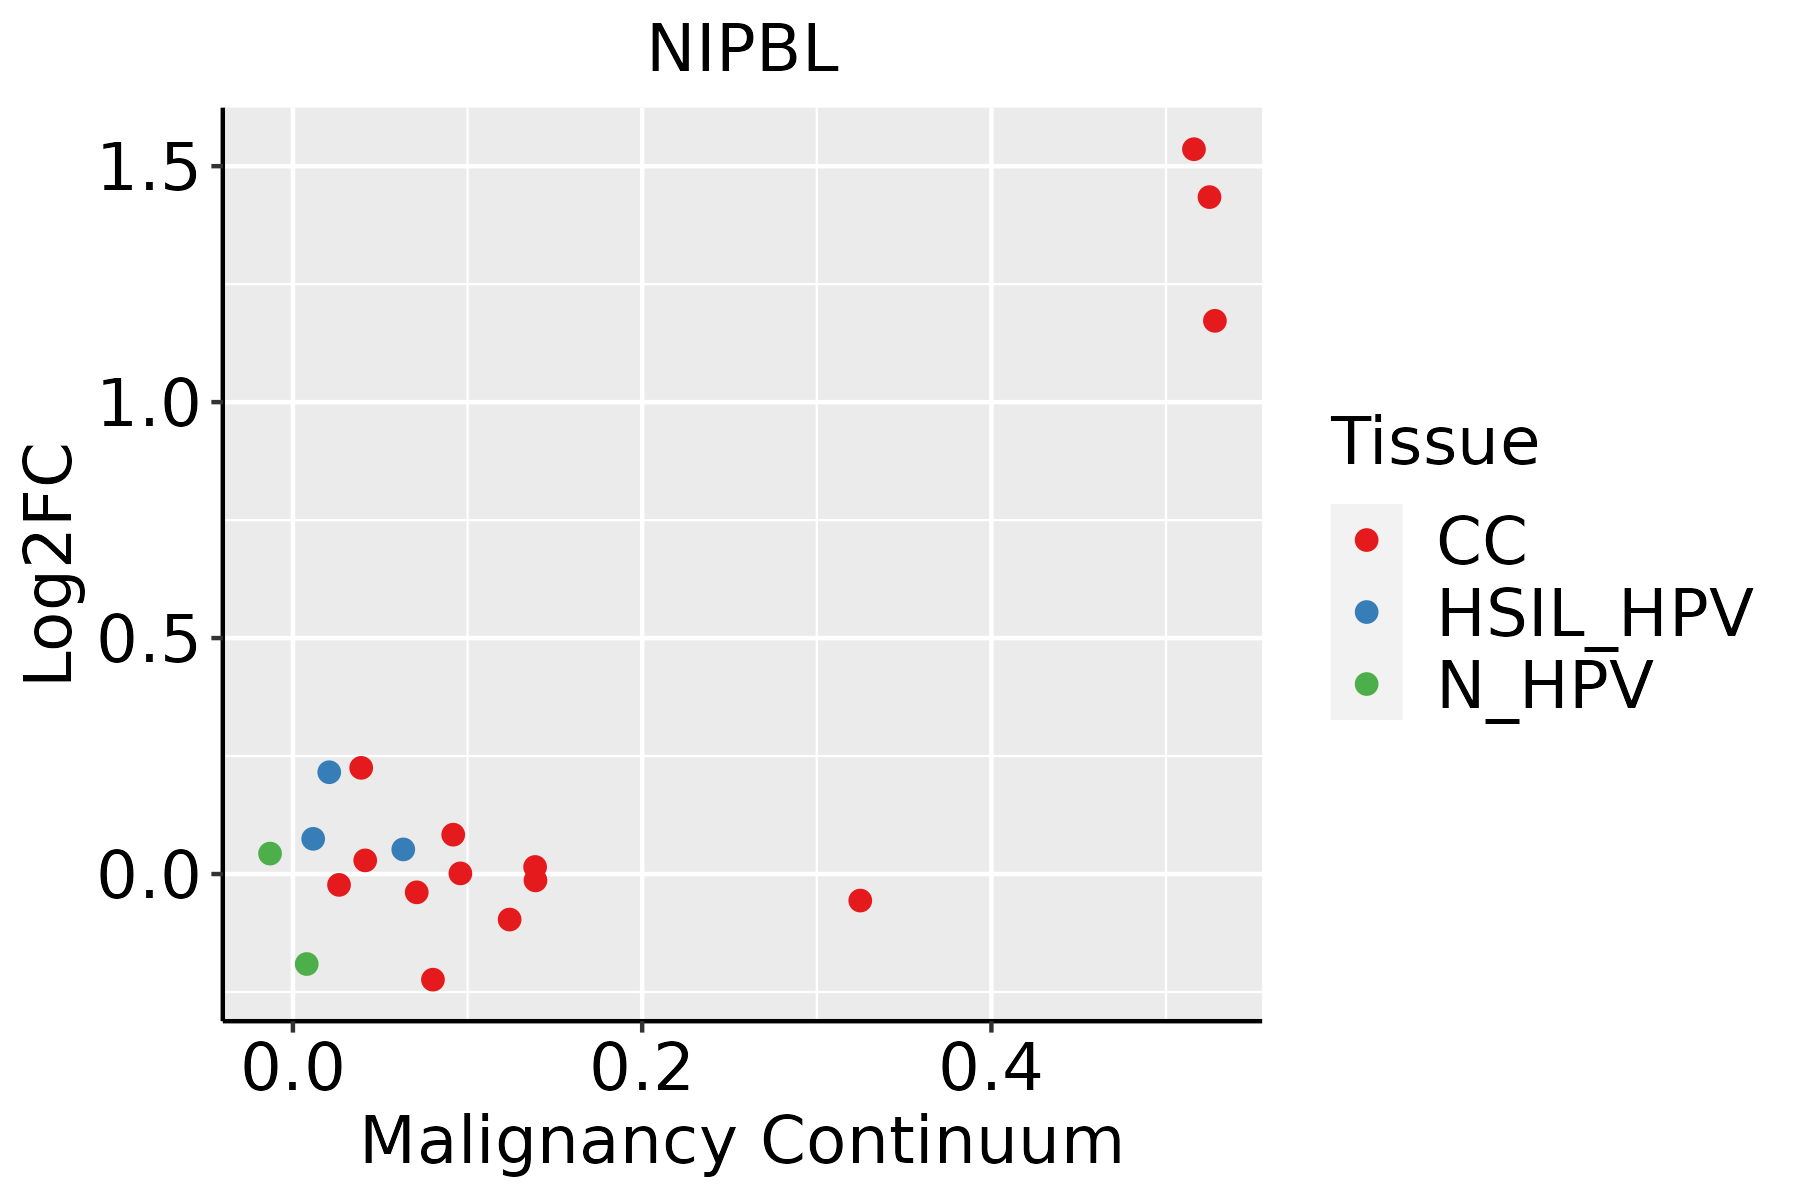 | CC: Cervix cancer |
| HSIL_HPV: HPV-infected high-grade squamous intraepithelial lesions | ||
| N_HPV: HPV-infected normal cervix | ||
| Colorectum (GSE201348) |  | FAP: Familial adenomatous polyposis |
| CRC: Colorectal cancer | ||
| Colorectum (HTA11) |  | AD: Adenomas |
| SER: Sessile serrated lesions | ||
| MSI-H: Microsatellite-high colorectal cancer | ||
| MSS: Microsatellite stable colorectal cancer | ||
| Endometrium |  | AEH: Atypical endometrial hyperplasia |
| EEC: Endometrioid Cancer | ||
| Esophagus |  | ESCC: Esophageal squamous cell carcinoma |
| HGIN: High-grade intraepithelial neoplasias | ||
| LGIN: Low-grade intraepithelial neoplasias | ||
| Liver |  | HCC: Hepatocellular carcinoma |
| NAFLD: Non-alcoholic fatty liver disease | ||
| Lung | 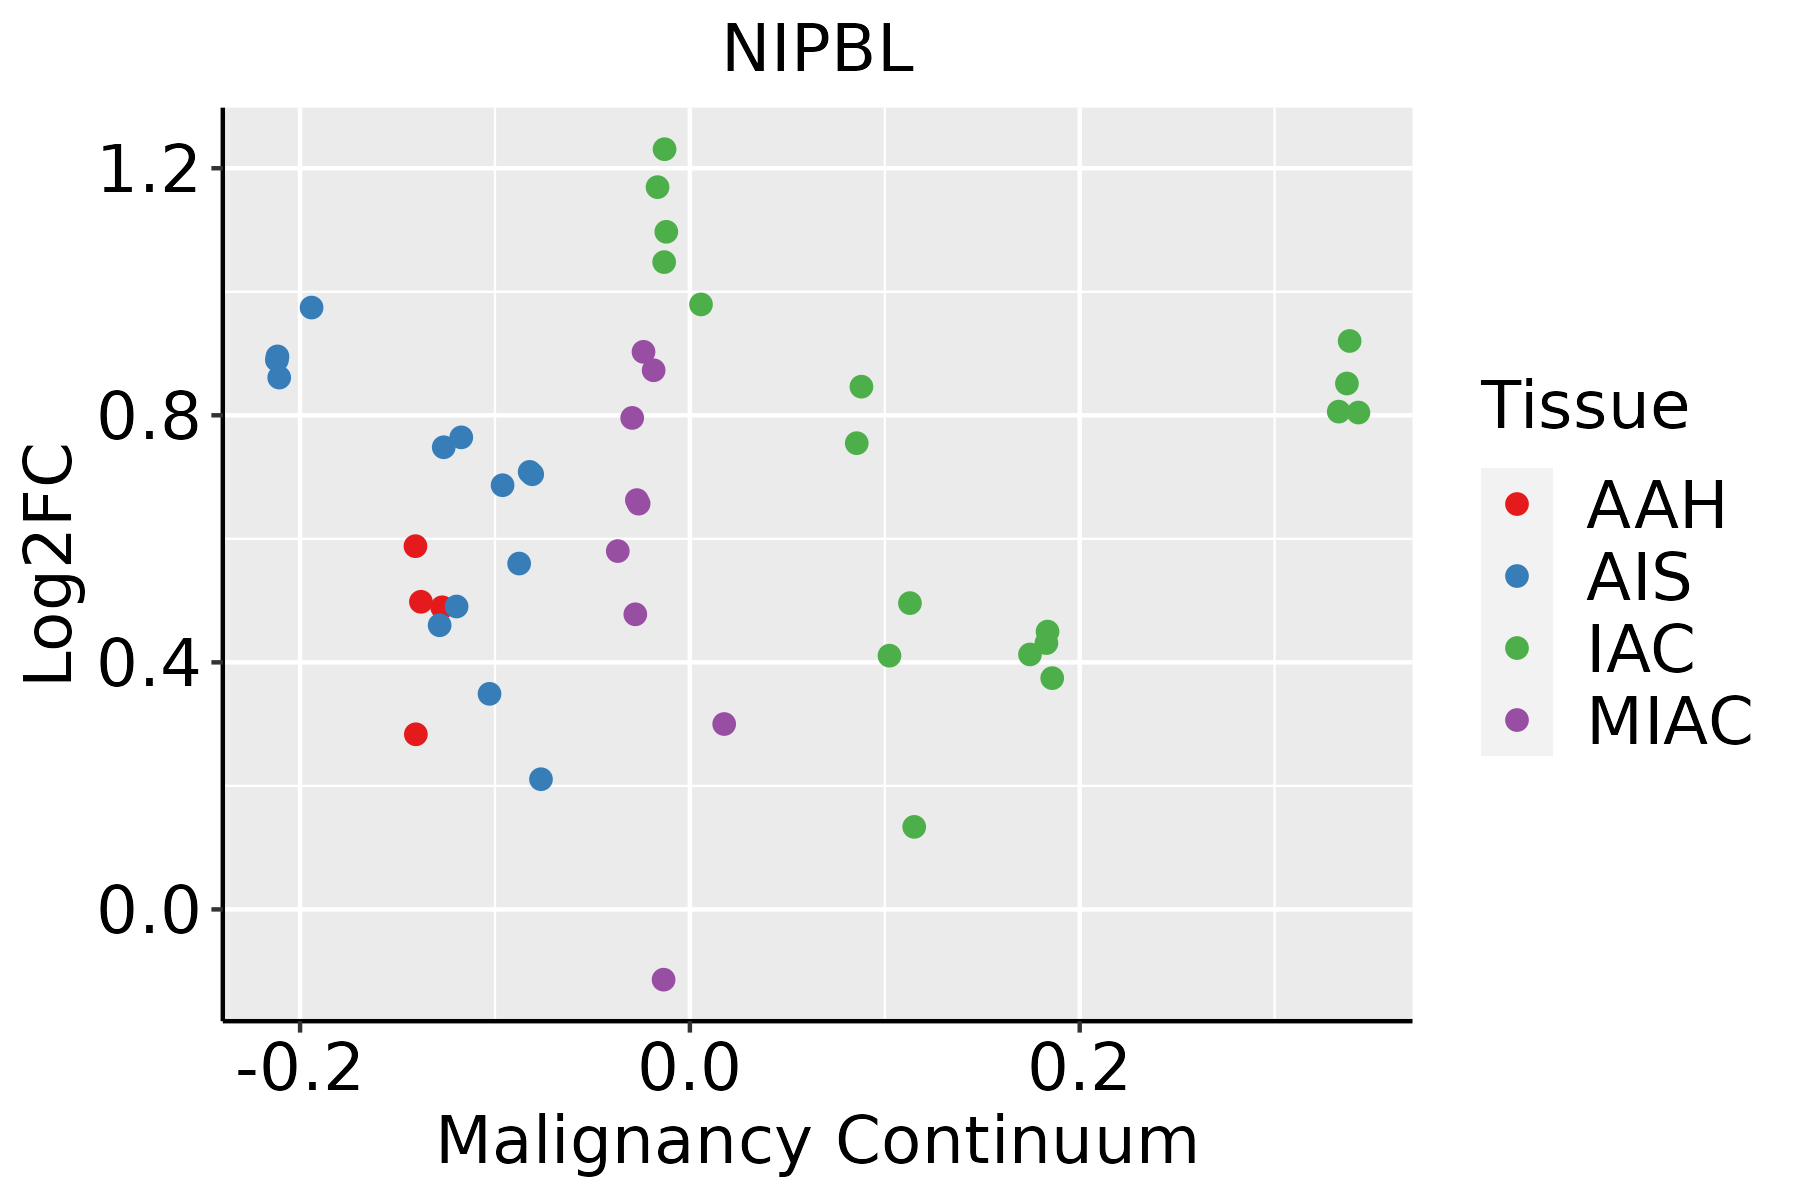 | AAH: Atypical adenomatous hyperplasia |
| AIS: Adenocarcinoma in situ | ||
| IAC: Invasive lung adenocarcinoma | ||
| MIA: Minimally invasive adenocarcinoma | ||
| Oral Cavity | 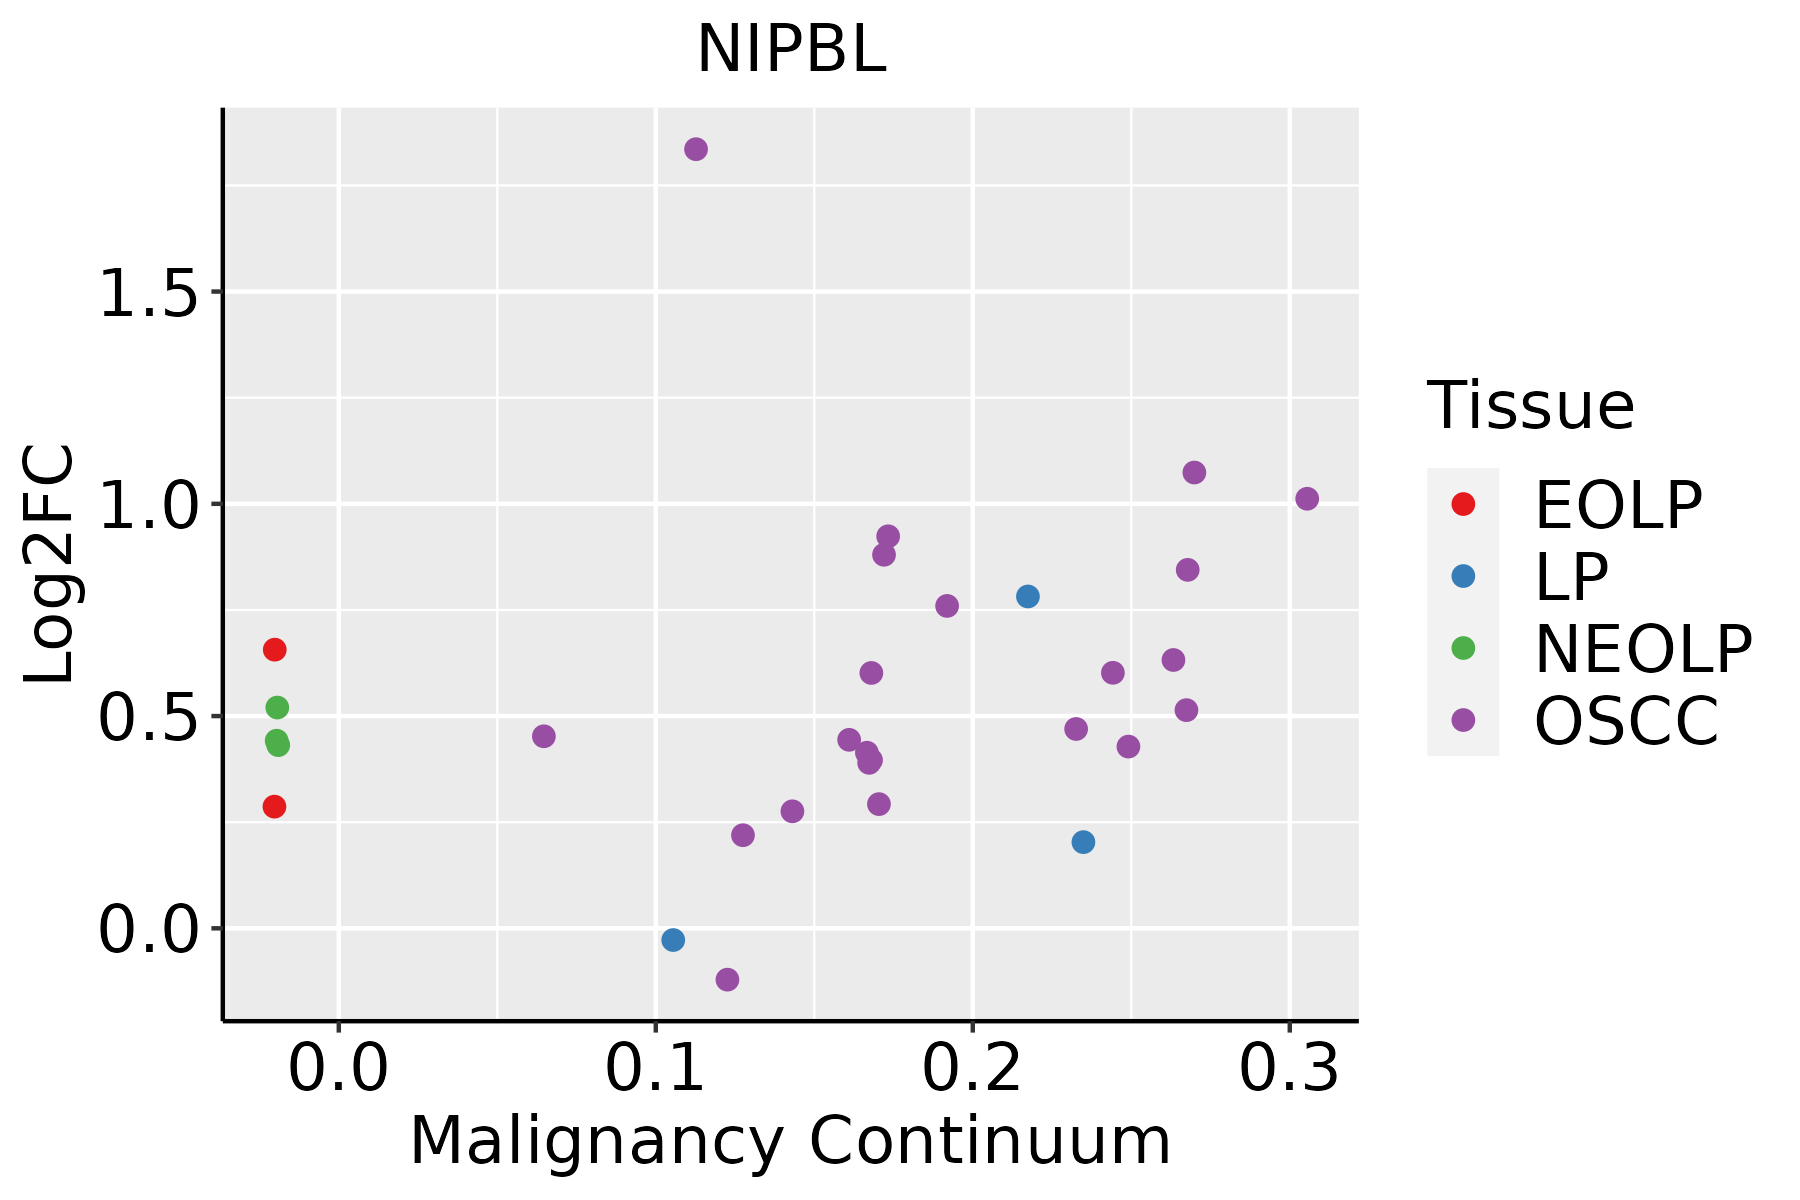 | EOLP: Erosive Oral lichen planus |
| LP: leukoplakia | ||
| NEOLP: Non-erosive oral lichen planus | ||
| OSCC: Oral squamous cell carcinoma | ||
| Prostate | 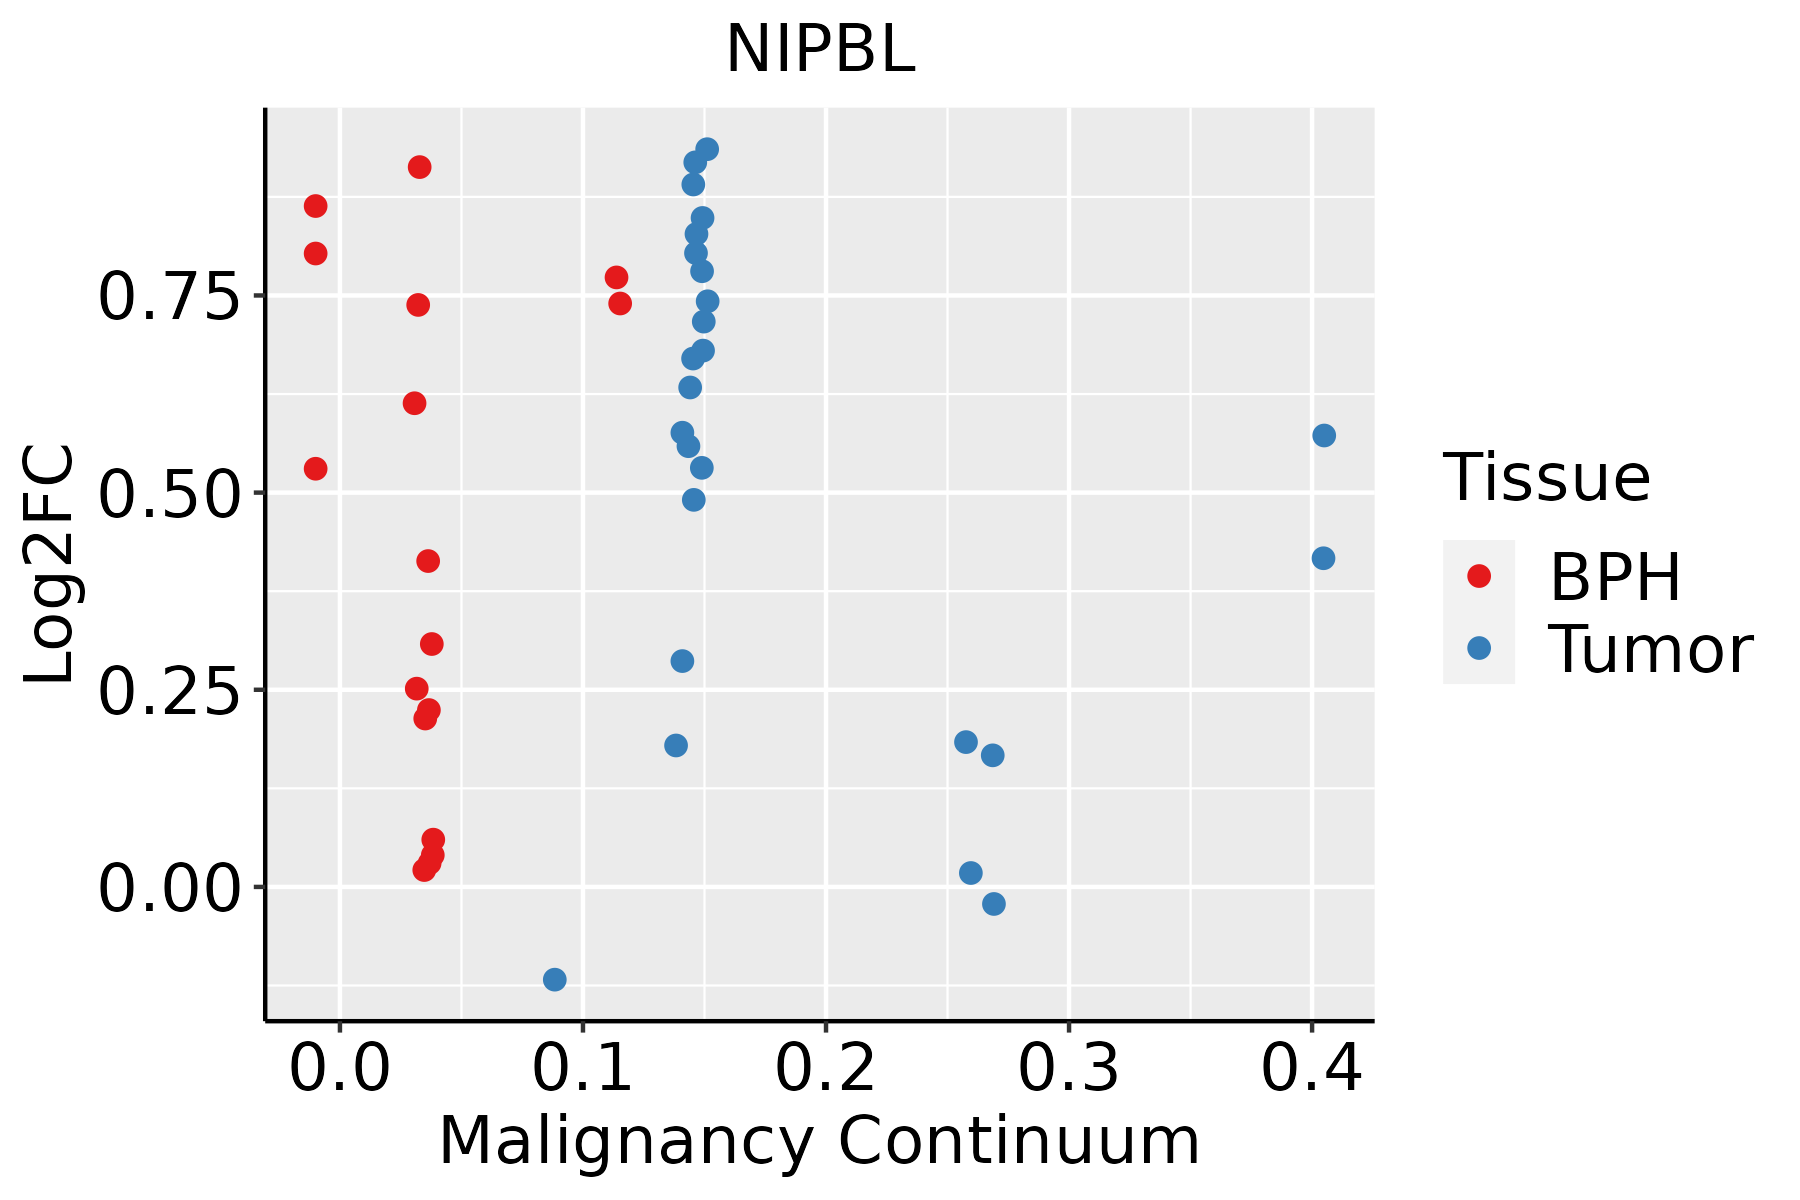 | BPH: Benign Prostatic Hyperplasia |
| Skin | 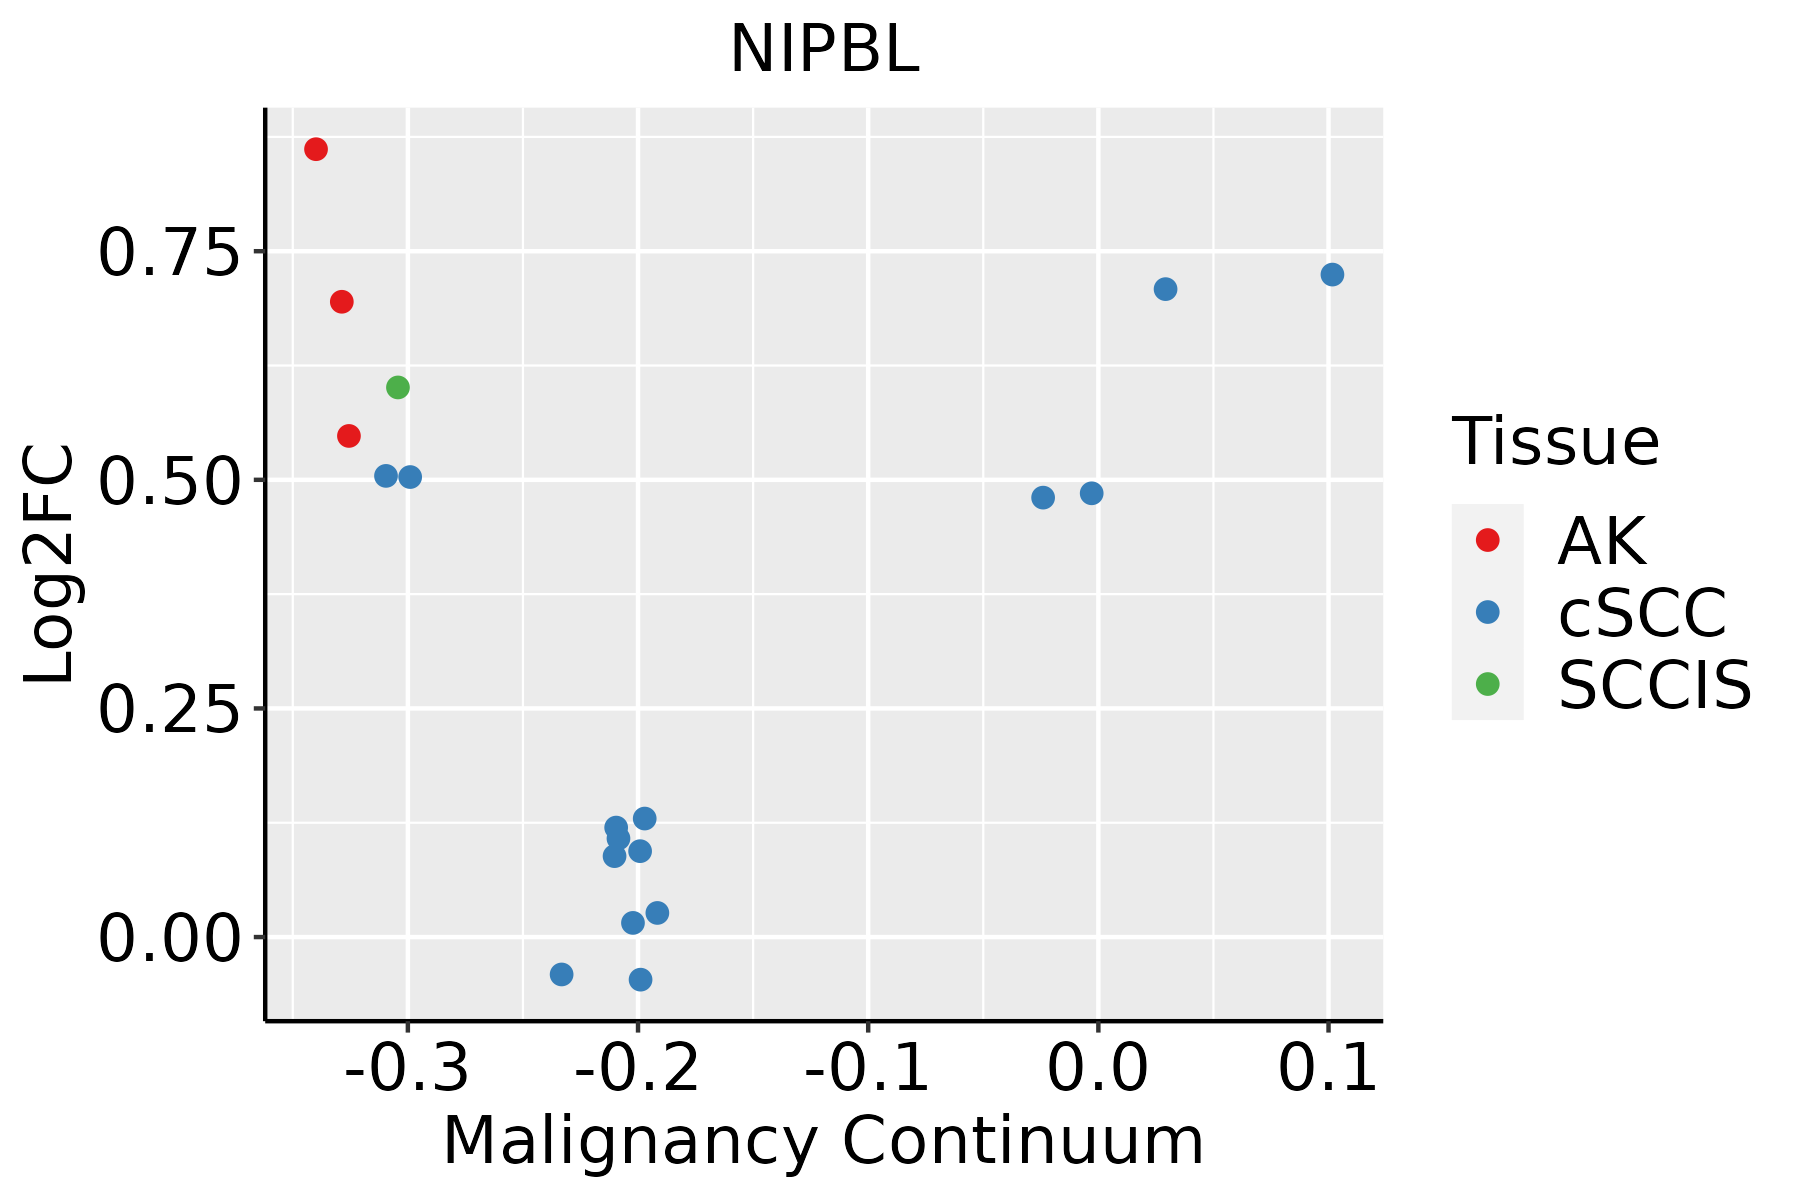 | AK: Actinic keratosis |
| cSCC: Cutaneous squamous cell carcinoma | ||
| SCCIS:squamous cell carcinoma in situ | ||
| Thyroid | 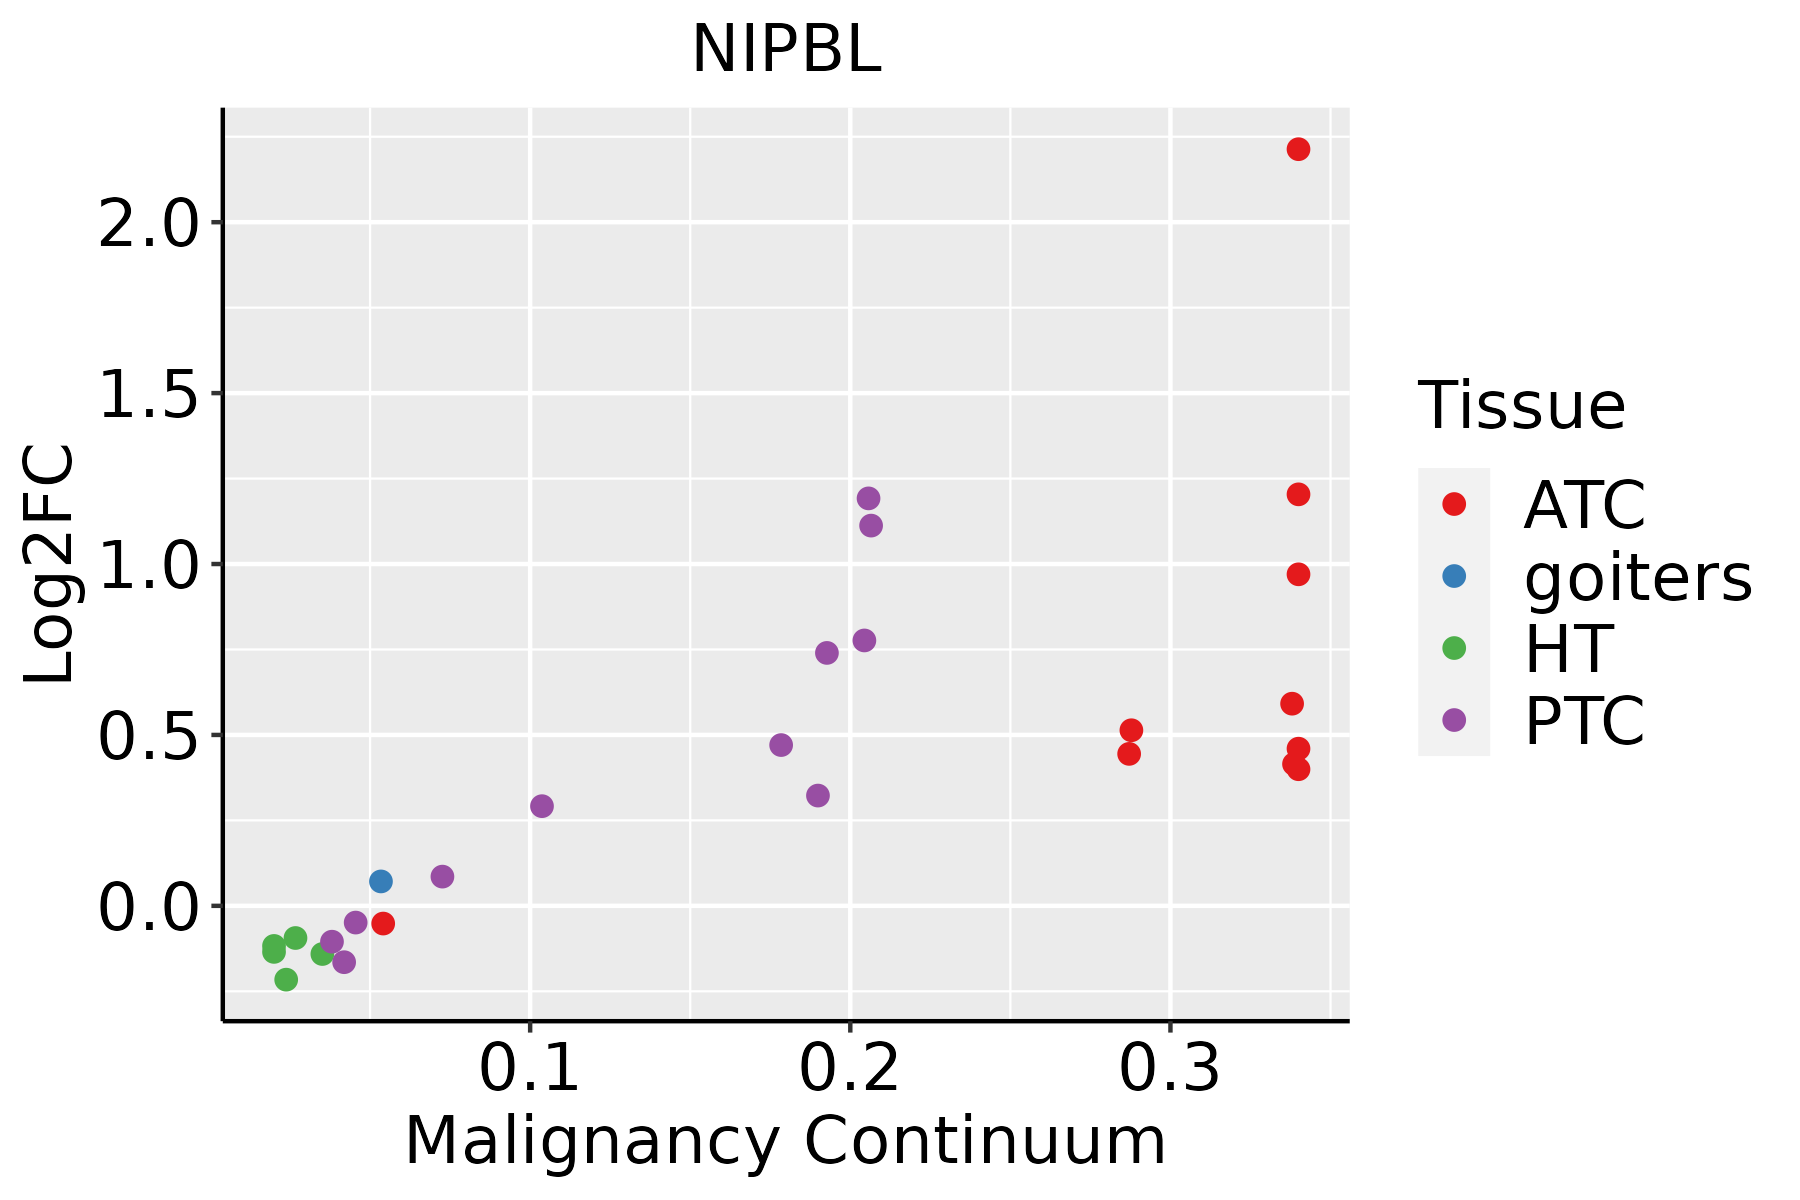 | ATC: Anaplastic thyroid cancer |
| HT: Hashimoto's thyroiditis | ||
| PTC: Papillary thyroid cancer |
| ∗log2FC in expression of this searched gene in stem-like cells from each diseased tissue sample relative to stem-like cells in normal samples in each tissue plotted against the malignancy continuum. Samples are colored based on if they are from different disease stage. |
Top |
Malignant transformation related pathway analysis |
| Find out the enriched GO biological processes and KEGG pathways involved in transition from healthy to precancer to cancer |
| Tissue | Disease Stage | Enriched GO biological Processes |
| Colorectum | AD |  |
| Colorectum | SER |  |
| Colorectum | MSS |  |
| Colorectum | MSI-H |  |
| Colorectum | FAP |  |
| ∗Top 15 enriched GO BP terms are showed in the bar plot of each disease state in each tissue. Each row represents a significant GO biological process which is colored according to the -log10(p.adjust). |
| Page: 1 2 3 4 5 6 7 8 9 |
| GO ID | Tissue | Disease Stage | Description | Gene Ratio | Bg Ratio | pvalue | p.adjust | Count |
| GO:000706213 | Thyroid | ATC | sister chromatid cohesion | 35/6293 | 62/18723 | 1.81e-04 | 1.23e-03 | 35 |
| GO:000630212 | Thyroid | ATC | double-strand break repair | 110/6293 | 251/18723 | 4.48e-04 | 2.65e-03 | 110 |
| GO:000706413 | Thyroid | ATC | mitotic sister chromatid cohesion | 18/6293 | 28/18723 | 8.70e-04 | 4.72e-03 | 18 |
| GO:001016511 | Thyroid | ATC | response to X-ray | 20/6293 | 33/18723 | 1.33e-03 | 6.96e-03 | 20 |
| GO:003526414 | Thyroid | ATC | multicellular organism growth | 61/6293 | 132/18723 | 1.73e-03 | 8.66e-03 | 61 |
| GO:19048882 | Thyroid | ATC | cranial skeletal system development | 35/6293 | 68/18723 | 1.76e-03 | 8.71e-03 | 35 |
| GO:009031211 | Thyroid | ATC | positive regulation of protein deacetylation | 16/6293 | 25/18723 | 1.81e-03 | 8.90e-03 | 16 |
| GO:00485688 | Thyroid | ATC | embryonic organ development | 172/6293 | 427/18723 | 2.08e-03 | 9.84e-03 | 172 |
| GO:00351074 | Thyroid | ATC | appendage morphogenesis | 63/6293 | 138/18723 | 2.13e-03 | 1.00e-02 | 63 |
| GO:00351084 | Thyroid | ATC | limb morphogenesis | 63/6293 | 138/18723 | 2.13e-03 | 1.00e-02 | 63 |
| GO:004863815 | Thyroid | ATC | regulation of developmental growth | 136/6293 | 330/18723 | 2.17e-03 | 1.02e-02 | 136 |
| GO:00487368 | Thyroid | ATC | appendage development | 76/6293 | 172/18723 | 2.41e-03 | 1.12e-02 | 76 |
| GO:00601738 | Thyroid | ATC | limb development | 76/6293 | 172/18723 | 2.41e-03 | 1.12e-02 | 76 |
| GO:007148115 | Thyroid | ATC | cellular response to X-ray | 10/6293 | 14/18723 | 4.31e-03 | 1.80e-02 | 10 |
| GO:0003151 | Thyroid | ATC | outflow tract morphogenesis | 36/6293 | 74/18723 | 5.19e-03 | 2.12e-02 | 36 |
| GO:007019915 | Thyroid | ATC | establishment of protein localization to chromosome | 15/6293 | 25/18723 | 6.08e-03 | 2.44e-02 | 15 |
| GO:00903116 | Thyroid | ATC | regulation of protein deacetylation | 25/6293 | 48/18723 | 6.27e-03 | 2.50e-02 | 25 |
| GO:00487011 | Thyroid | ATC | embryonic cranial skeleton morphogenesis | 24/6293 | 46/18723 | 7.13e-03 | 2.82e-02 | 24 |
| GO:00303262 | Thyroid | ATC | embryonic limb morphogenesis | 52/6293 | 116/18723 | 7.67e-03 | 3.00e-02 | 52 |
| GO:00351132 | Thyroid | ATC | embryonic appendage morphogenesis | 52/6293 | 116/18723 | 7.67e-03 | 3.00e-02 | 52 |
| Page: 1 2 3 4 5 6 7 8 9 10 11 12 13 14 15 16 17 18 19 20 21 22 23 24 25 26 27 28 29 30 31 32 33 34 35 36 37 38 39 40 41 42 43 |
| Pathway ID | Tissue | Disease Stage | Description | Gene Ratio | Bg Ratio | pvalue | p.adjust | qvalue | Count |
| hsa041106 | Cervix | CC | Cell cycle | 36/1267 | 157/8465 | 4.94e-03 | 1.67e-02 | 9.86e-03 | 36 |
| hsa0411013 | Cervix | CC | Cell cycle | 36/1267 | 157/8465 | 4.94e-03 | 1.67e-02 | 9.86e-03 | 36 |
| hsa04110 | Colorectum | FAP | Cell cycle | 37/1404 | 157/8465 | 1.44e-02 | 4.77e-02 | 2.90e-02 | 37 |
| hsa041101 | Colorectum | FAP | Cell cycle | 37/1404 | 157/8465 | 1.44e-02 | 4.77e-02 | 2.90e-02 | 37 |
| hsa041109 | Esophagus | HGIN | Cell cycle | 38/1383 | 157/8465 | 6.70e-03 | 4.37e-02 | 3.47e-02 | 38 |
| hsa0411016 | Esophagus | HGIN | Cell cycle | 38/1383 | 157/8465 | 6.70e-03 | 4.37e-02 | 3.47e-02 | 38 |
| hsa0411023 | Esophagus | ESCC | Cell cycle | 126/4205 | 157/8465 | 1.34e-15 | 5.60e-14 | 2.87e-14 | 126 |
| hsa0411033 | Esophagus | ESCC | Cell cycle | 126/4205 | 157/8465 | 1.34e-15 | 5.60e-14 | 2.87e-14 | 126 |
| hsa041104 | Liver | Cirrhotic | Cell cycle | 61/2530 | 157/8465 | 9.53e-03 | 3.21e-02 | 1.98e-02 | 61 |
| hsa0411011 | Liver | Cirrhotic | Cell cycle | 61/2530 | 157/8465 | 9.53e-03 | 3.21e-02 | 1.98e-02 | 61 |
| hsa041102 | Liver | HCC | Cell cycle | 106/4020 | 157/8465 | 2.54e-07 | 3.04e-06 | 1.69e-06 | 106 |
| hsa041103 | Liver | HCC | Cell cycle | 106/4020 | 157/8465 | 2.54e-07 | 3.04e-06 | 1.69e-06 | 106 |
| hsa041105 | Lung | IAC | Cell cycle | 30/1053 | 157/8465 | 1.03e-02 | 3.83e-02 | 2.54e-02 | 30 |
| hsa0411012 | Lung | IAC | Cell cycle | 30/1053 | 157/8465 | 1.03e-02 | 3.83e-02 | 2.54e-02 | 30 |
| hsa041108 | Oral cavity | OSCC | Cell cycle | 118/3704 | 157/8465 | 7.15e-16 | 2.66e-14 | 1.35e-14 | 118 |
| hsa0411015 | Oral cavity | OSCC | Cell cycle | 118/3704 | 157/8465 | 7.15e-16 | 2.66e-14 | 1.35e-14 | 118 |
| hsa0411041 | Oral cavity | EOLP | Cell cycle | 42/1218 | 157/8465 | 3.20e-05 | 1.61e-04 | 9.52e-05 | 42 |
| hsa0411051 | Oral cavity | EOLP | Cell cycle | 42/1218 | 157/8465 | 3.20e-05 | 1.61e-04 | 9.52e-05 | 42 |
| hsa0411061 | Oral cavity | NEOLP | Cell cycle | 37/1112 | 157/8465 | 2.29e-04 | 1.58e-03 | 9.95e-04 | 37 |
| hsa0411071 | Oral cavity | NEOLP | Cell cycle | 37/1112 | 157/8465 | 2.29e-04 | 1.58e-03 | 9.95e-04 | 37 |
| Page: 1 2 |
Top |
Cell-cell communication analysis |
| Identification of potential cell-cell interactions between two cell types and their ligand-receptor pairs for different disease states |
| Ligand | Receptor | LRpair | Pathway | Tissue | Disease Stage |
| Page: 1 |
Top |
Single-cell gene regulatory network inference analysis |
| Find out the significant the regulons (TFs) and the target genes of each regulon across cell types for different disease states |
| TF | Cell Type | Tissue | Disease Stage | Target Gene | RSS | Regulon Activity |
| ∗The dot plots of a searched regulon are shown for all cell subpopulations in each disease state of each tissue based on the regulon specific score inferred using pySCENIC and by calculating the average expression. |
| Page: 1 |
Top |
Somatic mutation of malignant transformation related genes |
| Annotation of somatic variants for genes involved in malignant transformation |
| Hugo Symbol | Variant Class | Variant Classification | dbSNP RS | HGVSc | HGVSp | HGVSp Short | SWISSPROT | BIOTYPE | SIFT | PolyPhen | Tumor Sample Barcode | Tissue | Histology | Sex | Age | Stage | Therapy Types | Drugs | Outcome |
| NIPBL | SNV | Missense_Mutation | novel | c.692N>T | p.Ser231Leu | p.S231L | Q6KC79 | protein_coding | tolerated_low_confidence(0.08) | benign(0.039) | TCGA-A2-A0YK-01 | Breast | breast invasive carcinoma | Female | <65 | I/II | Chemotherapy | cytoxan | SD |
| NIPBL | SNV | Missense_Mutation | c.3923N>T | p.Ala1308Val | p.A1308V | Q6KC79 | protein_coding | tolerated(0.31) | benign(0.14) | TCGA-A7-A0CD-01 | Breast | breast invasive carcinoma | Female | >=65 | I/II | Hormone Therapy | arimidex | SD | |
| NIPBL | SNV | Missense_Mutation | novel | c.5410N>T | p.Pro1804Ser | p.P1804S | Q6KC79 | protein_coding | deleterious(0.03) | possibly_damaging(0.615) | TCGA-A7-A26I-01 | Breast | breast invasive carcinoma | Female | >=65 | I/II | Chemotherapy | cytoxan | SD |
| NIPBL | SNV | Missense_Mutation | c.5518N>G | p.Leu1840Val | p.L1840V | Q6KC79 | protein_coding | deleterious(0.04) | probably_damaging(0.922) | TCGA-A8-A06X-01 | Breast | breast invasive carcinoma | Female | >=65 | I/II | Unknown | Unknown | SD | |
| NIPBL | SNV | Missense_Mutation | novel | c.4337N>G | p.Glu1446Gly | p.E1446G | Q6KC79 | protein_coding | deleterious(0) | possibly_damaging(0.835) | TCGA-A8-A097-01 | Breast | breast invasive carcinoma | Female | >=65 | I/II | Hormone Therapy | tamoxiphen | SD |
| NIPBL | SNV | Missense_Mutation | c.792N>A | p.Met264Ile | p.M264I | Q6KC79 | protein_coding | tolerated_low_confidence(0.62) | benign(0) | TCGA-AC-A23H-01 | Breast | breast invasive carcinoma | Female | >=65 | I/II | Unknown | Unknown | PD | |
| NIPBL | SNV | Missense_Mutation | c.1105N>A | p.Asp369Asn | p.D369N | Q6KC79 | protein_coding | deleterious_low_confidence(0.01) | benign(0.038) | TCGA-AC-A23H-01 | Breast | breast invasive carcinoma | Female | >=65 | I/II | Unknown | Unknown | PD | |
| NIPBL | SNV | Missense_Mutation | novel | c.6454C>T | p.Arg2152Trp | p.R2152W | Q6KC79 | protein_coding | deleterious(0) | probably_damaging(0.999) | TCGA-AC-A3W6-01 | Breast | breast invasive carcinoma | Female | >=65 | III/IV | Unknown | Unknown | SD |
| NIPBL | SNV | Missense_Mutation | novel | c.2250N>C | p.Lys750Asn | p.K750N | Q6KC79 | protein_coding | tolerated_low_confidence(0.06) | benign(0.296) | TCGA-AN-A046-01 | Breast | breast invasive carcinoma | Female | >=65 | I/II | Unknown | Unknown | SD |
| NIPBL | SNV | Missense_Mutation | novel | c.5156N>A | p.Arg1719Gln | p.R1719Q | Q6KC79 | protein_coding | tolerated(0.17) | benign(0.005) | TCGA-AN-A046-01 | Breast | breast invasive carcinoma | Female | >=65 | I/II | Unknown | Unknown | SD |
| Page: 1 2 3 4 5 6 7 8 9 10 11 12 13 14 15 16 17 18 19 20 21 22 23 24 25 26 27 28 29 30 31 32 33 34 35 36 37 38 |
Top |
Related drugs of malignant transformation related genes |
| Identification of chemicals and drugs interact with genes involved in malignant transfromation |
| (DGIdb 4.0) |
| Entrez ID | Symbol | Category | Interaction Types | Drug Claim Name | Drug Name | PMIDs |
| Page: 1 |

Copyright 2023-Present -The University of Texas Health Science Center at Houston |