| Tissue | Expression Dynamics | Abbreviation |
| Breast | 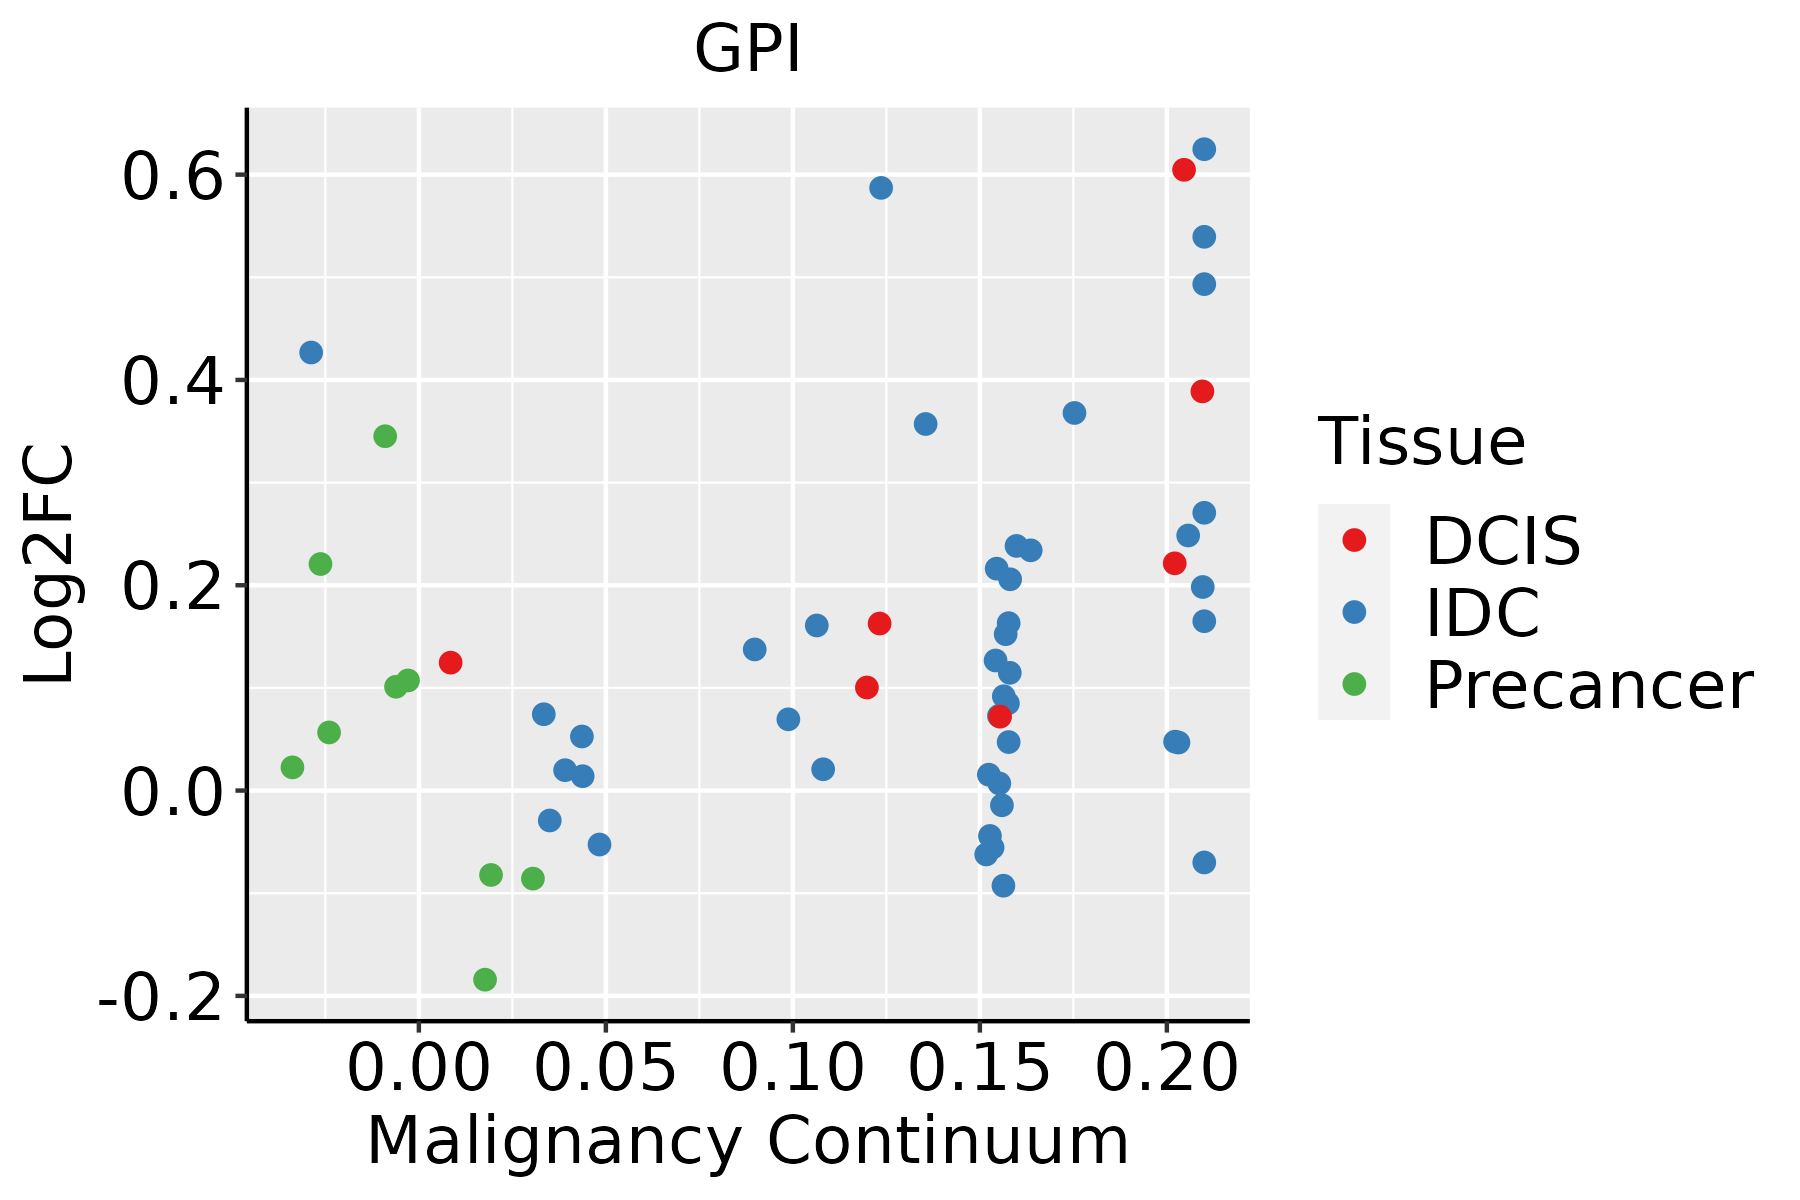 | IDC: Invasive ductal carcinoma |
| DCIS: Ductal carcinoma in situ |
| Precancer(BRCA1-mut): Precancerous lesion from BRCA1 mutation carriers |
| Colorectum (GSE201348) | 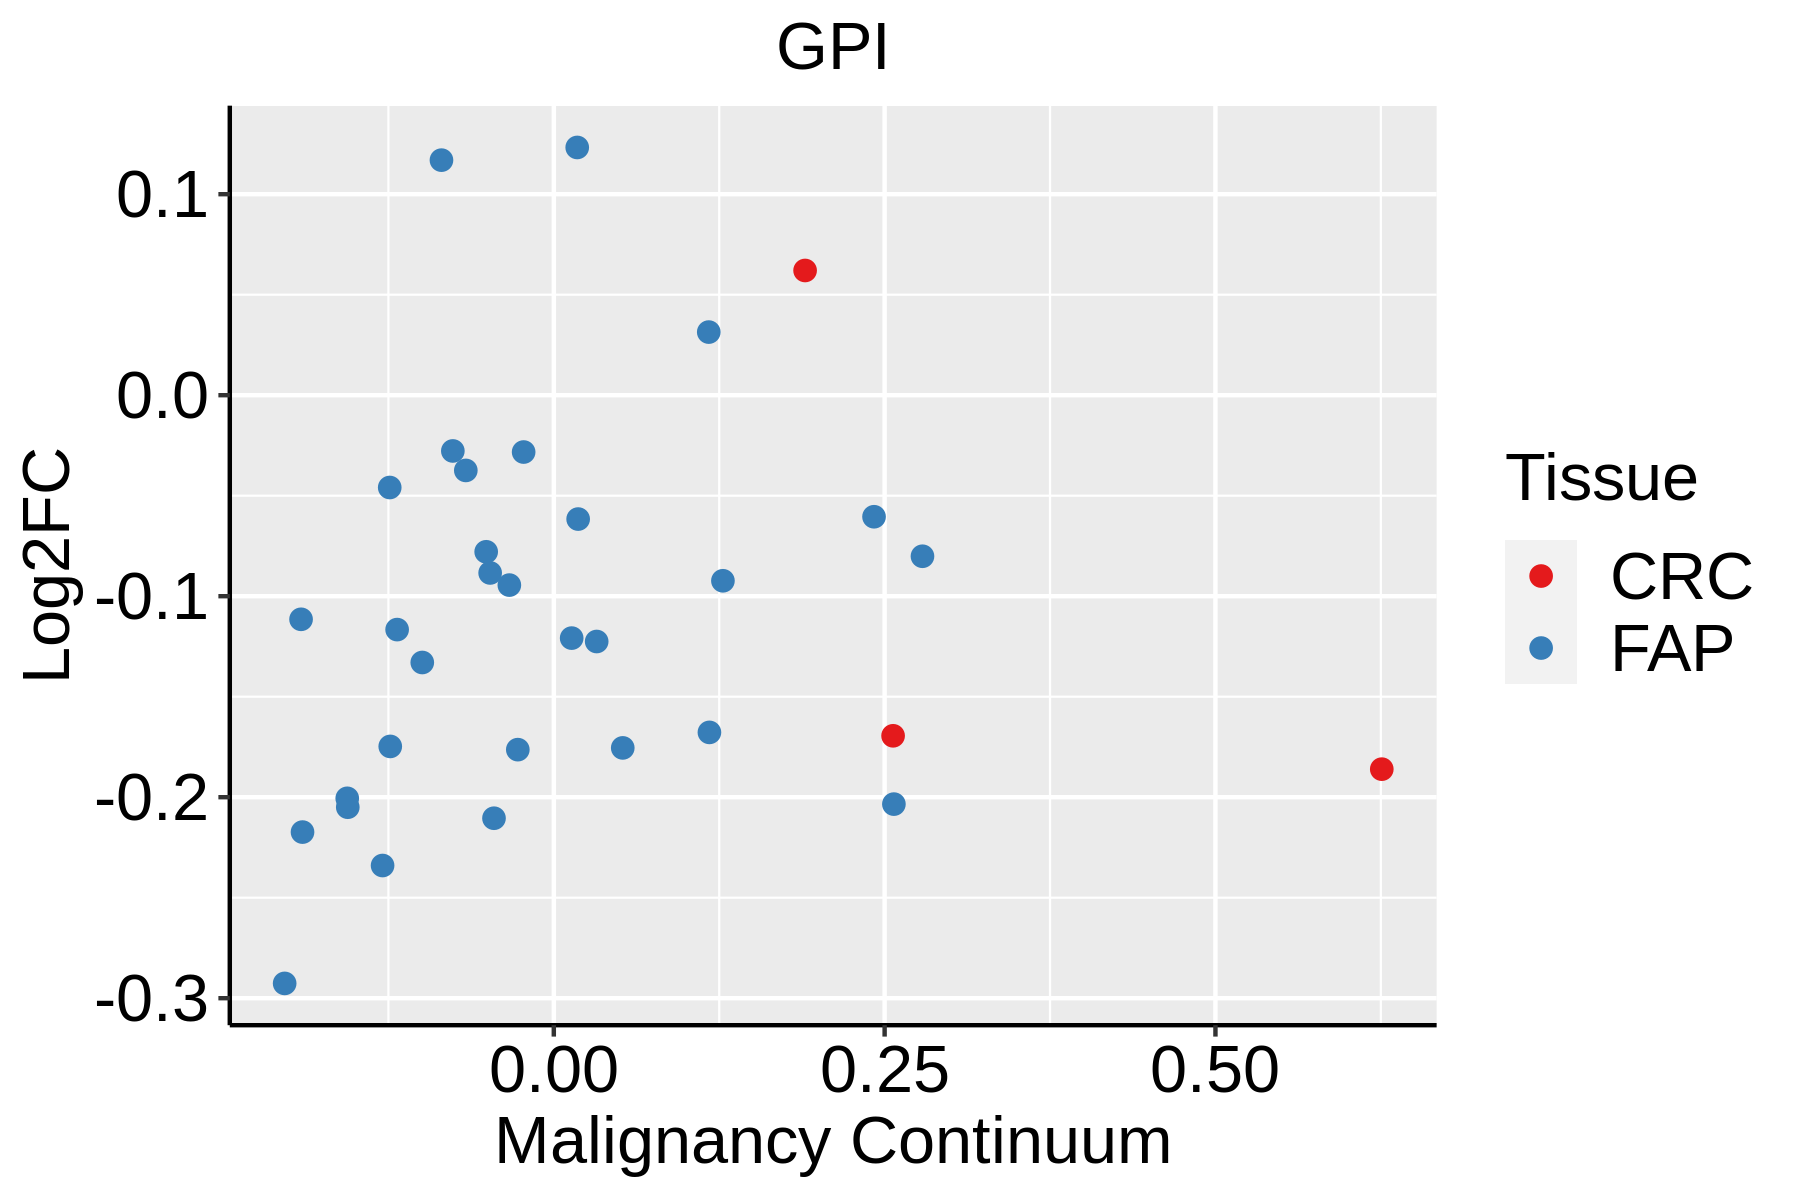 | FAP: Familial adenomatous polyposis |
| CRC: Colorectal cancer |
| Colorectum (HTA11) |  | AD: Adenomas |
| SER: Sessile serrated lesions |
| MSI-H: Microsatellite-high colorectal cancer |
| MSS: Microsatellite stable colorectal cancer |
| Esophagus | 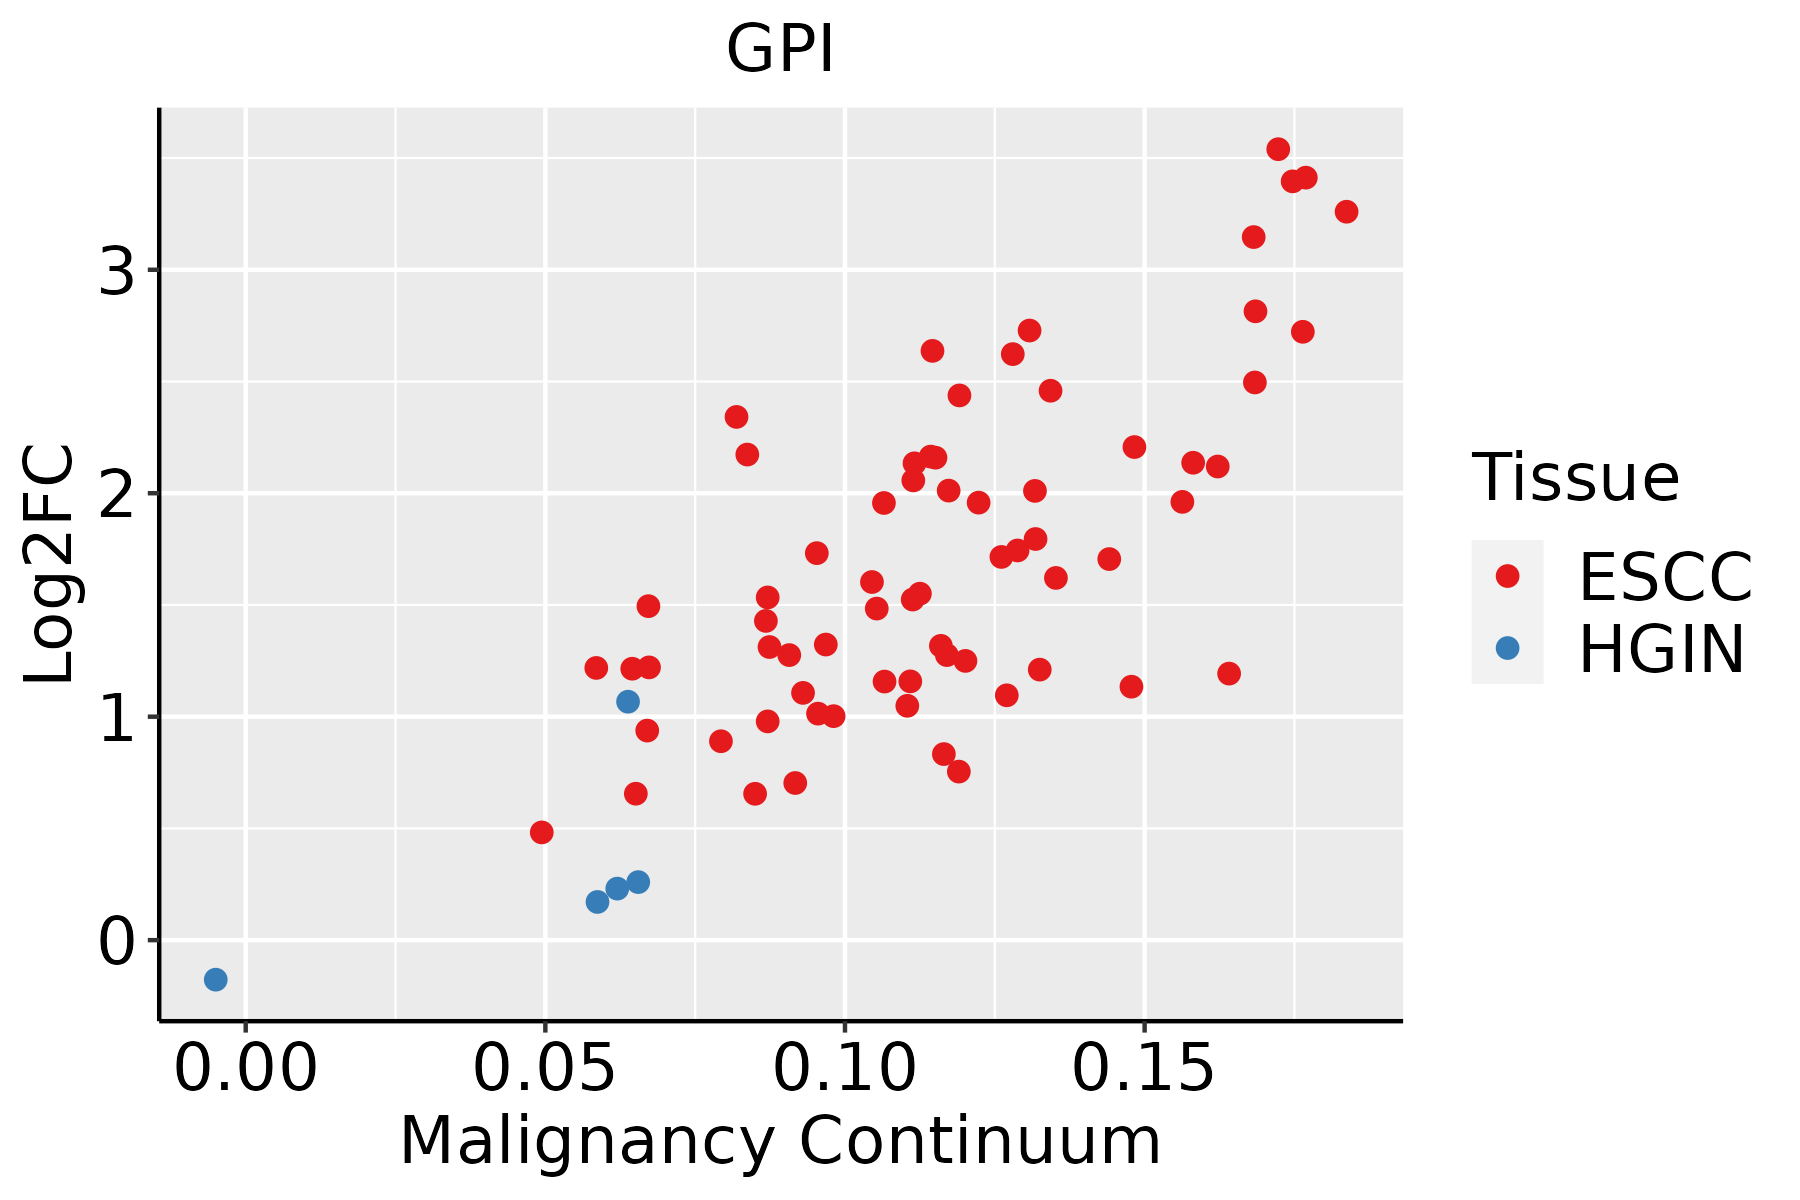 | ESCC: Esophageal squamous cell carcinoma |
| HGIN: High-grade intraepithelial neoplasias |
| LGIN: Low-grade intraepithelial neoplasias |
| Liver | 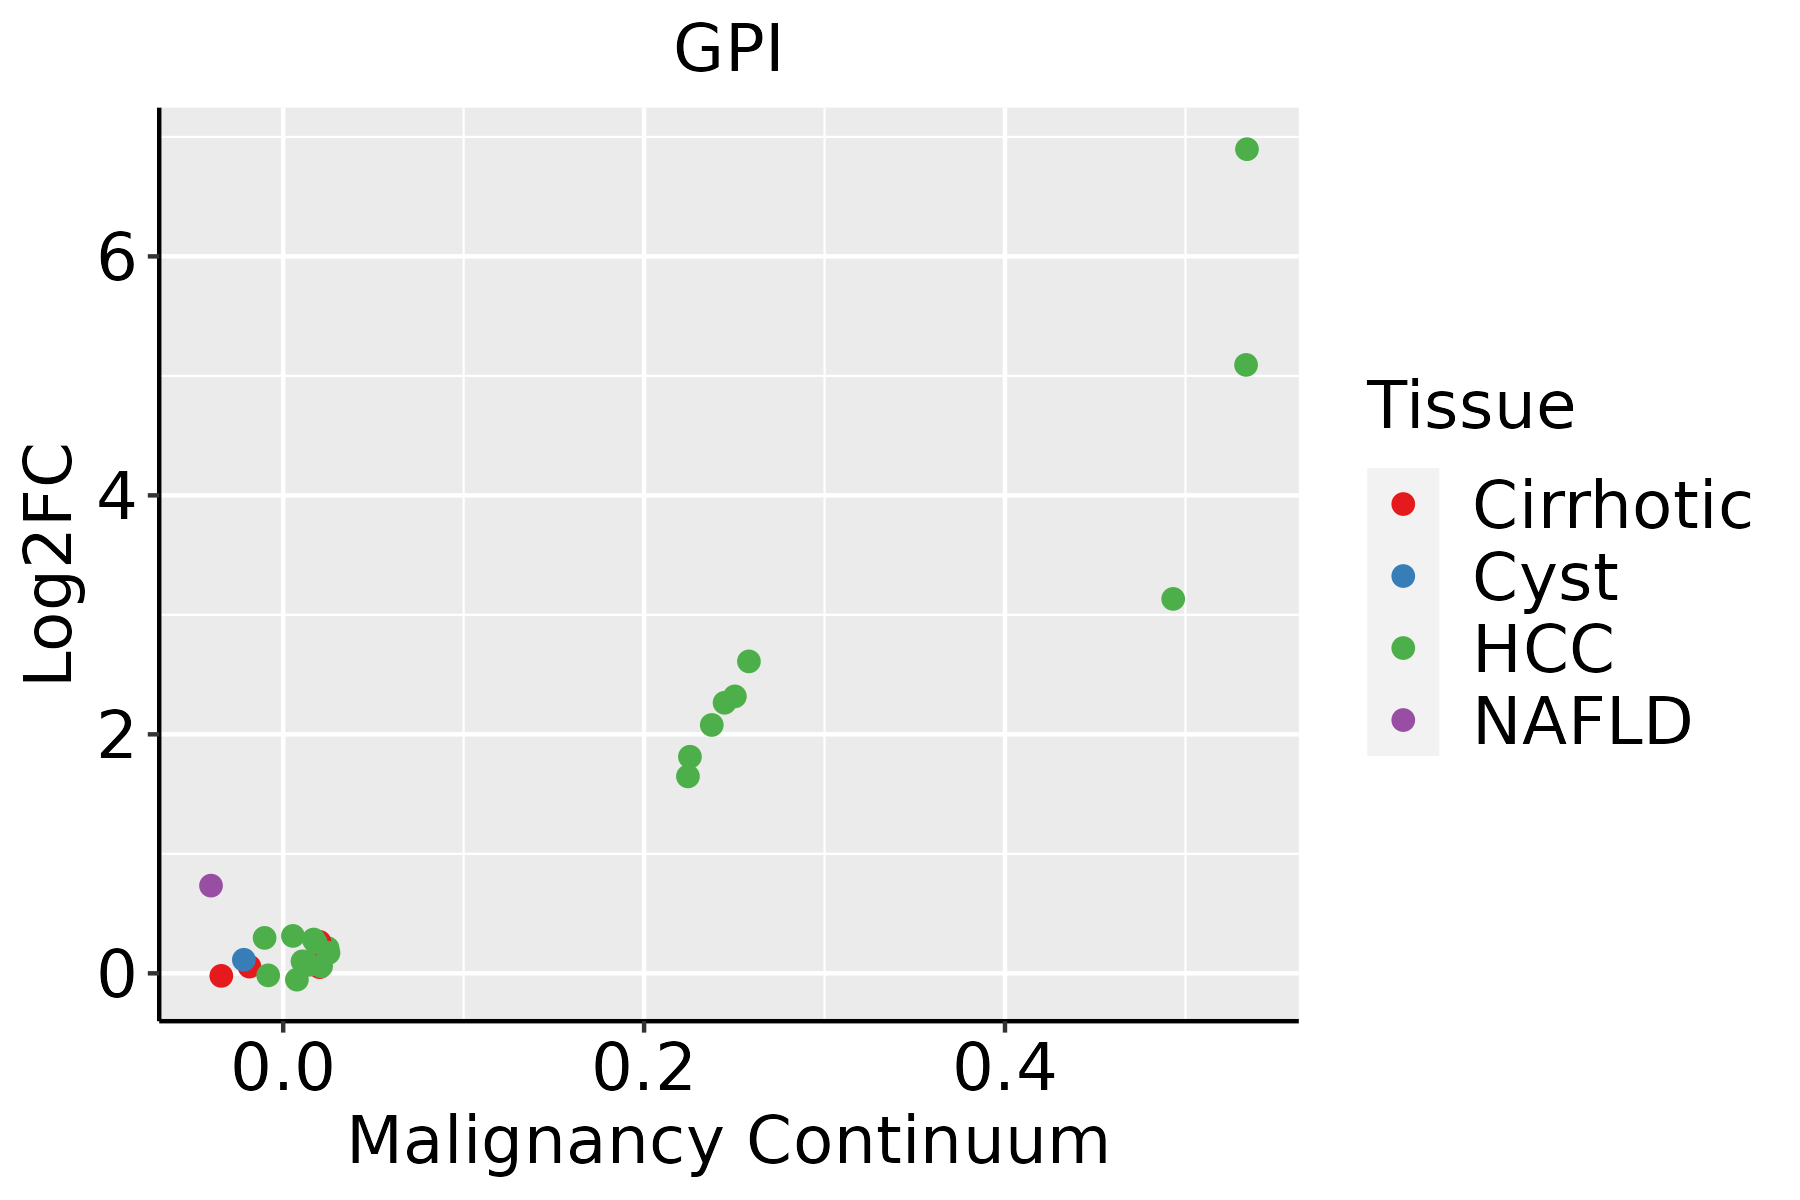 | HCC: Hepatocellular carcinoma |
| NAFLD: Non-alcoholic fatty liver disease |
| Oral Cavity |  | EOLP: Erosive Oral lichen planus |
| LP: leukoplakia |
| NEOLP: Non-erosive oral lichen planus |
| OSCC: Oral squamous cell carcinoma |
| Skin | 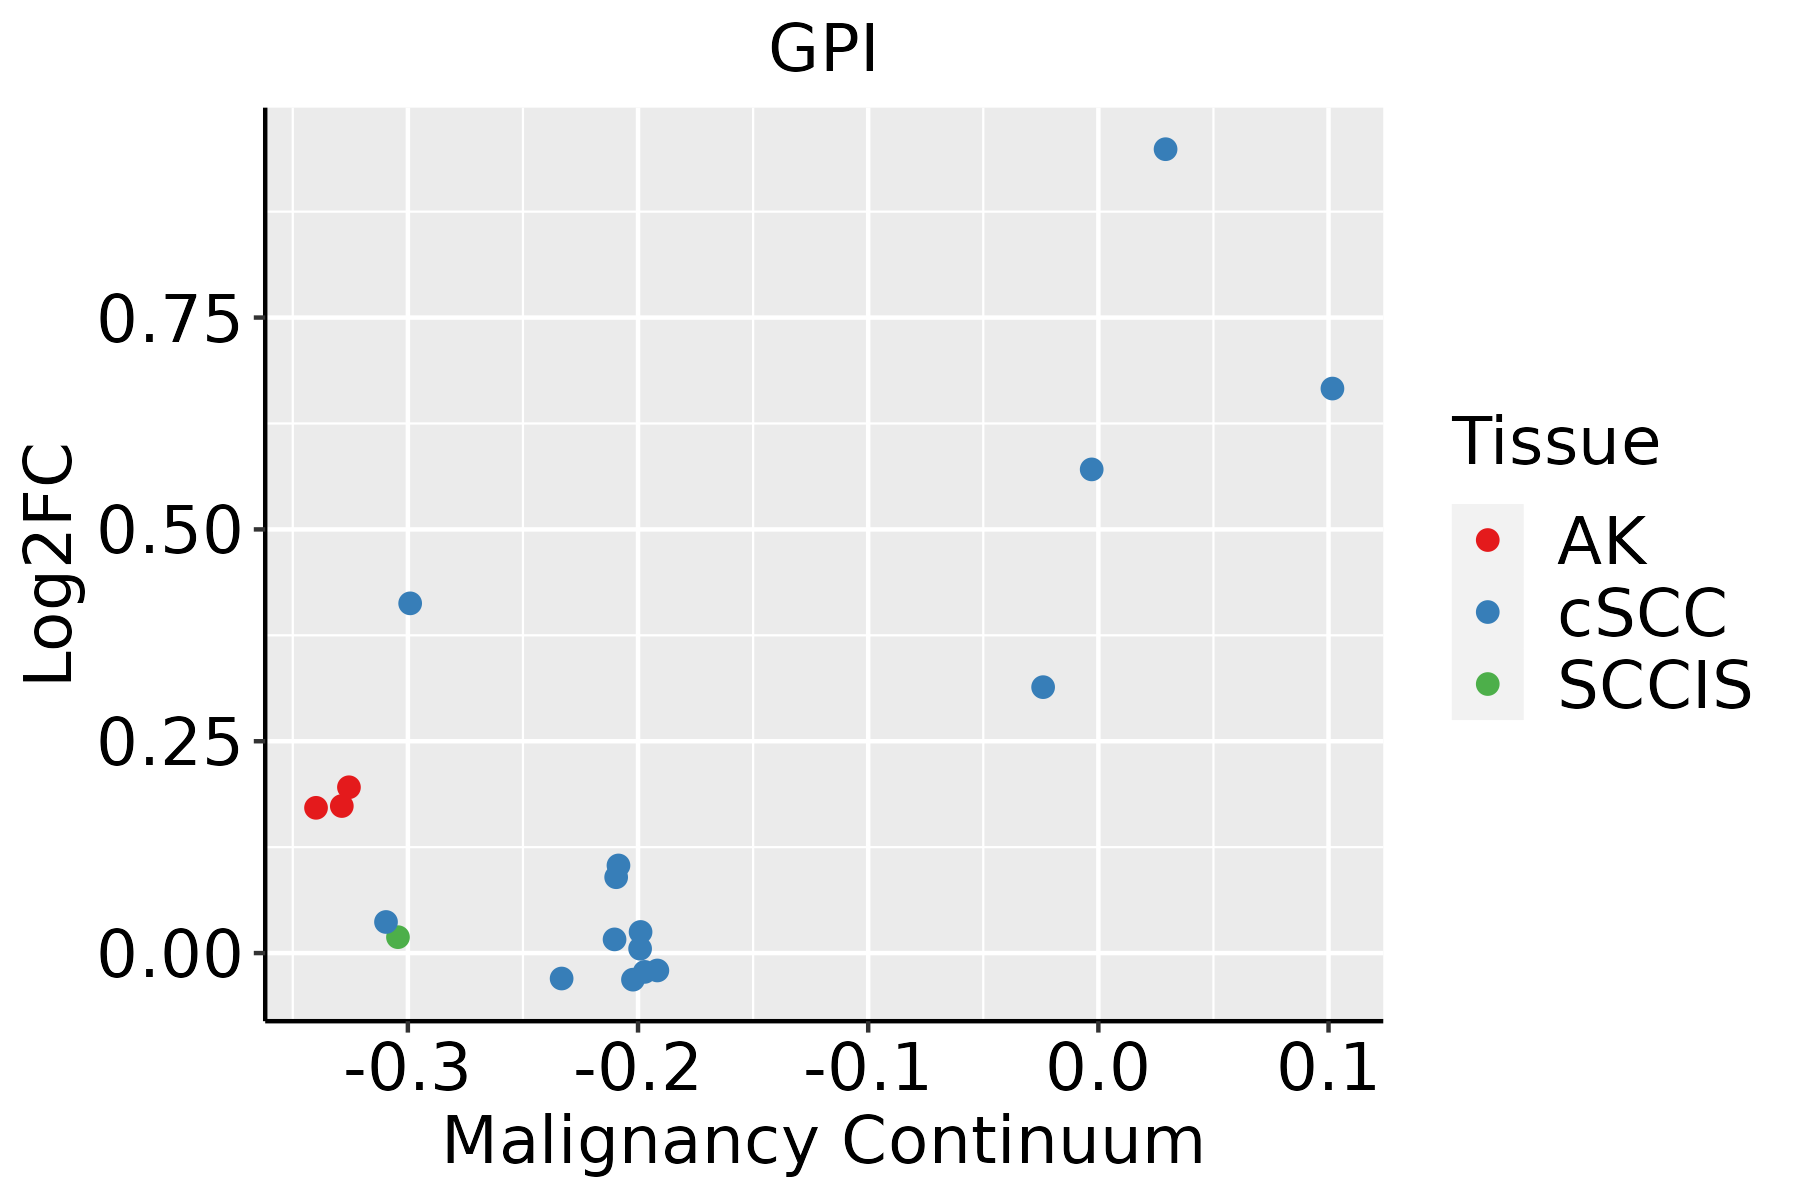 | AK: Actinic keratosis |
| cSCC: Cutaneous squamous cell carcinoma |
| SCCIS:squamous cell carcinoma in situ |
| Thyroid | 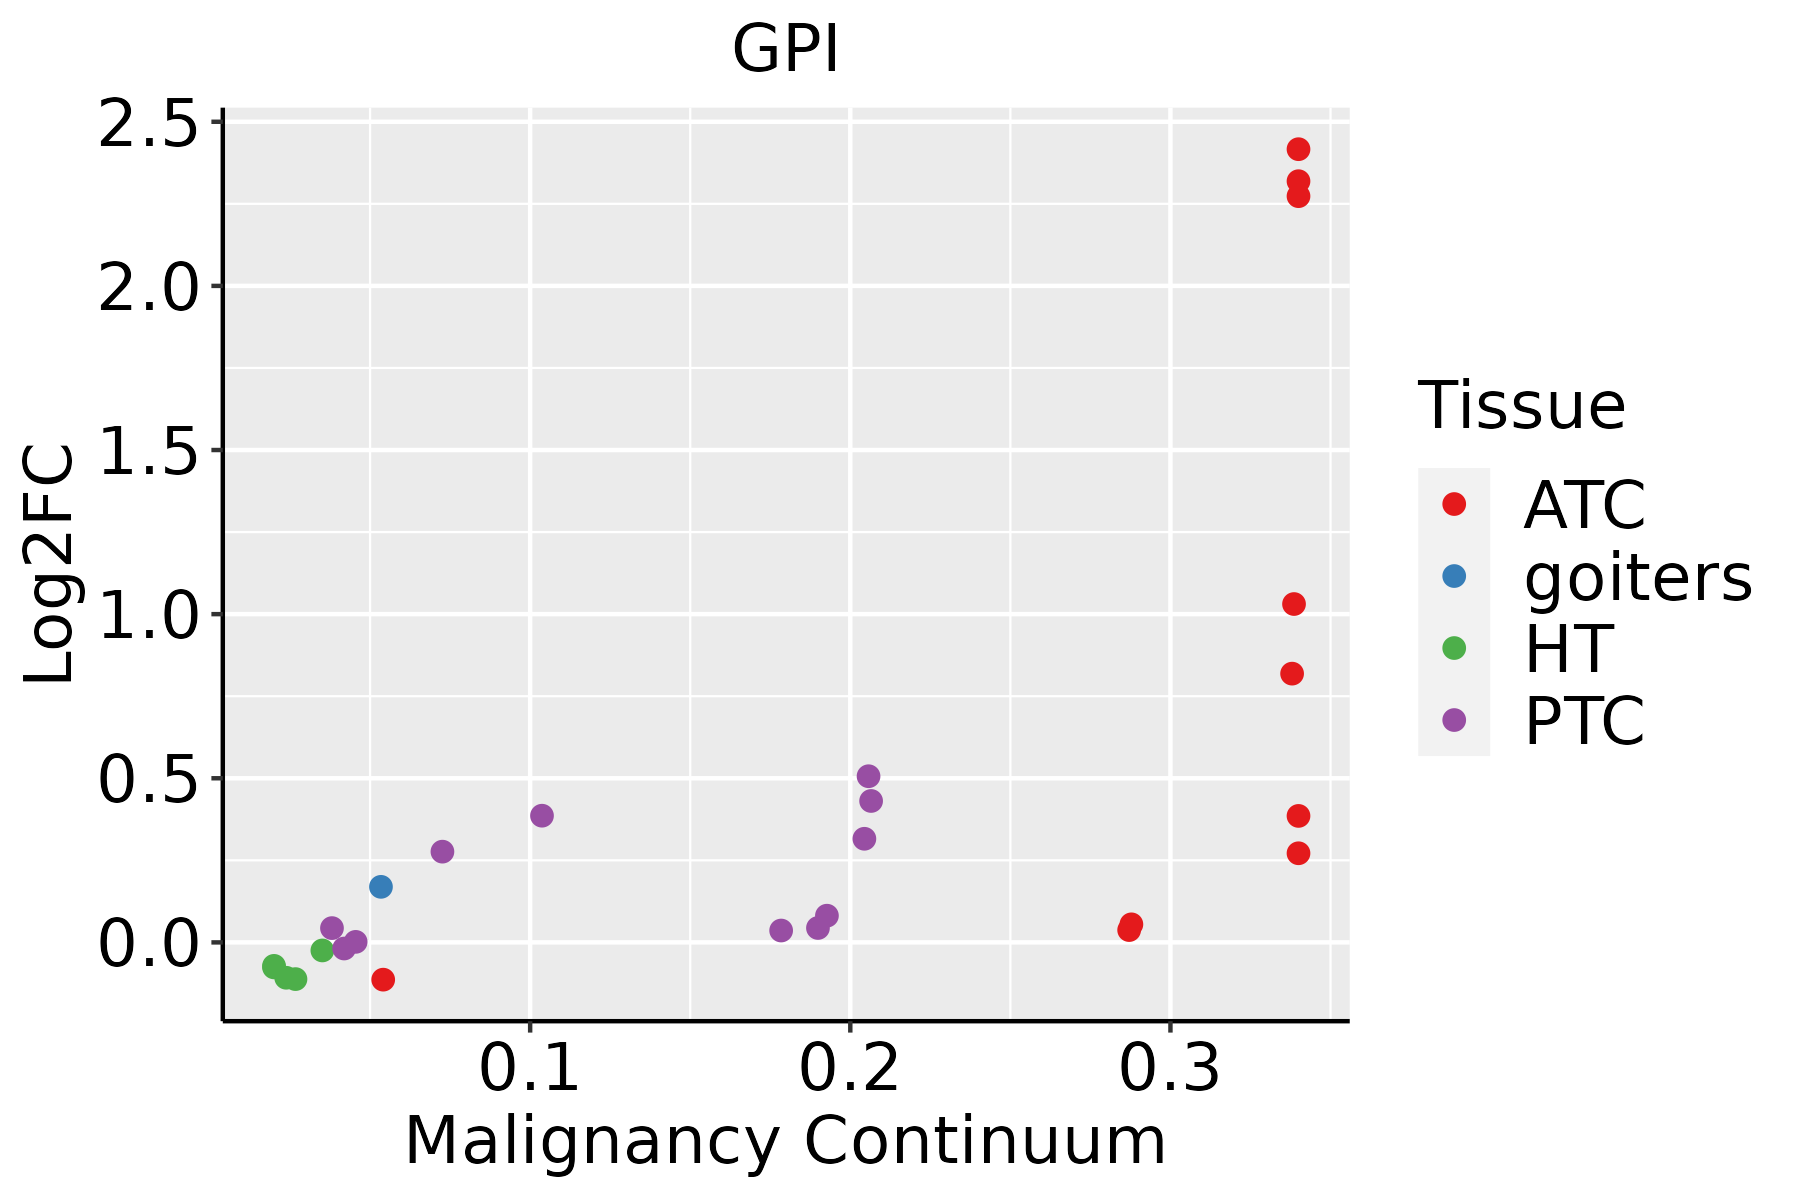 | ATC: Anaplastic thyroid cancer |
| HT: Hashimoto's thyroiditis |
| PTC: Papillary thyroid cancer |
| GO ID | Tissue | Disease Stage | Description | Gene Ratio | Bg Ratio | pvalue | p.adjust | Count |
| GO:001931813 | Oral cavity | LP | hexose metabolic process | 78/4623 | 237/18723 | 2.55e-03 | 1.80e-02 | 78 |
| GO:004693918 | Oral cavity | LP | nucleotide phosphorylation | 38/4623 | 101/18723 | 2.60e-03 | 1.83e-02 | 38 |
| GO:0006163110 | Oral cavity | LP | purine nucleotide metabolic process | 122/4623 | 396/18723 | 3.10e-03 | 2.11e-02 | 122 |
| GO:0009150110 | Oral cavity | LP | purine ribonucleotide metabolic process | 114/4623 | 368/18723 | 3.41e-03 | 2.28e-02 | 114 |
| GO:190121515 | Oral cavity | LP | negative regulation of neuron death | 69/4623 | 208/18723 | 3.50e-03 | 2.34e-02 | 69 |
| GO:000918519 | Oral cavity | LP | ribonucleoside diphosphate metabolic process | 39/4623 | 106/18723 | 3.64e-03 | 2.42e-02 | 39 |
| GO:0048872110 | Oral cavity | LP | homeostasis of number of cells | 87/4623 | 272/18723 | 3.75e-03 | 2.47e-02 | 87 |
| GO:004603118 | Oral cavity | LP | ADP metabolic process | 34/4623 | 90/18723 | 3.93e-03 | 2.56e-02 | 34 |
| GO:001605215 | Oral cavity | LP | carbohydrate catabolic process | 53/4623 | 154/18723 | 4.22e-03 | 2.70e-02 | 53 |
| GO:000616518 | Oral cavity | LP | nucleoside diphosphate phosphorylation | 36/4623 | 99/18723 | 6.29e-03 | 3.71e-02 | 36 |
| GO:00511561 | Oral cavity | LP | glucose 6-phosphate metabolic process | 12/4623 | 24/18723 | 6.44e-03 | 3.78e-02 | 12 |
| GO:000600614 | Oral cavity | LP | glucose metabolic process | 64/4623 | 196/18723 | 7.09e-03 | 3.98e-02 | 64 |
| GO:0009135110 | Oral cavity | LP | purine nucleoside diphosphate metabolic process | 37/4623 | 103/18723 | 7.09e-03 | 3.98e-02 | 37 |
| GO:0009179110 | Oral cavity | LP | purine ribonucleoside diphosphate metabolic process | 37/4623 | 103/18723 | 7.09e-03 | 3.98e-02 | 37 |
| GO:004854528 | Skin | AK | response to steroid hormone | 73/1910 | 339/18723 | 4.51e-10 | 5.24e-08 | 73 |
| GO:000170120 | Skin | AK | in utero embryonic development | 75/1910 | 367/18723 | 3.09e-09 | 2.62e-07 | 75 |
| GO:005254727 | Skin | AK | regulation of peptidase activity | 88/1910 | 461/18723 | 4.65e-09 | 3.44e-07 | 88 |
| GO:004586127 | Skin | AK | negative regulation of proteolysis | 72/1910 | 351/18723 | 5.40e-09 | 3.90e-07 | 72 |
| GO:005254827 | Skin | AK | regulation of endopeptidase activity | 82/1910 | 432/18723 | 2.03e-08 | 1.18e-06 | 82 |
| GO:001063124 | Skin | AK | epithelial cell migration | 70/1910 | 357/18723 | 5.88e-08 | 2.95e-06 | 70 |
| Pathway ID | Tissue | Disease Stage | Description | Gene Ratio | Bg Ratio | pvalue | p.adjust | qvalue | Count |
| hsa0001010 | Breast | Precancer | Glycolysis / Gluconeogenesis | 13/684 | 67/8465 | 2.39e-03 | 1.51e-02 | 1.16e-02 | 13 |
| hsa0001013 | Breast | Precancer | Glycolysis / Gluconeogenesis | 13/684 | 67/8465 | 2.39e-03 | 1.51e-02 | 1.16e-02 | 13 |
| hsa01200 | Colorectum | AD | Carbon metabolism | 55/2092 | 115/8465 | 5.53e-08 | 8.42e-07 | 5.37e-07 | 55 |
| hsa00010 | Colorectum | AD | Glycolysis / Gluconeogenesis | 34/2092 | 67/8465 | 3.63e-06 | 4.34e-05 | 2.77e-05 | 34 |
| hsa012001 | Colorectum | AD | Carbon metabolism | 55/2092 | 115/8465 | 5.53e-08 | 8.42e-07 | 5.37e-07 | 55 |
| hsa000101 | Colorectum | AD | Glycolysis / Gluconeogenesis | 34/2092 | 67/8465 | 3.63e-06 | 4.34e-05 | 2.77e-05 | 34 |
| hsa012002 | Colorectum | SER | Carbon metabolism | 40/1580 | 115/8465 | 2.77e-05 | 3.41e-04 | 2.47e-04 | 40 |
| hsa000102 | Colorectum | SER | Glycolysis / Gluconeogenesis | 24/1580 | 67/8465 | 6.62e-04 | 5.36e-03 | 3.89e-03 | 24 |
| hsa012003 | Colorectum | SER | Carbon metabolism | 40/1580 | 115/8465 | 2.77e-05 | 3.41e-04 | 2.47e-04 | 40 |
| hsa000103 | Colorectum | SER | Glycolysis / Gluconeogenesis | 24/1580 | 67/8465 | 6.62e-04 | 5.36e-03 | 3.89e-03 | 24 |
| hsa012004 | Colorectum | MSS | Carbon metabolism | 43/1875 | 115/8465 | 1.37e-04 | 1.17e-03 | 7.19e-04 | 43 |
| hsa000104 | Colorectum | MSS | Glycolysis / Gluconeogenesis | 28/1875 | 67/8465 | 2.36e-04 | 1.81e-03 | 1.11e-03 | 28 |
| hsa012005 | Colorectum | MSS | Carbon metabolism | 43/1875 | 115/8465 | 1.37e-04 | 1.17e-03 | 7.19e-04 | 43 |
| hsa000105 | Colorectum | MSS | Glycolysis / Gluconeogenesis | 28/1875 | 67/8465 | 2.36e-04 | 1.81e-03 | 1.11e-03 | 28 |
| hsa012006 | Colorectum | FAP | Carbon metabolism | 38/1404 | 115/8465 | 1.04e-05 | 1.44e-04 | 8.76e-05 | 38 |
| hsa000106 | Colorectum | FAP | Glycolysis / Gluconeogenesis | 24/1404 | 67/8465 | 1.05e-04 | 9.46e-04 | 5.76e-04 | 24 |
| hsa01250 | Colorectum | FAP | Biosynthesis of nucleotide sugars | 13/1404 | 37/8465 | 4.79e-03 | 1.91e-02 | 1.16e-02 | 13 |
| hsa012007 | Colorectum | FAP | Carbon metabolism | 38/1404 | 115/8465 | 1.04e-05 | 1.44e-04 | 8.76e-05 | 38 |
| hsa000107 | Colorectum | FAP | Glycolysis / Gluconeogenesis | 24/1404 | 67/8465 | 1.05e-04 | 9.46e-04 | 5.76e-04 | 24 |
| hsa012501 | Colorectum | FAP | Biosynthesis of nucleotide sugars | 13/1404 | 37/8465 | 4.79e-03 | 1.91e-02 | 1.16e-02 | 13 |
| Hugo Symbol | Variant Class | Variant Classification | dbSNP RS | HGVSc | HGVSp | HGVSp Short | SWISSPROT | BIOTYPE | SIFT | PolyPhen | Tumor Sample Barcode | Tissue | Histology | Sex | Age | Stage | Therapy Types | Drugs | Outcome |
| GPI | SNV | Missense_Mutation | novel | c.1173N>T | p.Trp391Cys | p.W391C | P06744 | protein_coding | deleterious_low_confidence(0) | probably_damaging(0.992) | TCGA-AN-A0AK-01 | Breast | breast invasive carcinoma | Female | >=65 | I/II | Unknown | Unknown | SD |
| GPI | SNV | Missense_Mutation | novel | c.781N>G | p.Thr261Ala | p.T261A | P06744 | protein_coding | tolerated_low_confidence(1) | benign(0.009) | TCGA-BH-A0B3-01 | Breast | breast invasive carcinoma | Female | <65 | I/II | Chemotherapy | cyclophosphamide | SD |
| GPI | SNV | Missense_Mutation | | c.1320N>G | p.Phe440Leu | p.F440L | P06744 | protein_coding | deleterious_low_confidence(0.01) | probably_damaging(0.999) | TCGA-C8-A26Y-01 | Breast | breast invasive carcinoma | Female | >=65 | I/II | Unknown | Unknown | SD |
| GPI | insertion | In_Frame_Ins | novel | c.1640_1641insTTTAAGTTCTGAGATACGTGTGGAGAATGTGCAGGTTTGTTA | p.Thr547_Ser548insLeuSerSerGluIleArgValGluAsnValGlnValCysTyr | p.T547_S548insLSSEIRVENVQVCY | P06744 | protein_coding | | | TCGA-A2-A0CP-01 | Breast | breast invasive carcinoma | Female | <65 | I/II | Chemotherapy | cytoxan | SD |
| GPI | insertion | Nonsense_Mutation | novel | c.847_848insCCTGGGTGTGTCCGTGTCTGAGGAGGTGGGCCCTGGCACAGGTAT | p.Gly283delinsAlaTrpValCysProCysLeuArgArgTrpAlaLeuAlaGlnValTer | p.G283delinsAWVCPCLRRWALAQV* | P06744 | protein_coding | | | TCGA-AN-A0FX-01 | Breast | breast invasive carcinoma | Female | <65 | I/II | Unknown | Unknown | SD |
| GPI | SNV | Missense_Mutation | rs199570323 | c.1388N>T | p.Ala463Val | p.A463V | P06744 | protein_coding | deleterious_low_confidence(0.02) | possibly_damaging(0.453) | TCGA-2W-A8YY-01 | Cervix | cervical & endocervical cancer | Female | <65 | I/II | Chemotherapy | cisplatin | CR |
| GPI | SNV | Missense_Mutation | | c.355G>T | p.Ala119Ser | p.A119S | P06744 | protein_coding | tolerated_low_confidence(0.12) | benign(0.162) | TCGA-HM-A3JK-01 | Cervix | cervical & endocervical cancer | Female | <65 | I/II | Chemotherapy | cisplatin | SD |
| GPI | SNV | Missense_Mutation | rs748408705 | c.850C>T | p.Arg284Cys | p.R284C | P06744 | protein_coding | deleterious_low_confidence(0) | probably_damaging(1) | TCGA-AA-A022-01 | Colorectum | colon adenocarcinoma | Female | >=65 | I/II | Unknown | Unknown | SD |
| GPI | SNV | Missense_Mutation | | c.364N>T | p.Arg122Trp | p.R122W | P06744 | protein_coding | deleterious_low_confidence(0.01) | possibly_damaging(0.806) | TCGA-CM-6162-01 | Colorectum | colon adenocarcinoma | Female | <65 | III/IV | Chemotherapy | oxaliplatin | SD |
| GPI | SNV | Missense_Mutation | rs370578920 | c.374N>G | p.Asn125Ser | p.N125S | P06744 | protein_coding | tolerated_low_confidence(1) | benign(0.003) | TCGA-AG-3887-01 | Colorectum | rectum adenocarcinoma | Male | >=65 | I/II | Chemotherapy | irinotecan | SD |


