
|
|||||
|
 | |
| |
| |
| |
| |
| |
|
Gene: EPHA4 |
Gene summary for EPHA4 |
| Gene information | Species | Human | Gene symbol | EPHA4 | Gene ID | 2043 |
| Gene name | EPH receptor A4 | |
| Gene Alias | EK8 | |
| Cytomap | 2q36.1 | |
| Gene Type | protein-coding | GO ID | GO:0000165 | UniProtAcc | A0A024R452 |
Top |
Malignant transformation analysis |
| Identification of the aberrant gene expression in precancerous and cancerous lesions by comparing the gene expression of stem-like cells in diseased tissues with normal stem cells |
| Entrez ID | Symbol | Replicates | Species | Organ | Tissue | Adj P-value | Log2FC | Malignancy |
| 2043 | EPHA4 | CCI_1 | Human | Cervix | CC | 8.54e-10 | 5.45e-01 | 0.528 |
| 2043 | EPHA4 | CCI_3 | Human | Cervix | CC | 5.89e-03 | 5.91e-01 | 0.516 |
| 2043 | EPHA4 | Tumor | Human | Cervix | CC | 2.81e-05 | 2.79e-01 | 0.1241 |
| 2043 | EPHA4 | sample3 | Human | Cervix | CC | 4.30e-11 | 2.96e-01 | 0.1387 |
| 2043 | EPHA4 | T3 | Human | Cervix | CC | 3.59e-13 | 2.98e-01 | 0.1389 |
| 2043 | EPHA4 | HTA11_3410_2000001011 | Human | Colorectum | AD | 2.56e-02 | -2.55e-01 | 0.0155 |
| 2043 | EPHA4 | HTA11_2487_2000001011 | Human | Colorectum | SER | 4.24e-08 | -5.56e-01 | -0.1808 |
| 2043 | EPHA4 | HTA11_696_2000001011 | Human | Colorectum | AD | 6.32e-06 | -3.34e-01 | -0.1464 |
| 2043 | EPHA4 | HTA11_866_2000001011 | Human | Colorectum | AD | 2.83e-03 | -3.27e-01 | -0.1001 |
| 2043 | EPHA4 | HTA11_99999971662_82457 | Human | Colorectum | MSS | 6.22e-21 | -5.84e-01 | 0.3859 |
| 2043 | EPHA4 | HTA11_99999973899_84307 | Human | Colorectum | MSS | 1.55e-06 | -6.21e-01 | 0.2585 |
| 2043 | EPHA4 | HTA11_99999974143_84620 | Human | Colorectum | MSS | 3.32e-30 | -6.35e-01 | 0.3005 |
| 2043 | EPHA4 | F007 | Human | Colorectum | FAP | 1.29e-02 | -3.67e-01 | 0.1176 |
| 2043 | EPHA4 | A002-C-010 | Human | Colorectum | FAP | 1.98e-02 | -1.20e-01 | 0.242 |
| 2043 | EPHA4 | A015-C-203 | Human | Colorectum | FAP | 1.15e-17 | -3.31e-01 | -0.1294 |
| 2043 | EPHA4 | A015-C-204 | Human | Colorectum | FAP | 8.55e-06 | -3.61e-01 | -0.0228 |
| 2043 | EPHA4 | A002-C-201 | Human | Colorectum | FAP | 7.90e-07 | -2.01e-01 | 0.0324 |
| 2043 | EPHA4 | A002-C-203 | Human | Colorectum | FAP | 6.90e-04 | -3.04e-01 | 0.2786 |
| 2043 | EPHA4 | A001-C-119 | Human | Colorectum | FAP | 1.57e-02 | -3.53e-01 | -0.1557 |
| 2043 | EPHA4 | A001-C-108 | Human | Colorectum | FAP | 8.90e-09 | -3.14e-01 | -0.0272 |
| Page: 1 2 3 4 5 6 |
| Tissue | Expression Dynamics | Abbreviation |
| Cervix | 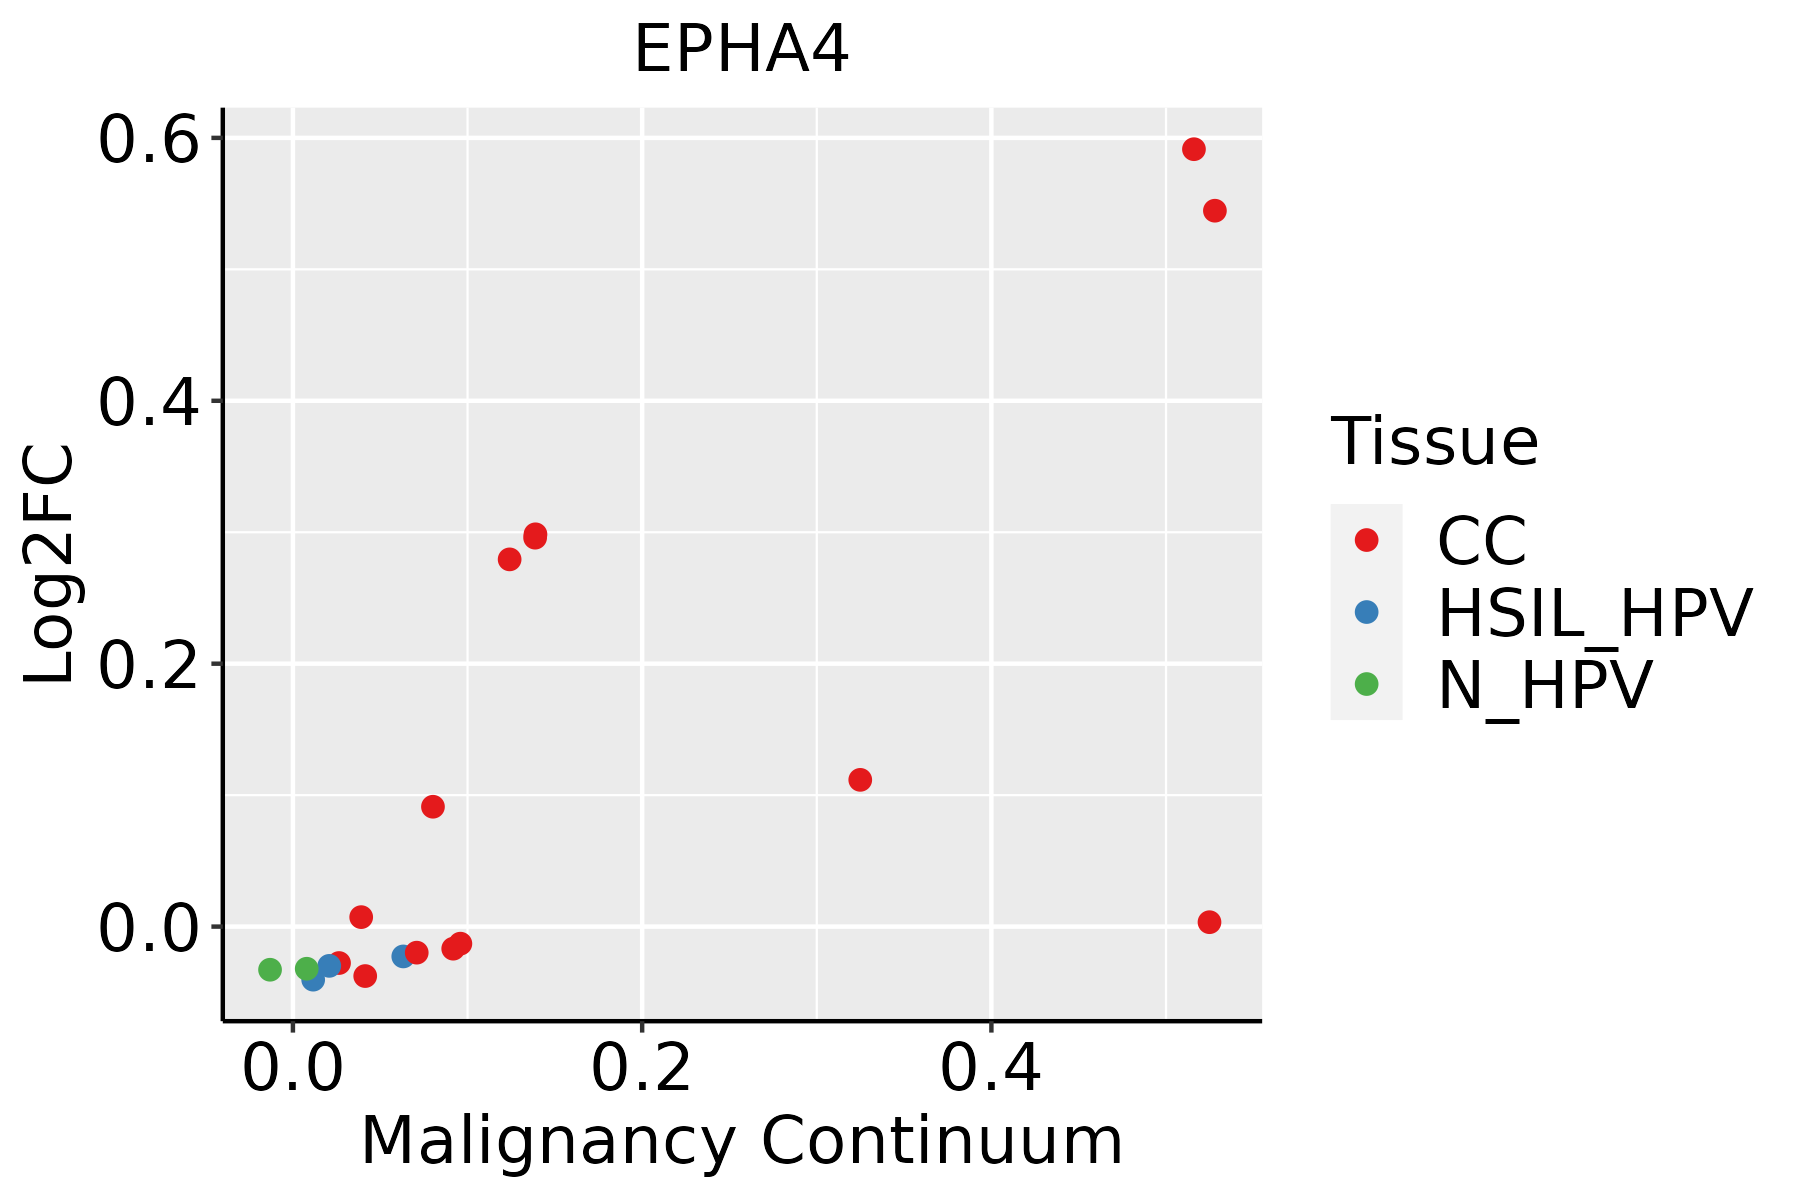 | CC: Cervix cancer |
| HSIL_HPV: HPV-infected high-grade squamous intraepithelial lesions | ||
| N_HPV: HPV-infected normal cervix | ||
| Colorectum (GSE201348) | 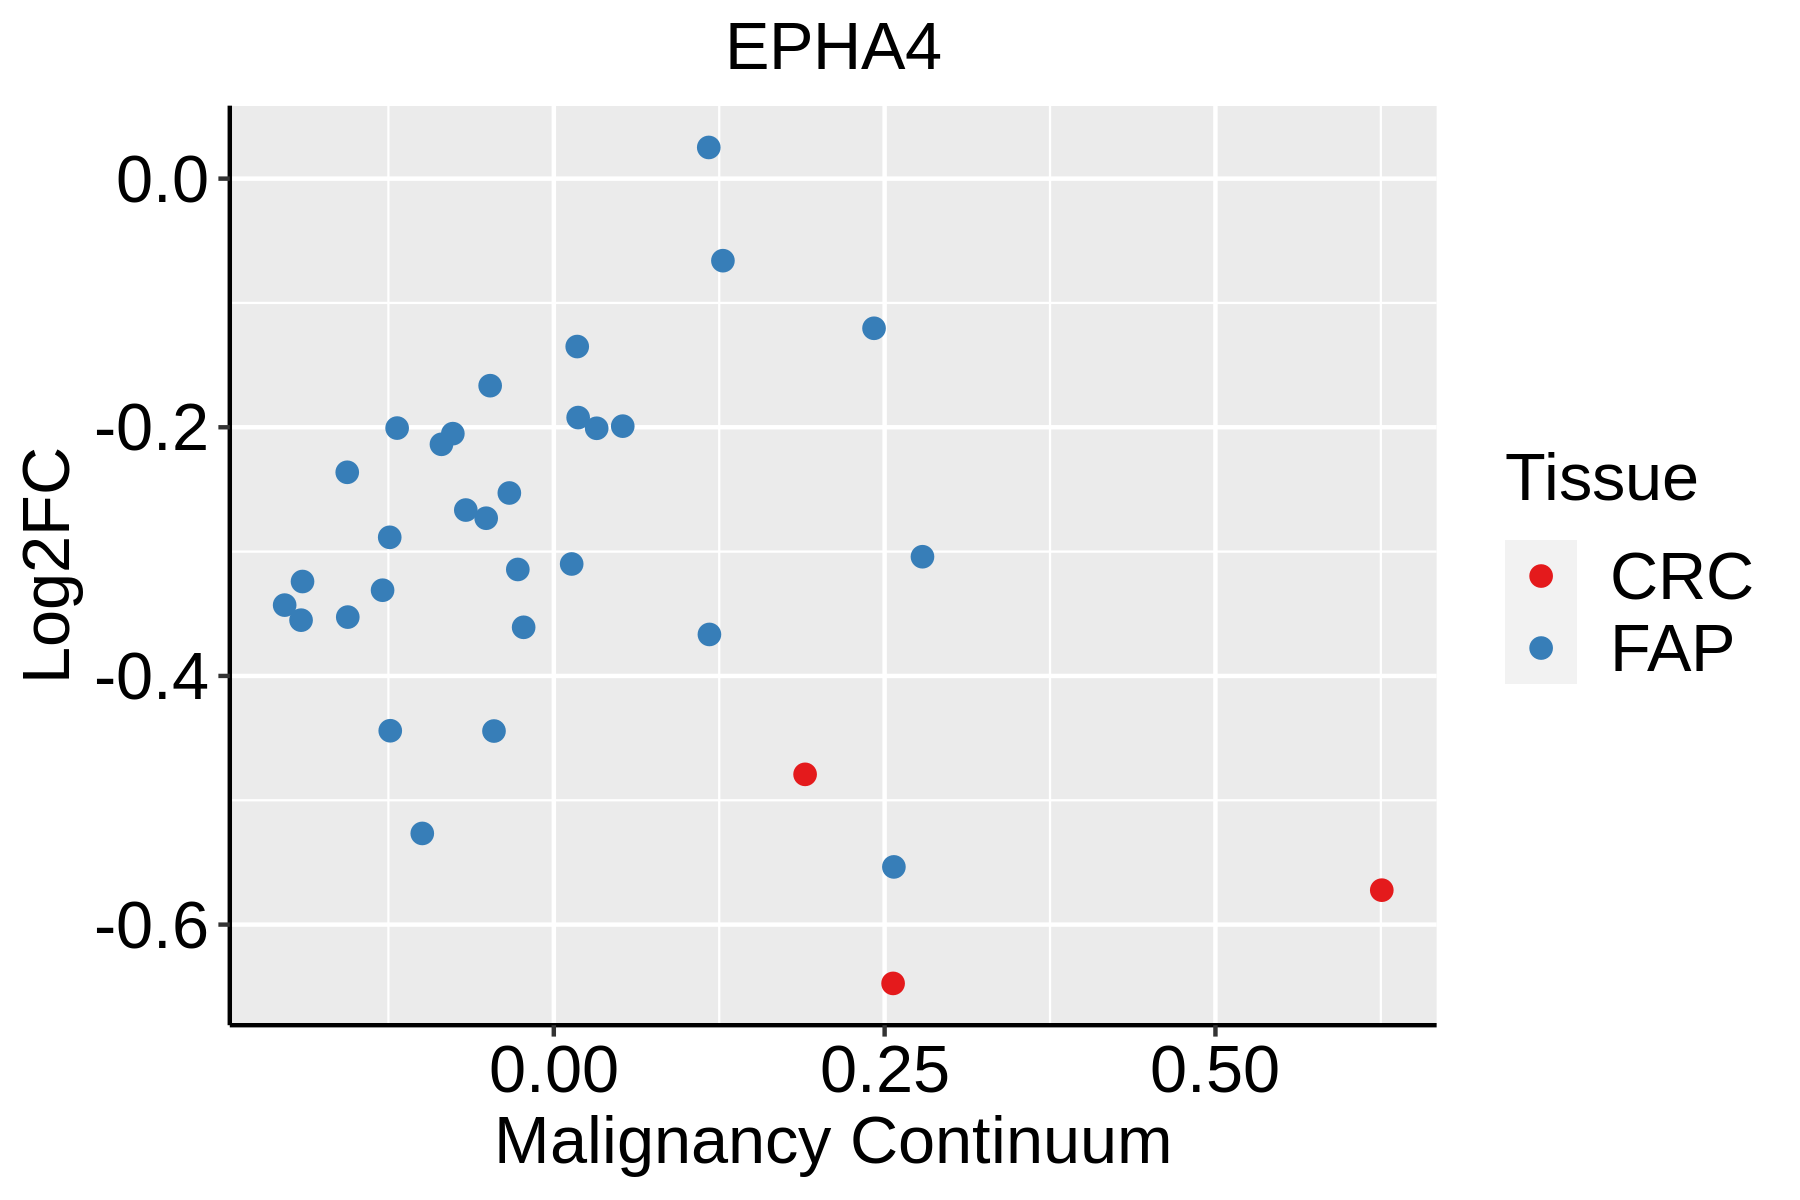 | FAP: Familial adenomatous polyposis |
| CRC: Colorectal cancer | ||
| Colorectum (HTA11) |  | AD: Adenomas |
| SER: Sessile serrated lesions | ||
| MSI-H: Microsatellite-high colorectal cancer | ||
| MSS: Microsatellite stable colorectal cancer | ||
| Esophagus |  | ESCC: Esophageal squamous cell carcinoma |
| HGIN: High-grade intraepithelial neoplasias | ||
| LGIN: Low-grade intraepithelial neoplasias | ||
| Lung | 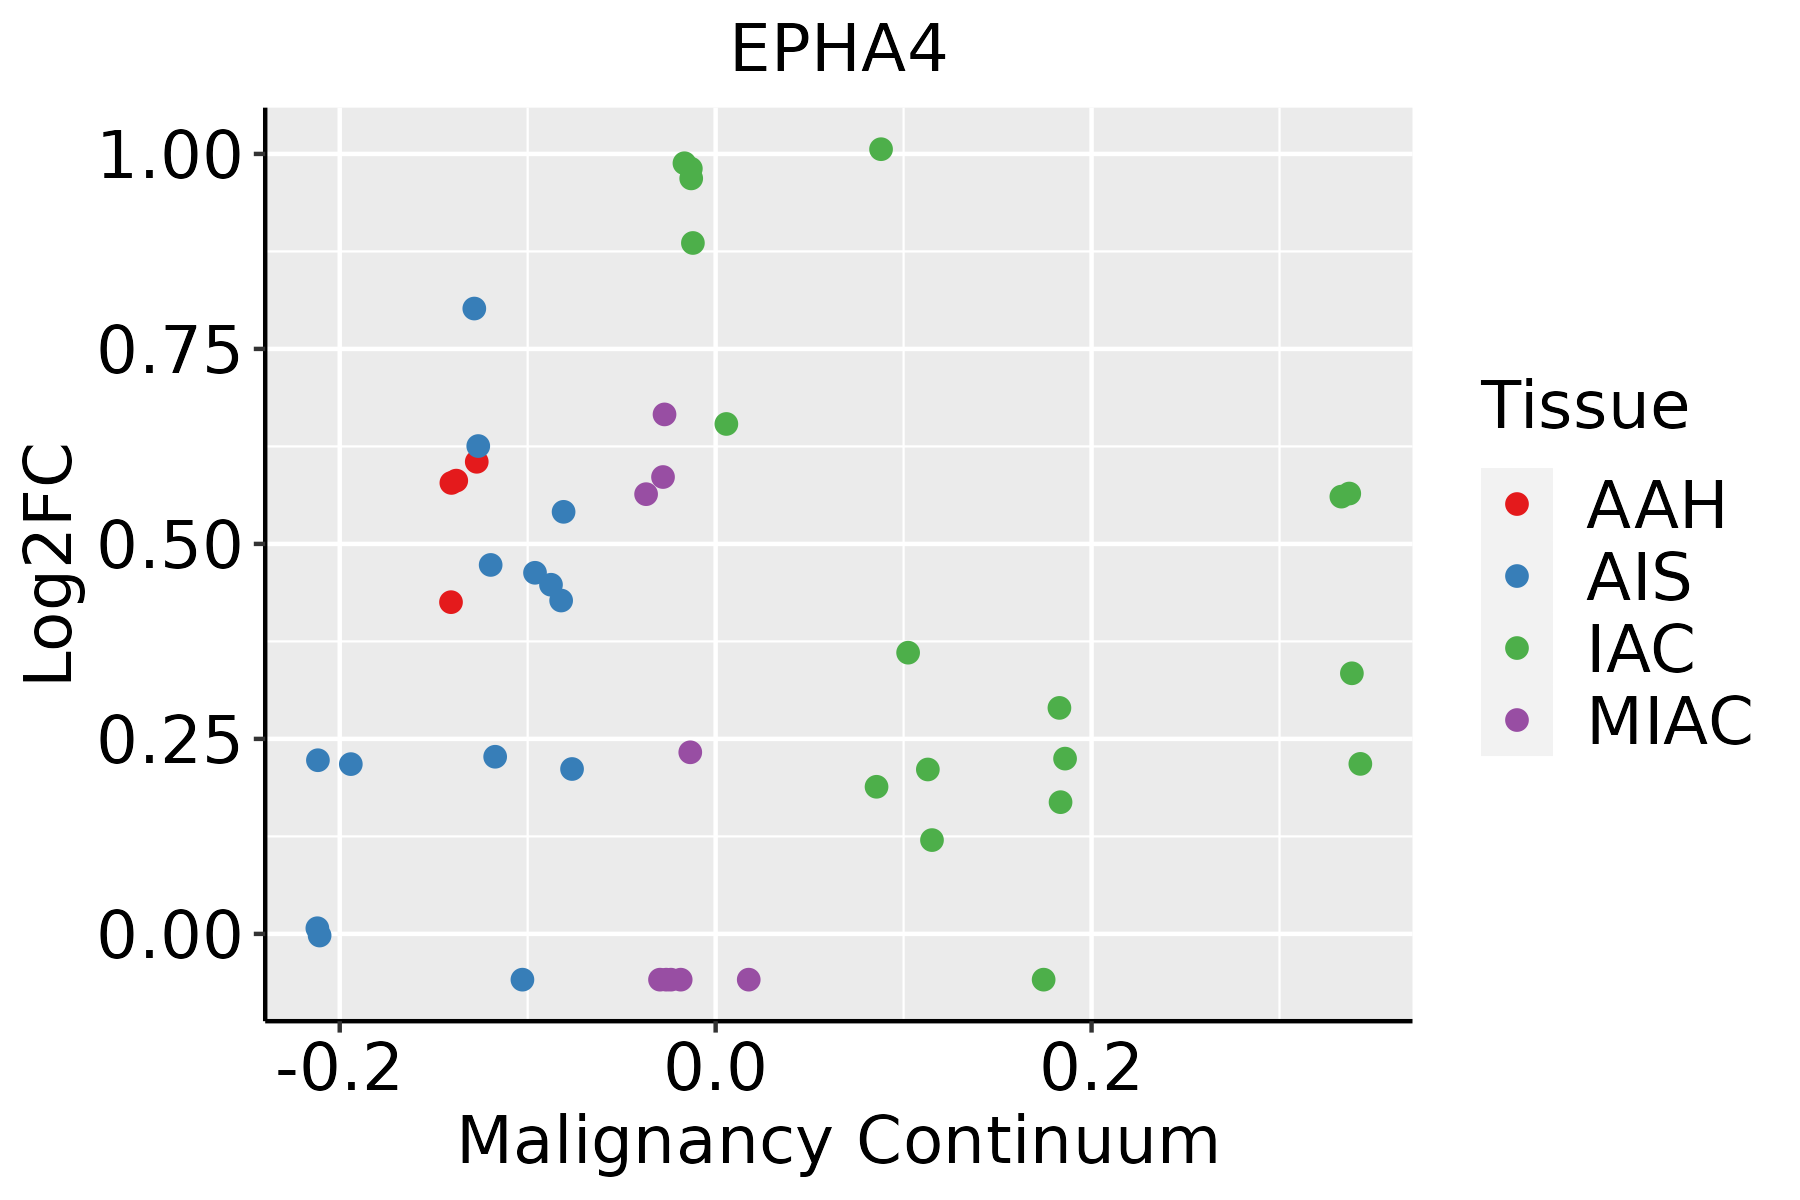 | AAH: Atypical adenomatous hyperplasia |
| AIS: Adenocarcinoma in situ | ||
| IAC: Invasive lung adenocarcinoma | ||
| MIA: Minimally invasive adenocarcinoma | ||
| Skin | 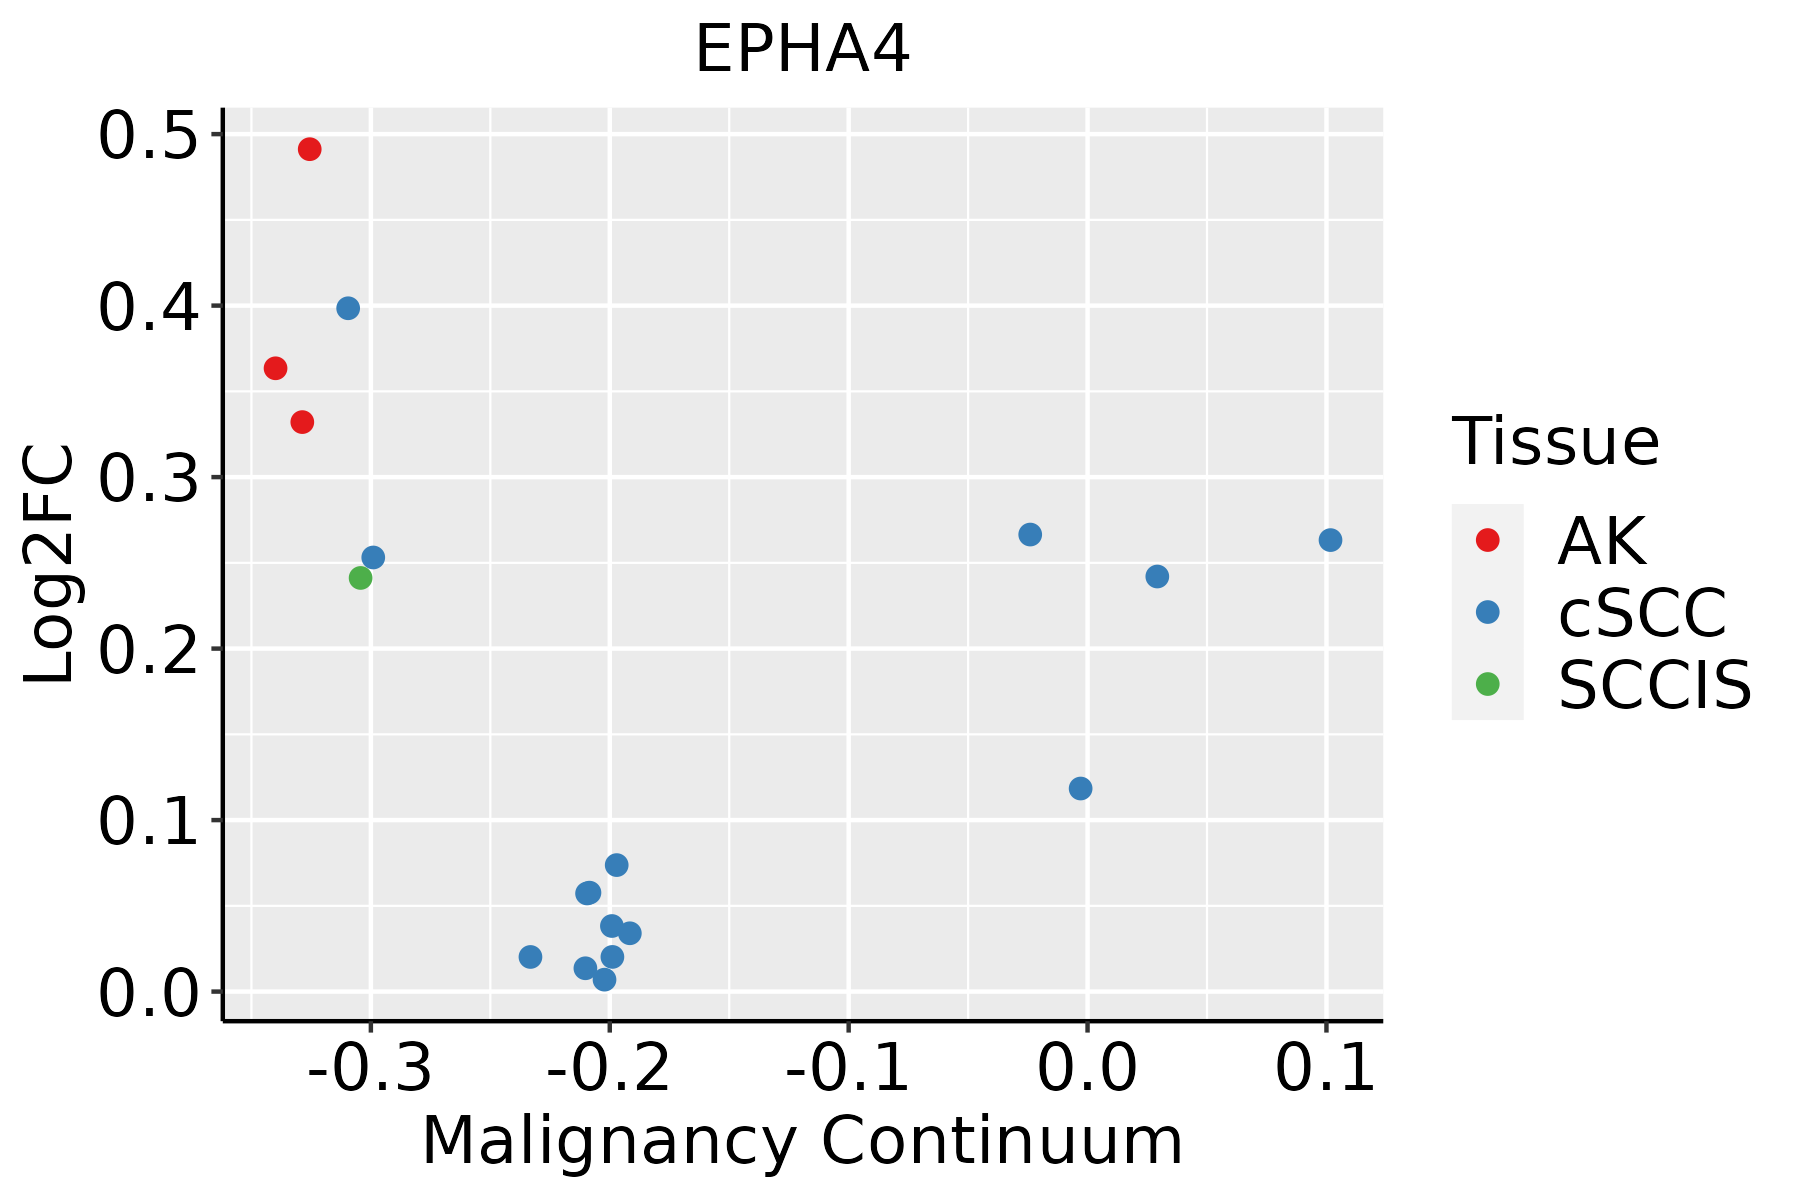 | AK: Actinic keratosis |
| cSCC: Cutaneous squamous cell carcinoma | ||
| SCCIS:squamous cell carcinoma in situ | ||
| Thyroid | 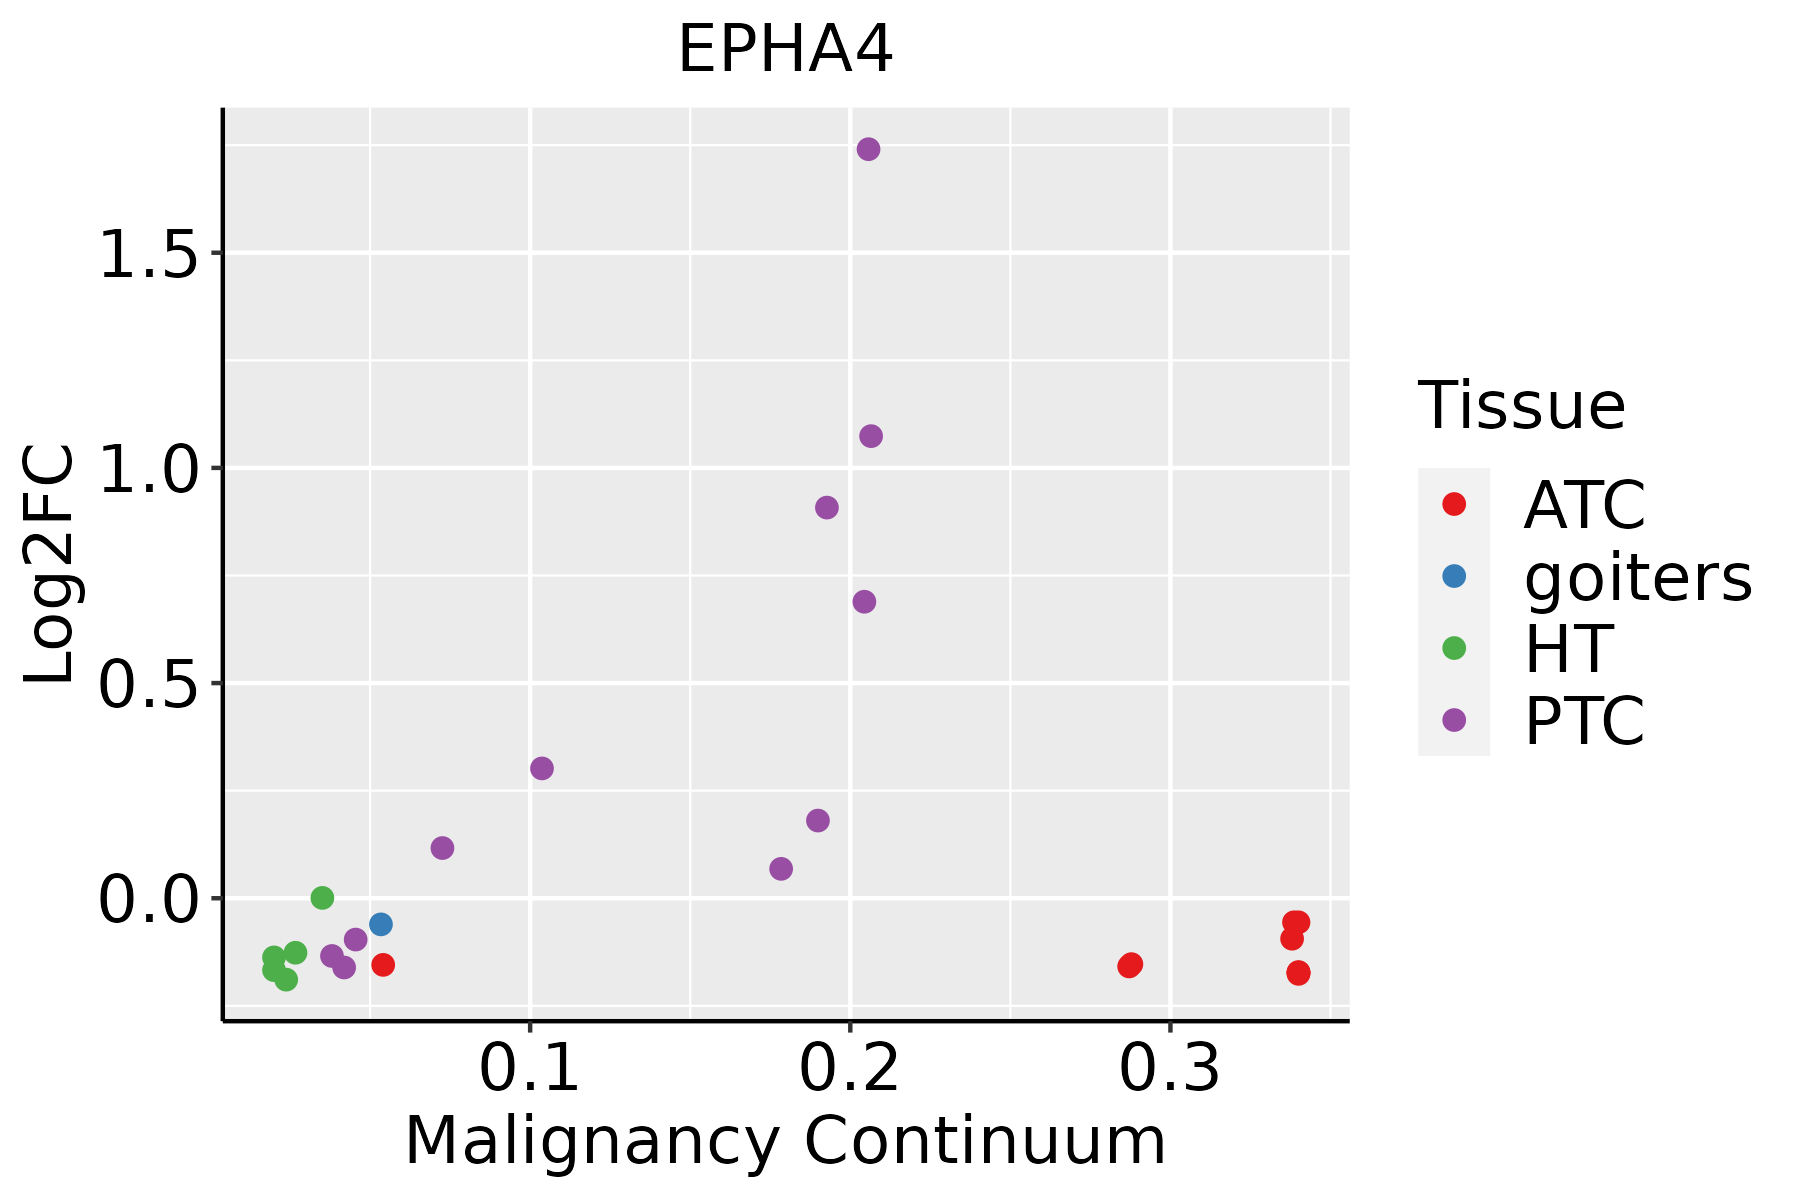 | ATC: Anaplastic thyroid cancer |
| HT: Hashimoto's thyroiditis | ||
| PTC: Papillary thyroid cancer |
| ∗log2FC in expression of this searched gene in stem-like cells from each diseased tissue sample relative to stem-like cells in normal samples in each tissue plotted against the malignancy continuum. Samples are colored based on if they are from different disease stage. |
Top |
Malignant transformation related pathway analysis |
| Find out the enriched GO biological processes and KEGG pathways involved in transition from healthy to precancer to cancer |
| Tissue | Disease Stage | Enriched GO biological Processes |
| Colorectum | AD |  |
| Colorectum | SER |  |
| Colorectum | MSS |  |
| Colorectum | MSI-H |  |
| Colorectum | FAP |  |
| ∗Top 15 enriched GO BP terms are showed in the bar plot of each disease state in each tissue. Each row represents a significant GO biological process which is colored according to the -log10(p.adjust). |
| Page: 1 2 3 4 5 6 7 8 9 |
| GO ID | Tissue | Disease Stage | Description | Gene Ratio | Bg Ratio | pvalue | p.adjust | Count |
| GO:005076715 | Thyroid | HT | regulation of neurogenesis | 38/1272 | 364/18723 | 5.56e-03 | 3.64e-02 | 38 |
| GO:00429875 | Thyroid | HT | amyloid precursor protein catabolic process | 11/1272 | 68/18723 | 5.83e-03 | 3.74e-02 | 11 |
| GO:19052459 | Thyroid | HT | regulation of aspartic-type peptidase activity | 4/1272 | 12/18723 | 6.75e-03 | 4.16e-02 | 4 |
| GO:0042176113 | Thyroid | PTC | regulation of protein catabolic process | 231/5968 | 391/18723 | 4.76e-29 | 2.14e-26 | 231 |
| GO:1903362113 | Thyroid | PTC | regulation of cellular protein catabolic process | 162/5968 | 255/18723 | 1.62e-25 | 5.12e-23 | 162 |
| GO:1903050113 | Thyroid | PTC | regulation of proteolysis involved in cellular protein catabolic process | 140/5968 | 221/18723 | 4.63e-22 | 1.01e-19 | 140 |
| GO:0031647113 | Thyroid | PTC | regulation of protein stability | 174/5968 | 298/18723 | 2.05e-21 | 4.05e-19 | 174 |
| GO:0022411113 | Thyroid | PTC | cellular component disassembly | 232/5968 | 443/18723 | 1.36e-19 | 1.75e-17 | 232 |
| GO:0051098113 | Thyroid | PTC | regulation of binding | 195/5968 | 363/18723 | 3.21e-18 | 3.37e-16 | 195 |
| GO:0045862113 | Thyroid | PTC | positive regulation of proteolysis | 198/5968 | 372/18723 | 6.68e-18 | 6.91e-16 | 198 |
| GO:0050821113 | Thyroid | PTC | protein stabilization | 115/5968 | 191/18723 | 5.67e-16 | 4.31e-14 | 115 |
| GO:0022604112 | Thyroid | PTC | regulation of cell morphogenesis | 165/5968 | 309/18723 | 2.60e-15 | 1.82e-13 | 165 |
| GO:0034250113 | Thyroid | PTC | positive regulation of cellular amide metabolic process | 98/5968 | 162/18723 | 5.26e-14 | 3.04e-12 | 98 |
| GO:0051099113 | Thyroid | PTC | positive regulation of binding | 100/5968 | 173/18723 | 1.56e-12 | 6.96e-11 | 100 |
| GO:0031346110 | Thyroid | PTC | positive regulation of cell projection organization | 173/5968 | 353/18723 | 1.09e-11 | 4.40e-10 | 173 |
| GO:0031330113 | Thyroid | PTC | negative regulation of cellular catabolic process | 131/5968 | 262/18723 | 6.63e-10 | 2.03e-08 | 131 |
| GO:0009895113 | Thyroid | PTC | negative regulation of catabolic process | 154/5968 | 320/18723 | 7.77e-10 | 2.31e-08 | 154 |
| GO:1901653111 | Thyroid | PTC | cellular response to peptide | 169/5968 | 359/18723 | 9.81e-10 | 2.89e-08 | 169 |
| GO:0045860111 | Thyroid | PTC | positive regulation of protein kinase activity | 176/5968 | 386/18723 | 8.89e-09 | 2.17e-07 | 176 |
| GO:006099616 | Thyroid | PTC | dendritic spine development | 59/5968 | 99/18723 | 1.18e-08 | 2.83e-07 | 59 |
| Page: 1 2 3 4 5 6 7 8 9 10 11 12 13 14 15 16 17 18 19 20 21 22 23 24 25 26 27 28 29 30 31 32 33 34 35 36 37 38 39 40 41 42 43 44 45 46 |
| Pathway ID | Tissue | Disease Stage | Description | Gene Ratio | Bg Ratio | pvalue | p.adjust | qvalue | Count |
| hsa043609 | Cervix | CC | Axon guidance | 47/1267 | 182/8465 | 8.13e-05 | 5.38e-04 | 3.18e-04 | 47 |
| hsa0436012 | Cervix | CC | Axon guidance | 47/1267 | 182/8465 | 8.13e-05 | 5.38e-04 | 3.18e-04 | 47 |
| hsa04360 | Colorectum | AD | Axon guidance | 61/2092 | 182/8465 | 4.36e-03 | 2.17e-02 | 1.38e-02 | 61 |
| hsa043601 | Colorectum | AD | Axon guidance | 61/2092 | 182/8465 | 4.36e-03 | 2.17e-02 | 1.38e-02 | 61 |
| hsa043602 | Colorectum | MSS | Axon guidance | 54/1875 | 182/8465 | 1.03e-02 | 3.69e-02 | 2.26e-02 | 54 |
| hsa043603 | Colorectum | MSS | Axon guidance | 54/1875 | 182/8465 | 1.03e-02 | 3.69e-02 | 2.26e-02 | 54 |
| hsa043604 | Colorectum | FAP | Axon guidance | 47/1404 | 182/8465 | 9.09e-04 | 5.20e-03 | 3.16e-03 | 47 |
| hsa043605 | Colorectum | FAP | Axon guidance | 47/1404 | 182/8465 | 9.09e-04 | 5.20e-03 | 3.16e-03 | 47 |
| hsa043606 | Colorectum | CRC | Axon guidance | 43/1091 | 182/8465 | 4.38e-05 | 8.70e-04 | 5.90e-04 | 43 |
| hsa043607 | Colorectum | CRC | Axon guidance | 43/1091 | 182/8465 | 4.38e-05 | 8.70e-04 | 5.90e-04 | 43 |
| hsa0436016 | Esophagus | ESCC | Axon guidance | 108/4205 | 182/8465 | 5.13e-03 | 1.30e-02 | 6.67e-03 | 108 |
| hsa0436017 | Esophagus | ESCC | Axon guidance | 108/4205 | 182/8465 | 5.13e-03 | 1.30e-02 | 6.67e-03 | 108 |
| hsa043608 | Lung | IAC | Axon guidance | 34/1053 | 182/8465 | 9.31e-03 | 3.62e-02 | 2.41e-02 | 34 |
| hsa0436011 | Lung | IAC | Axon guidance | 34/1053 | 182/8465 | 9.31e-03 | 3.62e-02 | 2.41e-02 | 34 |
| hsa0436021 | Lung | AIS | Axon guidance | 34/961 | 182/8465 | 2.22e-03 | 1.37e-02 | 8.80e-03 | 34 |
| hsa0436031 | Lung | AIS | Axon guidance | 34/961 | 182/8465 | 2.22e-03 | 1.37e-02 | 8.80e-03 | 34 |
| Page: 1 |
Top |
Cell-cell communication analysis |
| Identification of potential cell-cell interactions between two cell types and their ligand-receptor pairs for different disease states |
| Ligand | Receptor | LRpair | Pathway | Tissue | Disease Stage |
| EFNA1 | EPHA4 | EFNA1_EPHA4 | EPHA | Cervix | CC |
| EFNA5 | EPHA4 | EFNA5_EPHA4 | EPHA | Cervix | CC |
| EFNB1 | EPHA4 | EFNB1_EPHA4 | EPHB | Cervix | CC |
| EFNB2 | EPHA4 | EFNB2_EPHA4 | EPHB | Cervix | CC |
| EFNB1 | EPHA4 | EFNB1_EPHA4 | EPHB | CRC | AD |
| EFNB2 | EPHA4 | EFNB2_EPHA4 | EPHB | CRC | AD |
| EFNA1 | EPHA4 | EFNA1_EPHA4 | EPHA | CRC | AD |
| EFNA5 | EPHA4 | EFNA5_EPHA4 | EPHA | CRC | AD |
| EFNA1 | EPHA4 | EFNA1_EPHA4 | EPHA | CRC | ADJ |
| EFNA5 | EPHA4 | EFNA5_EPHA4 | EPHA | CRC | ADJ |
| EFNB1 | EPHA4 | EFNB1_EPHA4 | EPHB | CRC | ADJ |
| EFNB2 | EPHA4 | EFNB2_EPHA4 | EPHB | CRC | ADJ |
| EFNA1 | EPHA4 | EFNA1_EPHA4 | EPHA | CRC | FAP |
| EFNA5 | EPHA4 | EFNA5_EPHA4 | EPHA | CRC | FAP |
| EFNB2 | EPHA4 | EFNB2_EPHA4 | EPHB | CRC | FAP |
| EFNA1 | EPHA4 | EFNA1_EPHA4 | EPHA | CRC | Healthy |
| EFNA5 | EPHA4 | EFNA5_EPHA4 | EPHA | CRC | Healthy |
| EFNB2 | EPHA4 | EFNB2_EPHA4 | EPHB | CRC | Healthy |
| EFNA1 | EPHA4 | EFNA1_EPHA4 | EPHA | CRC | MSI-H |
| EFNA3 | EPHA4 | EFNA3_EPHA4 | EPHA | CRC | MSI-H |
| Page: 1 |
Top |
Single-cell gene regulatory network inference analysis |
| Find out the significant the regulons (TFs) and the target genes of each regulon across cell types for different disease states |
| TF | Cell Type | Tissue | Disease Stage | Target Gene | RSS | Regulon Activity |
| ∗The dot plots of a searched regulon are shown for all cell subpopulations in each disease state of each tissue based on the regulon specific score inferred using pySCENIC and by calculating the average expression. |
| Page: 1 |
Top |
Somatic mutation of malignant transformation related genes |
| Annotation of somatic variants for genes involved in malignant transformation |
| Hugo Symbol | Variant Class | Variant Classification | dbSNP RS | HGVSc | HGVSp | HGVSp Short | SWISSPROT | BIOTYPE | SIFT | PolyPhen | Tumor Sample Barcode | Tissue | Histology | Sex | Age | Stage | Therapy Types | Drugs | Outcome |
| EPHA4 | SNV | Missense_Mutation | novel | c.2934G>C | p.Gln978His | p.Q978H | P54764 | protein_coding | tolerated(0.45) | benign(0) | TCGA-5L-AAT1-01 | Breast | breast invasive carcinoma | Female | <65 | III/IV | Hormone Therapy | letrozol | SD |
| EPHA4 | SNV | Missense_Mutation | rs376275374 | c.2182C>T | p.Arg728Cys | p.R728C | P54764 | protein_coding | deleterious(0.01) | probably_damaging(0.99) | TCGA-A1-A0SI-01 | Breast | breast invasive carcinoma | Female | <65 | I/II | Unknown | Unknown | SD |
| EPHA4 | SNV | Missense_Mutation | c.896N>G | p.Ser299Cys | p.S299C | P54764 | protein_coding | deleterious(0) | possibly_damaging(0.606) | TCGA-A8-A094-01 | Breast | breast invasive carcinoma | Female | >=65 | I/II | Unknown | Unknown | SD | |
| EPHA4 | SNV | Missense_Mutation | rs140023331 | c.2918N>A | p.Arg973Gln | p.R973Q | P54764 | protein_coding | tolerated(0.1) | benign(0.01) | TCGA-AN-A046-01 | Breast | breast invasive carcinoma | Female | >=65 | I/II | Unknown | Unknown | SD |
| EPHA4 | SNV | Missense_Mutation | novel | c.1474N>T | p.Arg492Trp | p.R492W | P54764 | protein_coding | deleterious(0) | probably_damaging(0.926) | TCGA-AN-A046-01 | Breast | breast invasive carcinoma | Female | >=65 | I/II | Unknown | Unknown | SD |
| EPHA4 | SNV | Missense_Mutation | c.701T>C | p.Val234Ala | p.V234A | P54764 | protein_coding | deleterious(0) | probably_damaging(0.996) | TCGA-BH-A18G-01 | Breast | breast invasive carcinoma | Female | >=65 | I/II | Unknown | Unknown | SD | |
| EPHA4 | insertion | Nonsense_Mutation | novel | c.574_575insAATGAAATTAATCTTGATGAAAGACCTCTTTATTTCTC | p.Ile192LysfsTer2 | p.I192Kfs*2 | P54764 | protein_coding | TCGA-A8-A09B-01 | Breast | breast invasive carcinoma | Female | <65 | III/IV | Chemotherapy | 5-fluorouracil | SD | ||
| EPHA4 | insertion | Frame_Shift_Ins | novel | c.210_211insTGGGGCTTAGTGCGAGTAAT | p.Gln71TrpfsTer12 | p.Q71Wfs*12 | P54764 | protein_coding | TCGA-AN-A03X-01 | Breast | breast invasive carcinoma | Female | >=65 | I/II | Unknown | Unknown | SD | ||
| EPHA4 | insertion | In_Frame_Ins | novel | c.208_209insCCATATTGCAGTTTTTTC | p.Tyr70delinsSerIleLeuGlnPhePheHis | p.Y70delinsSILQFFH | P54764 | protein_coding | TCGA-AN-A03X-01 | Breast | breast invasive carcinoma | Female | >=65 | I/II | Unknown | Unknown | SD | ||
| EPHA4 | SNV | Missense_Mutation | c.1900N>A | p.Glu634Lys | p.E634K | P54764 | protein_coding | deleterious(0) | probably_damaging(0.999) | TCGA-C5-A1BK-01 | Cervix | cervical & endocervical cancer | Female | <65 | I/II | Unknown | Unknown | SD |
| Page: 1 2 3 4 5 6 7 8 9 10 11 12 13 14 15 16 |
Top |
Related drugs of malignant transformation related genes |
| Identification of chemicals and drugs interact with genes involved in malignant transfromation |
| (DGIdb 4.0) |
| Entrez ID | Symbol | Category | Interaction Types | Drug Claim Name | Drug Name | PMIDs |
| 2043 | EPHA4 | DRUGGABLE GENOME, KINASE, CELL SURFACE, TYROSINE KINASE | inhibitor | CHEMBL24828 | VANDETANIB | |
| 2043 | EPHA4 | DRUGGABLE GENOME, KINASE, CELL SURFACE, TYROSINE KINASE | inhibitor | 249565821 |
| Page: 1 |

Copyright 2023-Present -The University of Texas Health Science Center at Houston |