
|
|||||
|
 | |
| |
| |
| |
| |
| |
|
Gene: RSF1 |
Gene summary for RSF1 |
| Gene information | Species | Human | Gene symbol | RSF1 | Gene ID | 51773 |
| Gene name | remodeling and spacing factor 1 | |
| Gene Alias | HBXAP | |
| Cytomap | 11q14.1 | |
| Gene Type | protein-coding | GO ID | GO:0006139 | UniProtAcc | Q05DG0 |
Top |
Malignant transformation analysis |
| Identification of the aberrant gene expression in precancerous and cancerous lesions by comparing the gene expression of stem-like cells in diseased tissues with normal stem cells |
| Entrez ID | Symbol | Replicates | Species | Organ | Tissue | Adj P-value | Log2FC | Malignancy |
| 51773 | RSF1 | GSM4909286 | Human | Breast | IDC | 3.20e-02 | 1.99e-01 | 0.1081 |
| 51773 | RSF1 | GSM4909296 | Human | Breast | IDC | 1.18e-07 | -1.73e-01 | 0.1524 |
| 51773 | RSF1 | GSM4909297 | Human | Breast | IDC | 1.86e-13 | 2.26e-01 | 0.1517 |
| 51773 | RSF1 | GSM4909298 | Human | Breast | IDC | 5.77e-107 | 1.27e+00 | 0.1551 |
| 51773 | RSF1 | GSM4909311 | Human | Breast | IDC | 8.64e-25 | -1.52e-01 | 0.1534 |
| 51773 | RSF1 | GSM4909312 | Human | Breast | IDC | 4.79e-06 | 4.87e-02 | 0.1552 |
| 51773 | RSF1 | GSM4909317 | Human | Breast | IDC | 1.99e-08 | 3.56e-01 | 0.1355 |
| 51773 | RSF1 | GSM4909319 | Human | Breast | IDC | 6.59e-28 | -2.15e-01 | 0.1563 |
| 51773 | RSF1 | GSM4909320 | Human | Breast | IDC | 2.45e-03 | -2.34e-01 | 0.1575 |
| 51773 | RSF1 | GSM4909321 | Human | Breast | IDC | 2.45e-13 | -2.11e-01 | 0.1559 |
| 51773 | RSF1 | M5 | Human | Breast | IDC | 4.71e-08 | 6.51e-01 | 0.1598 |
| 51773 | RSF1 | NCCBC14 | Human | Breast | DCIS | 9.14e-03 | 4.88e-02 | 0.2021 |
| 51773 | RSF1 | NCCBC2 | Human | Breast | DCIS | 1.52e-02 | -4.54e-02 | 0.1554 |
| 51773 | RSF1 | NCCBC5 | Human | Breast | DCIS | 2.48e-03 | -1.08e-01 | 0.2046 |
| 51773 | RSF1 | P1 | Human | Breast | IDC | 2.74e-13 | -4.87e-02 | 0.1527 |
| 51773 | RSF1 | P2 | Human | Breast | IDC | 7.27e-03 | 8.58e-02 | 0.21 |
| 51773 | RSF1 | P3 | Human | Breast | IDC | 4.20e-16 | 9.07e-01 | 0.1542 |
| 51773 | RSF1 | DCIS2 | Human | Breast | DCIS | 2.50e-56 | 3.59e-01 | 0.0085 |
| 51773 | RSF1 | HTA11_3410_2000001011 | Human | Colorectum | AD | 1.18e-12 | -5.40e-01 | 0.0155 |
| 51773 | RSF1 | HTA11_2951_2000001011 | Human | Colorectum | AD | 2.06e-02 | -7.28e-01 | 0.0216 |
| Page: 1 2 3 4 5 6 7 8 9 10 11 12 |
| Tissue | Expression Dynamics | Abbreviation |
| Breast | 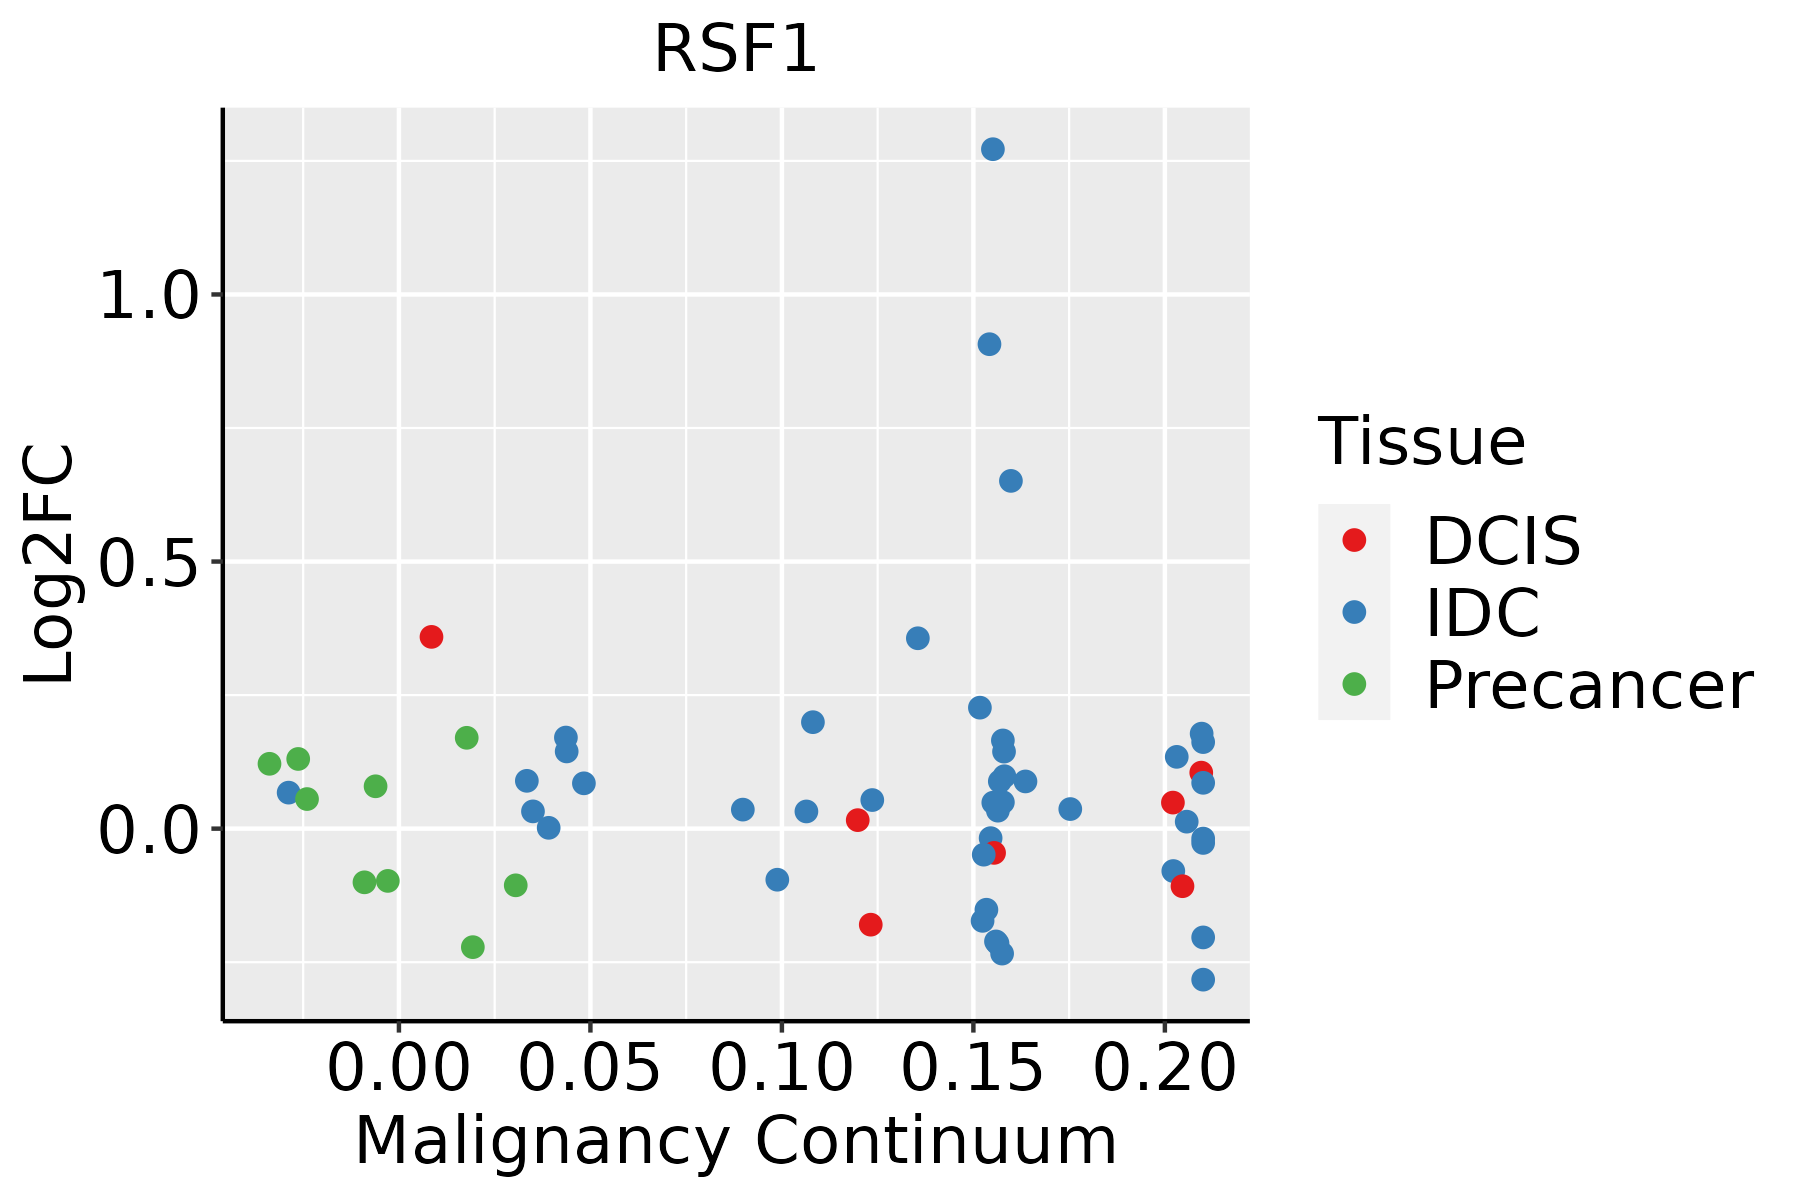 | IDC: Invasive ductal carcinoma |
| DCIS: Ductal carcinoma in situ | ||
| Precancer(BRCA1-mut): Precancerous lesion from BRCA1 mutation carriers | ||
| Colorectum (GSE201348) |  | FAP: Familial adenomatous polyposis |
| CRC: Colorectal cancer | ||
| Colorectum (HTA11) |  | AD: Adenomas |
| SER: Sessile serrated lesions | ||
| MSI-H: Microsatellite-high colorectal cancer | ||
| MSS: Microsatellite stable colorectal cancer | ||
| Esophagus | 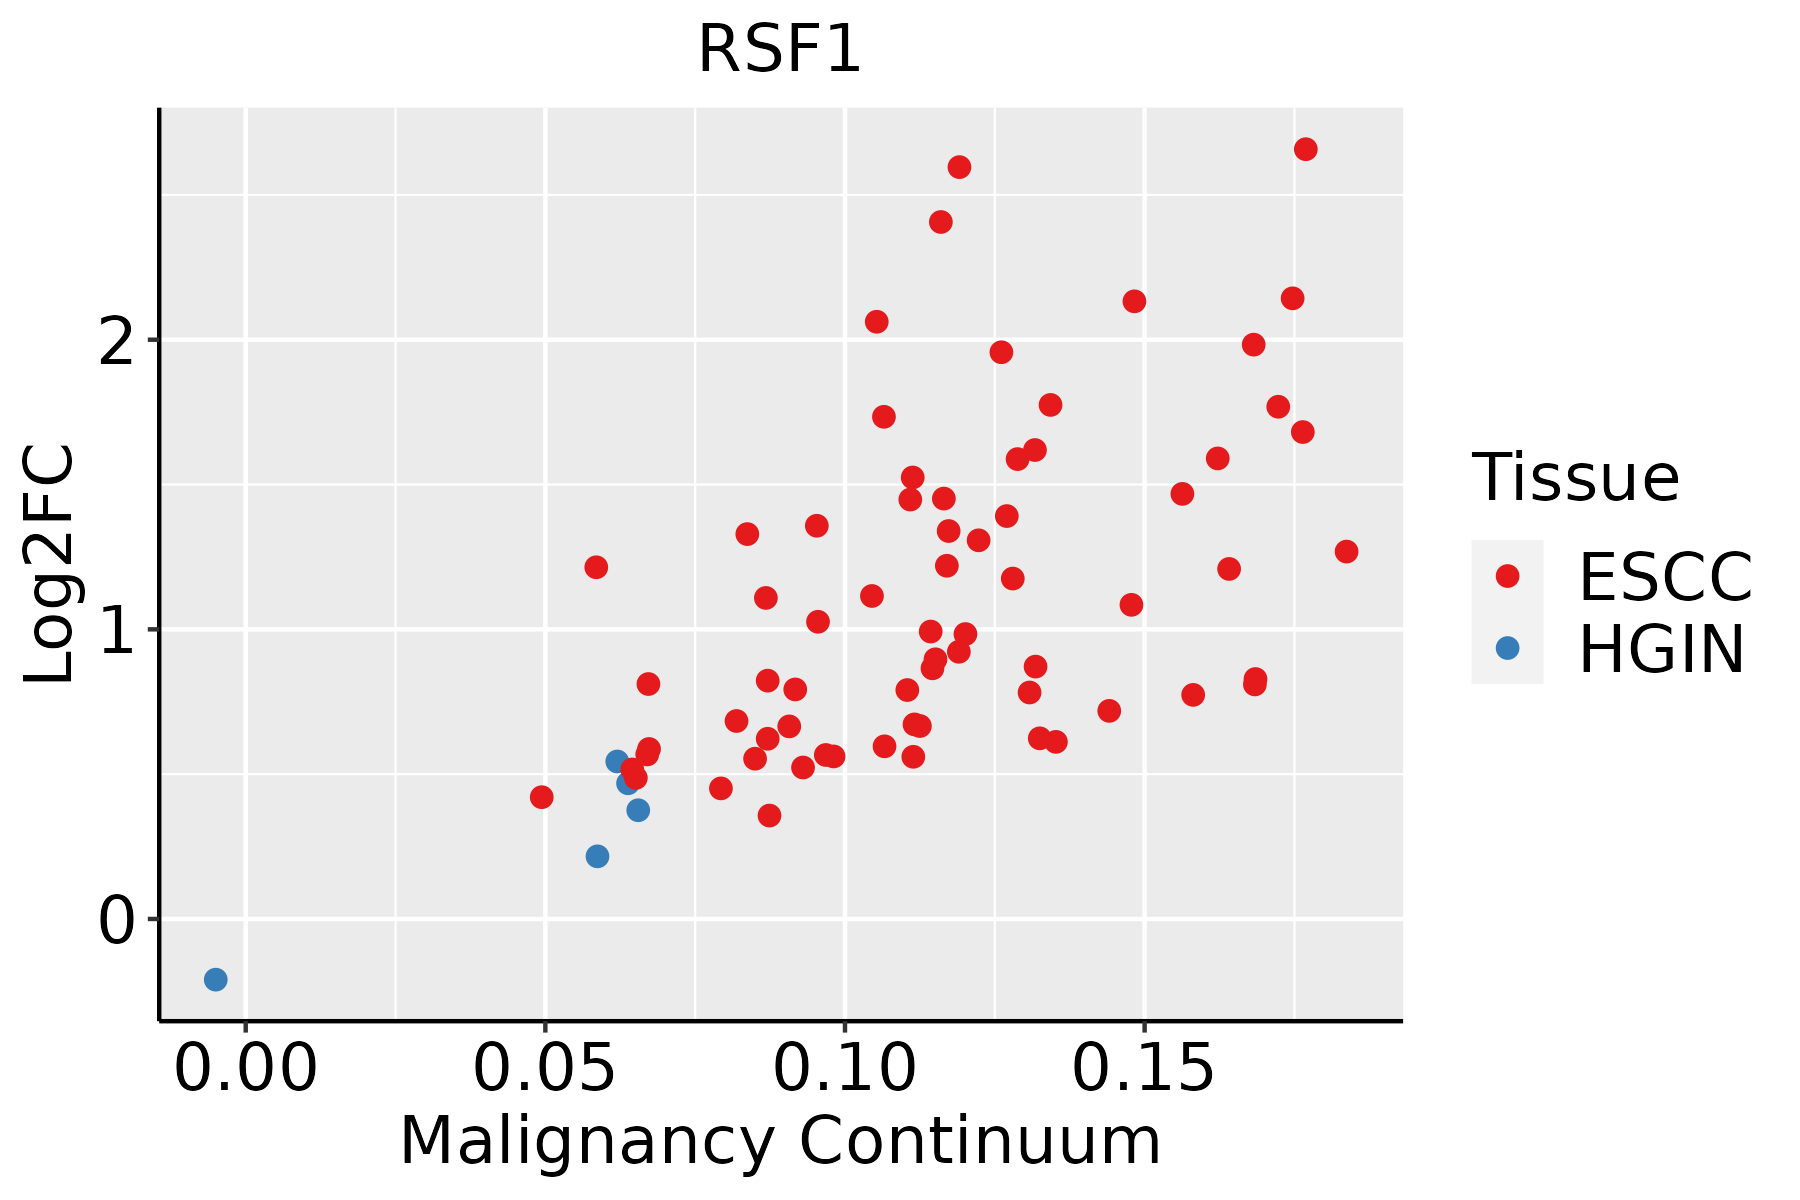 | ESCC: Esophageal squamous cell carcinoma |
| HGIN: High-grade intraepithelial neoplasias | ||
| LGIN: Low-grade intraepithelial neoplasias | ||
| Liver | 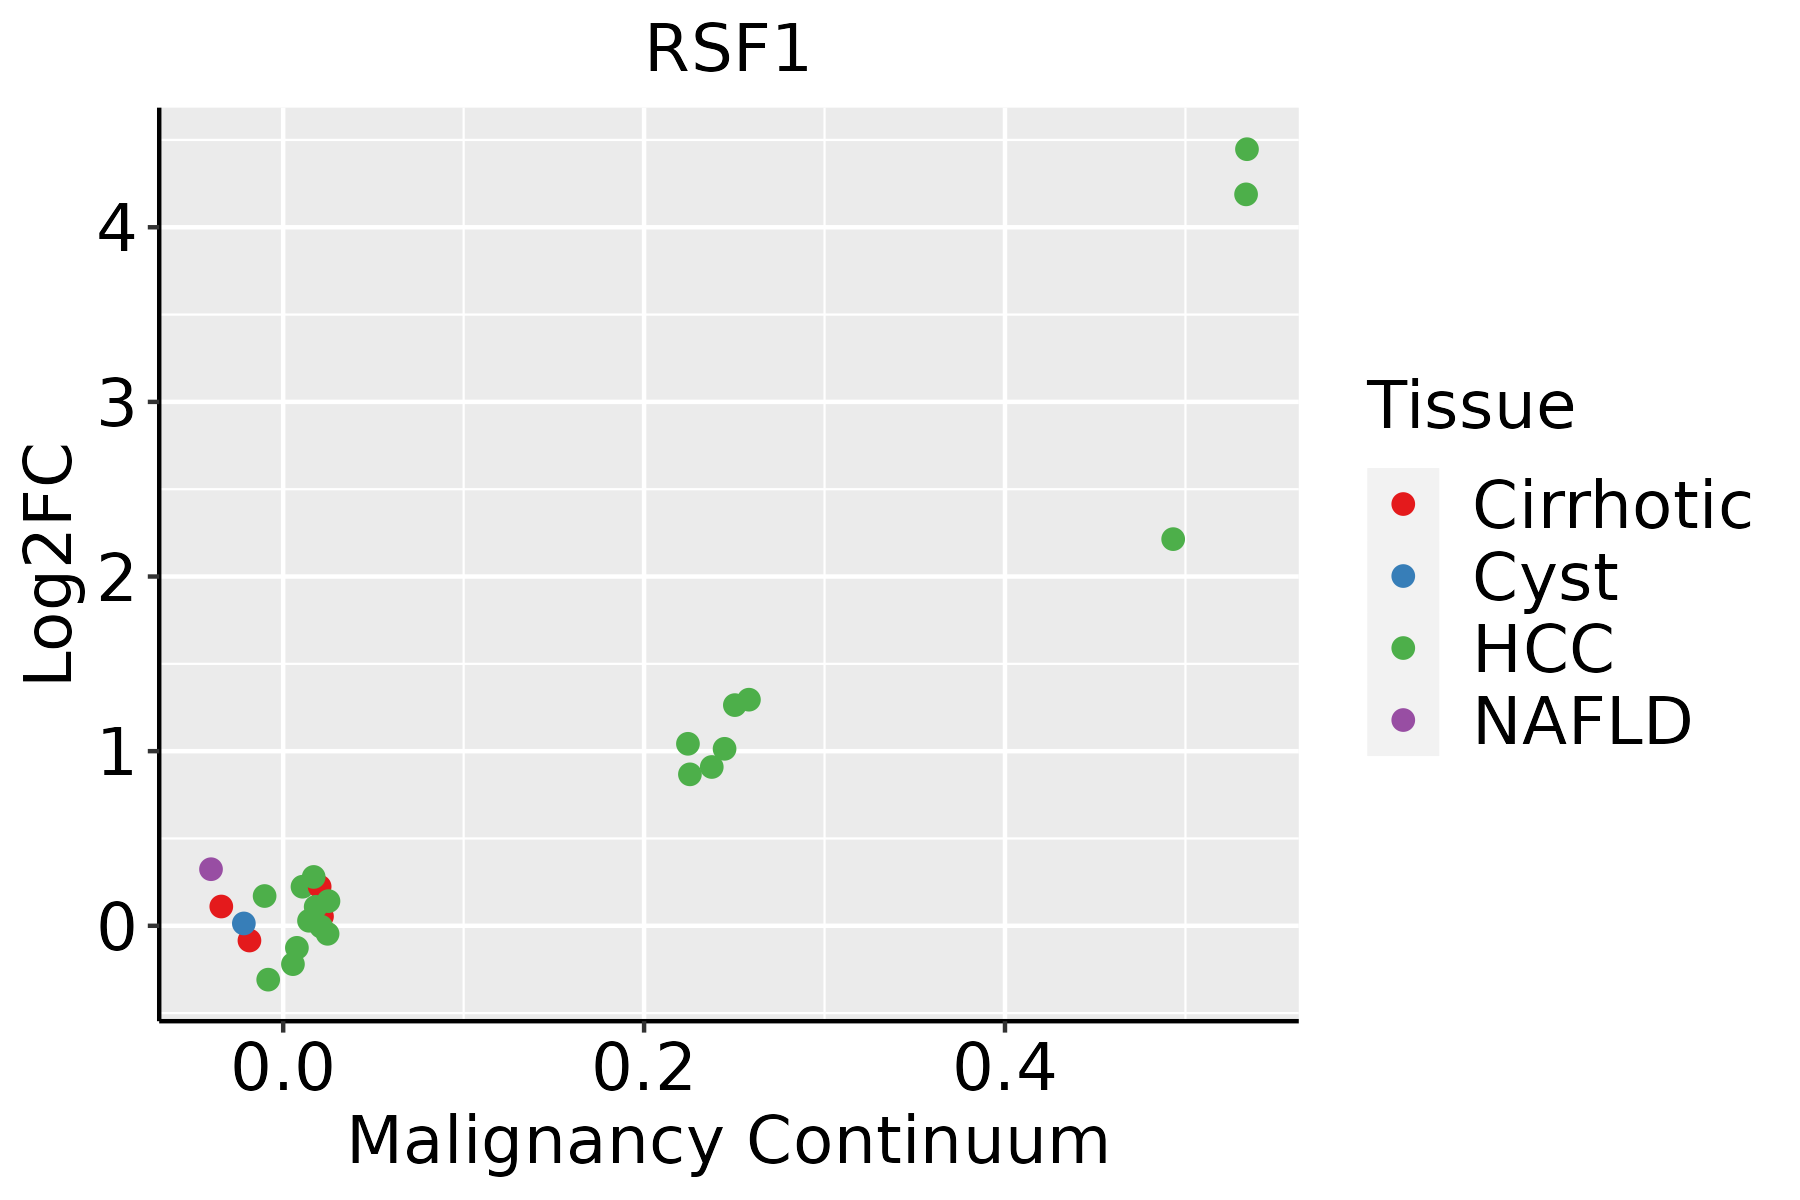 | HCC: Hepatocellular carcinoma |
| NAFLD: Non-alcoholic fatty liver disease | ||
| Lung | 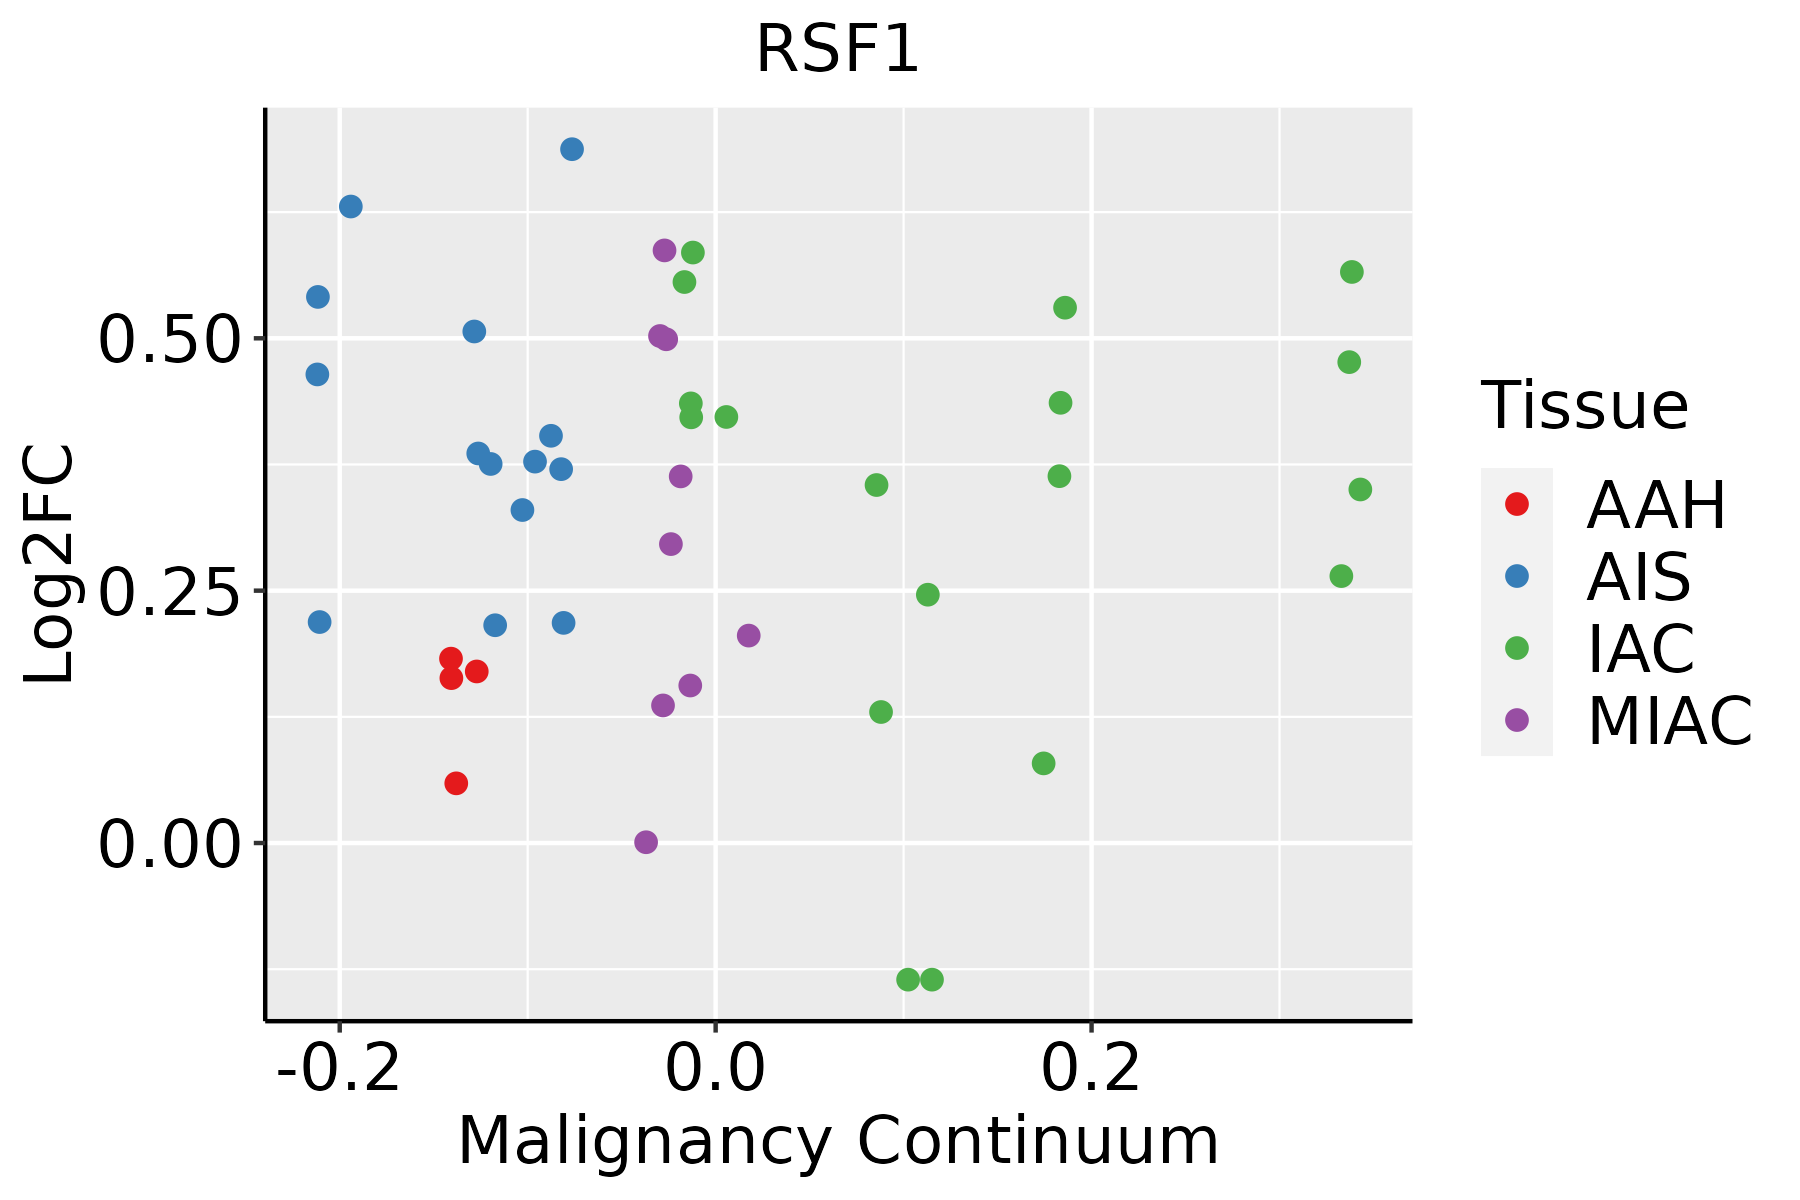 | AAH: Atypical adenomatous hyperplasia |
| AIS: Adenocarcinoma in situ | ||
| IAC: Invasive lung adenocarcinoma | ||
| MIA: Minimally invasive adenocarcinoma | ||
| Oral Cavity | 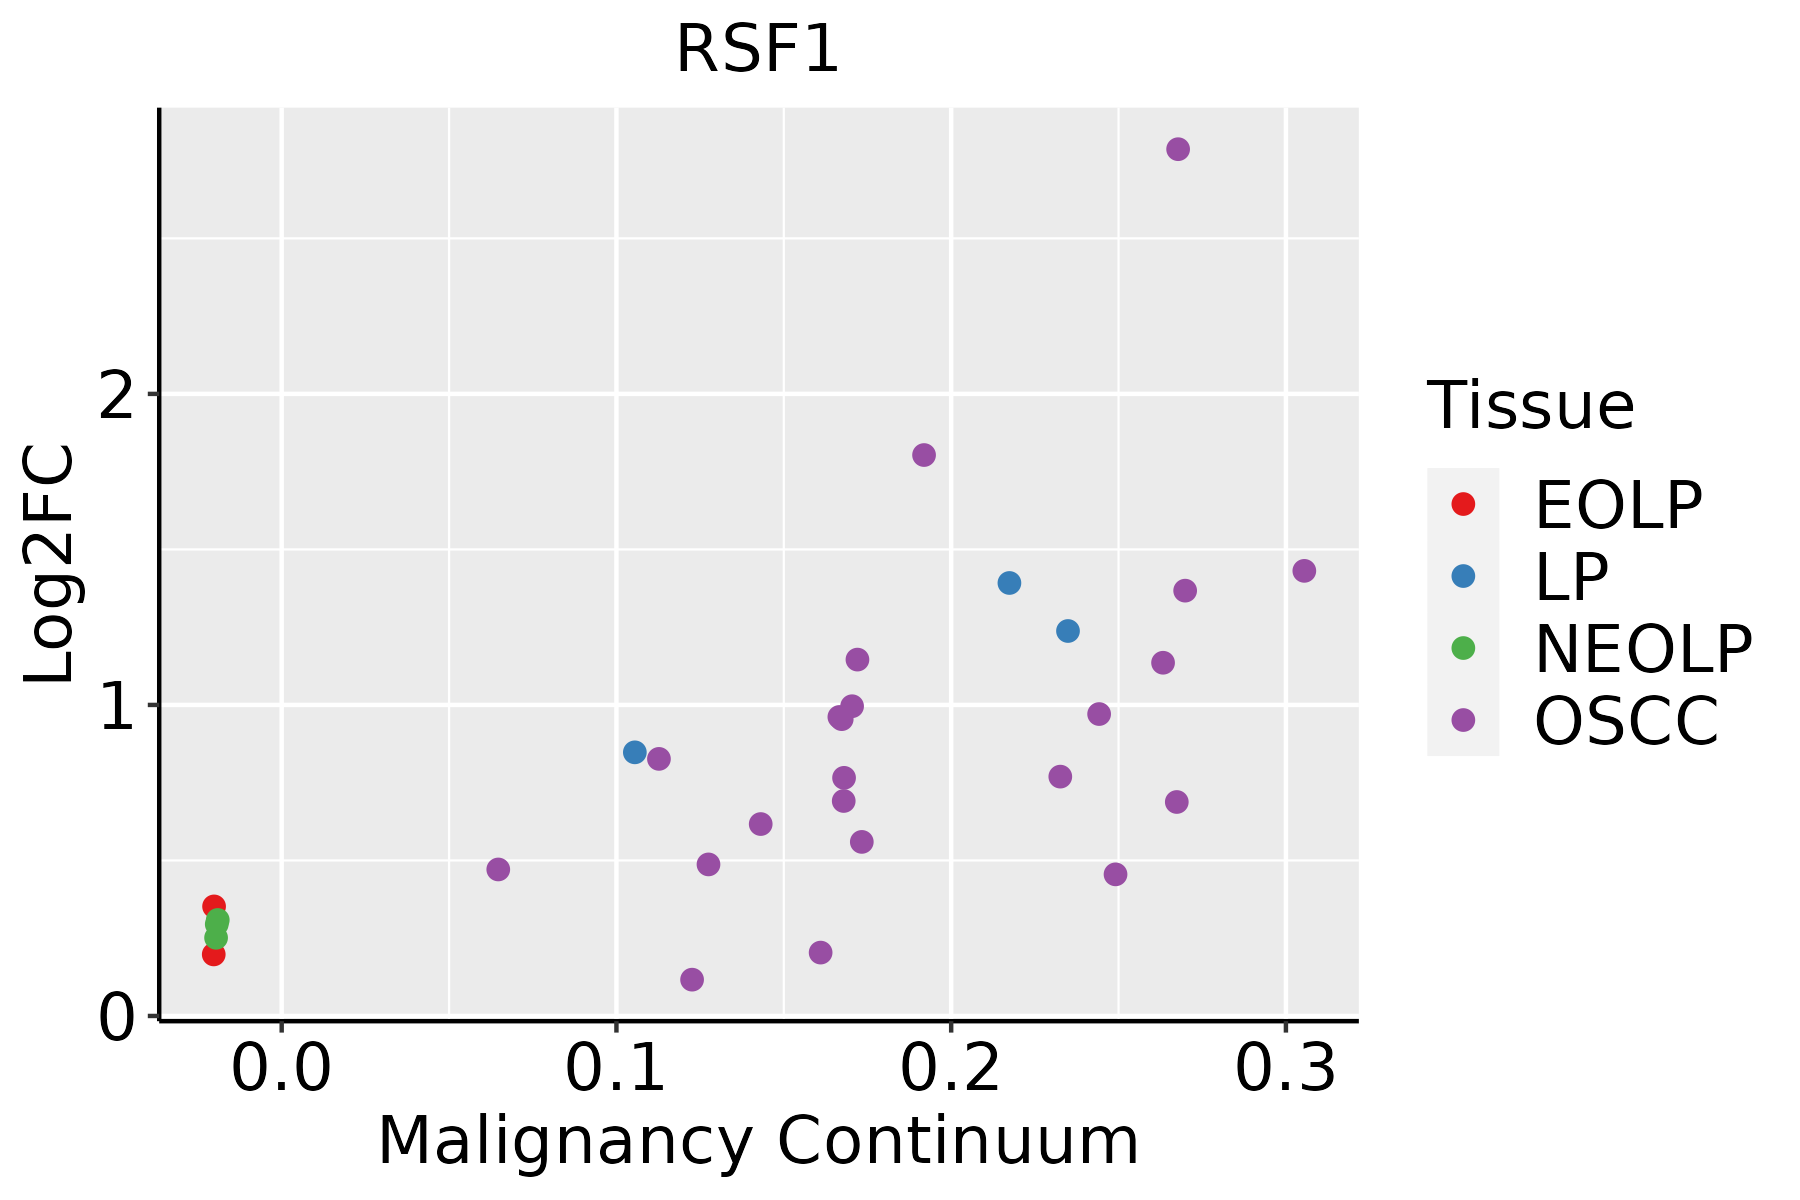 | EOLP: Erosive Oral lichen planus |
| LP: leukoplakia | ||
| NEOLP: Non-erosive oral lichen planus | ||
| OSCC: Oral squamous cell carcinoma | ||
| Prostate |  | BPH: Benign Prostatic Hyperplasia |
| Skin | 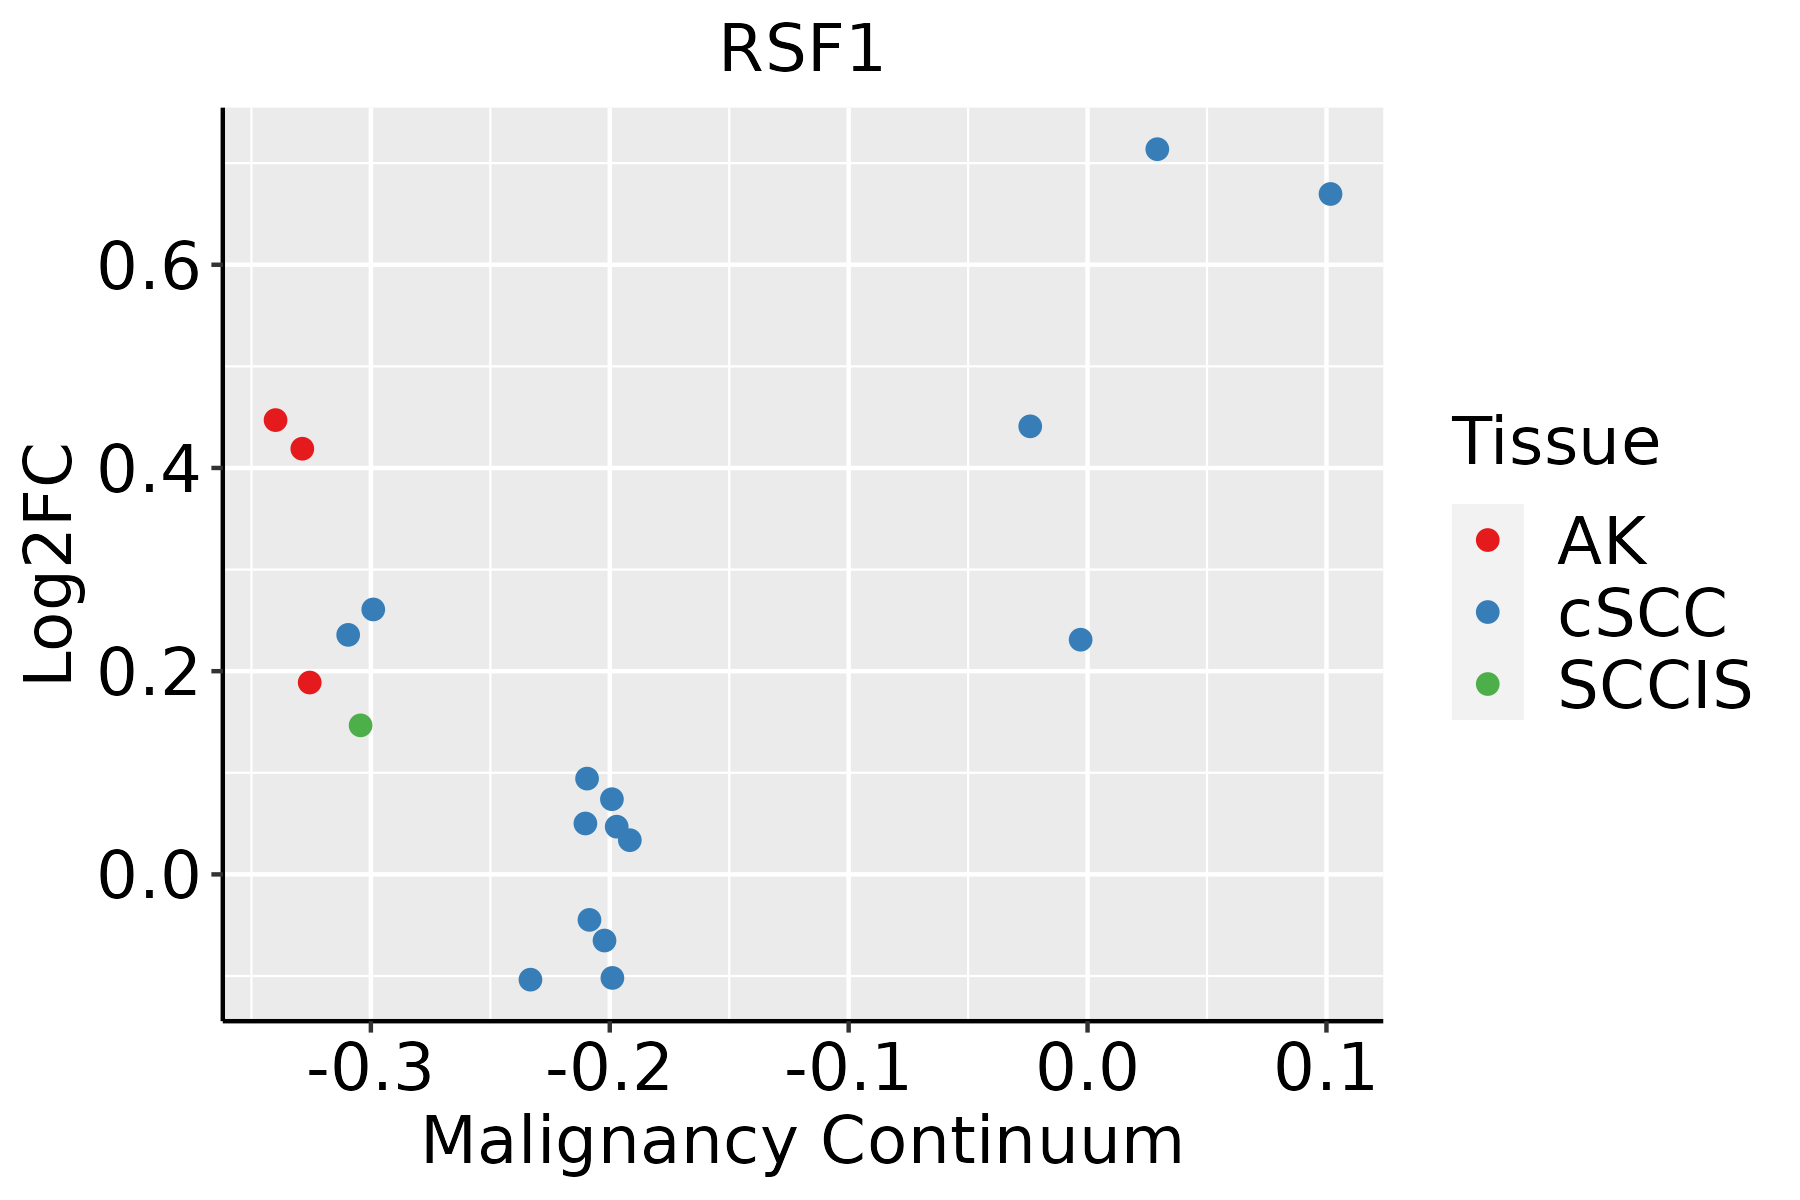 | AK: Actinic keratosis |
| cSCC: Cutaneous squamous cell carcinoma | ||
| SCCIS:squamous cell carcinoma in situ | ||
| Thyroid | 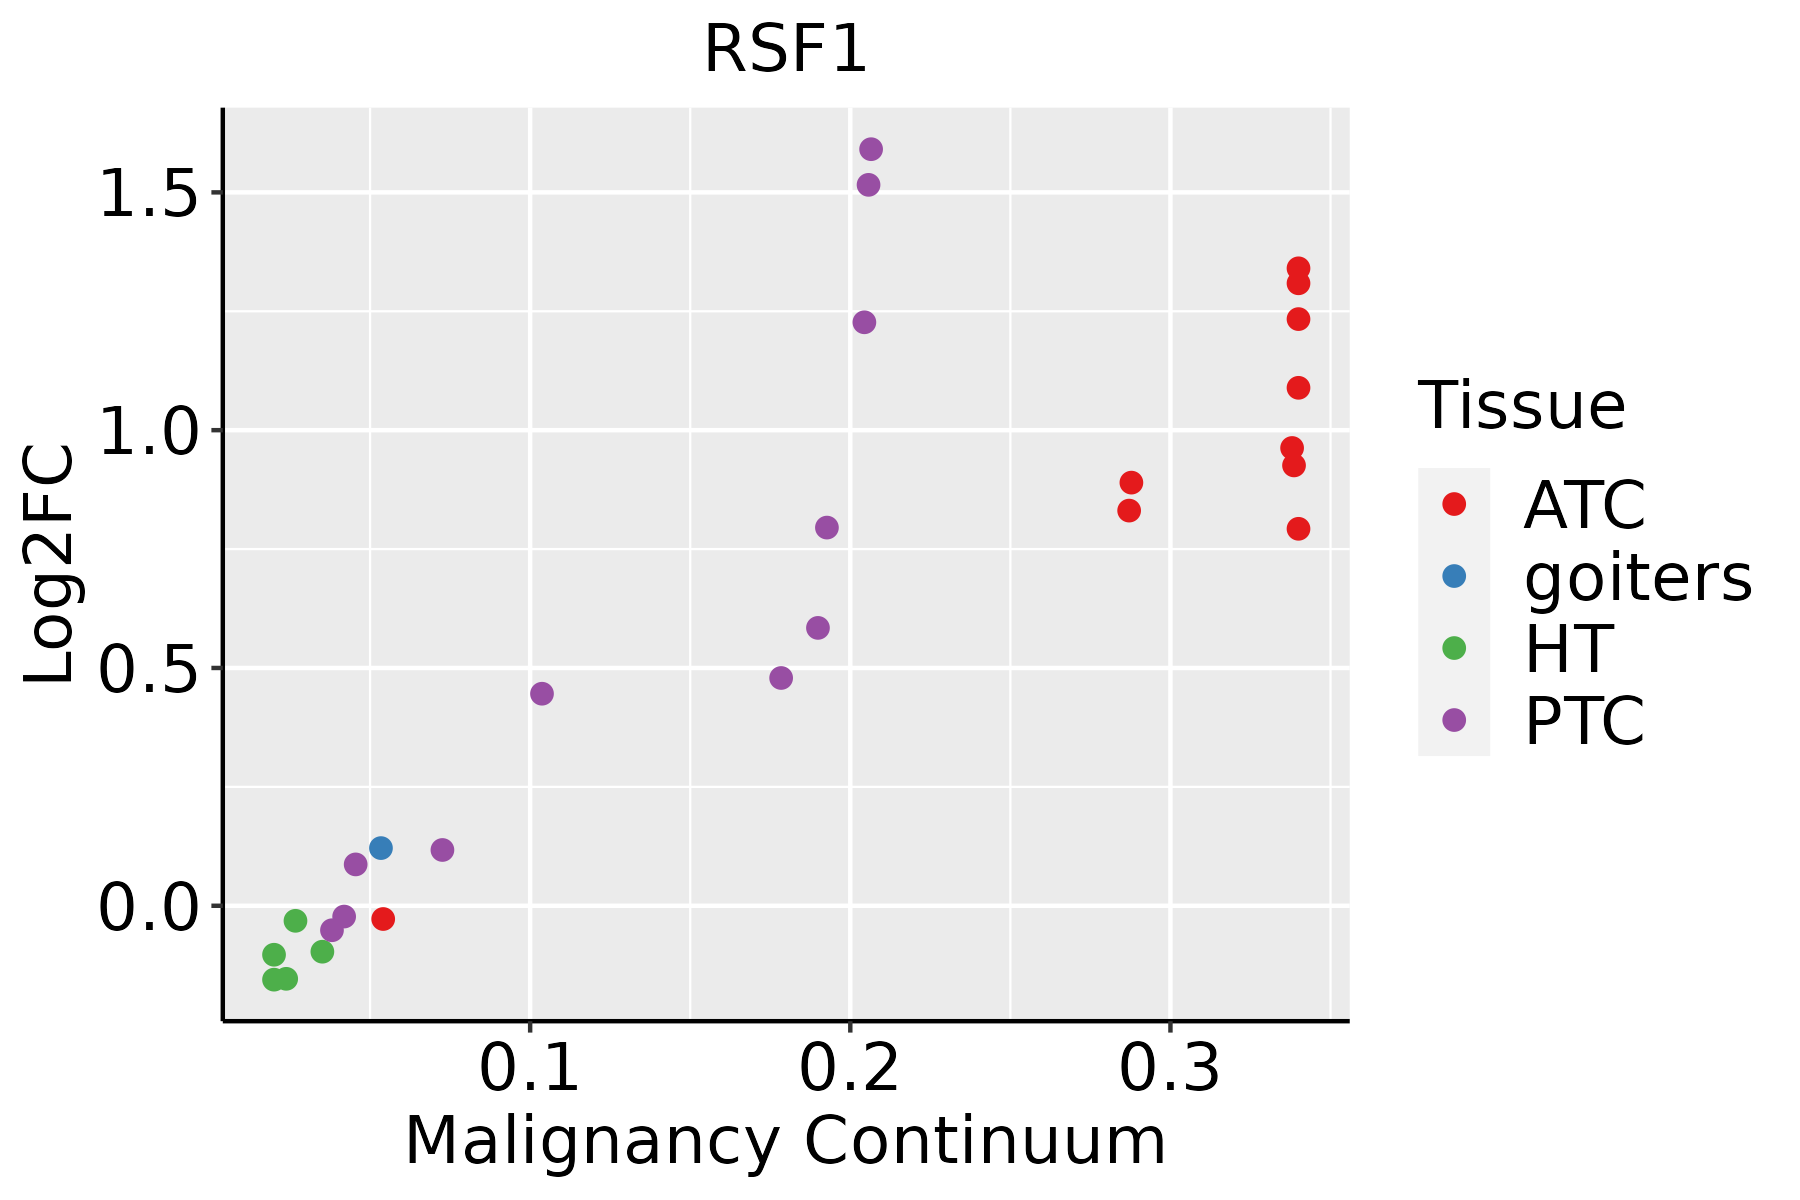 | ATC: Anaplastic thyroid cancer |
| HT: Hashimoto's thyroiditis | ||
| PTC: Papillary thyroid cancer |
| ∗log2FC in expression of this searched gene in stem-like cells from each diseased tissue sample relative to stem-like cells in normal samples in each tissue plotted against the malignancy continuum. Samples are colored based on if they are from different disease stage. |
Top |
Malignant transformation related pathway analysis |
| Find out the enriched GO biological processes and KEGG pathways involved in transition from healthy to precancer to cancer |
| Tissue | Disease Stage | Enriched GO biological Processes |
| Colorectum | AD |  |
| Colorectum | SER |  |
| Colorectum | MSS |  |
| Colorectum | MSI-H |  |
| Colorectum | FAP |  |
| ∗Top 15 enriched GO BP terms are showed in the bar plot of each disease state in each tissue. Each row represents a significant GO biological process which is colored according to the -log10(p.adjust). |
| Page: 1 2 3 4 5 6 7 8 9 |
| GO ID | Tissue | Disease Stage | Description | Gene Ratio | Bg Ratio | pvalue | p.adjust | Count |
| GO:005109812 | Liver | Cirrhotic | regulation of binding | 148/4634 | 363/18723 | 9.14e-12 | 5.97e-10 | 148 |
| GO:00344701 | Liver | Cirrhotic | ncRNA processing | 158/4634 | 395/18723 | 1.09e-11 | 6.96e-10 | 158 |
| GO:199077811 | Liver | Cirrhotic | protein localization to cell periphery | 135/4634 | 333/18723 | 1.18e-10 | 6.21e-09 | 135 |
| GO:007265911 | Liver | Cirrhotic | protein localization to plasma membrane | 119/4634 | 284/18723 | 1.30e-10 | 6.80e-09 | 119 |
| GO:009719112 | Liver | Cirrhotic | extrinsic apoptotic signaling pathway | 97/4634 | 219/18723 | 1.82e-10 | 9.11e-09 | 97 |
| GO:001908011 | Liver | Cirrhotic | viral gene expression | 52/4634 | 94/18723 | 2.19e-10 | 1.08e-08 | 52 |
| GO:200123612 | Liver | Cirrhotic | regulation of extrinsic apoptotic signaling pathway | 72/4634 | 151/18723 | 7.80e-10 | 3.62e-08 | 72 |
| GO:007099712 | Liver | Cirrhotic | neuron death | 141/4634 | 361/18723 | 9.56e-10 | 4.38e-08 | 141 |
| GO:00485247 | Liver | Cirrhotic | positive regulation of viral process | 39/4634 | 65/18723 | 1.62e-09 | 6.93e-08 | 39 |
| GO:005170112 | Liver | Cirrhotic | biological process involved in interaction with host | 88/4634 | 203/18723 | 4.55e-09 | 1.82e-07 | 88 |
| GO:000038011 | Liver | Cirrhotic | alternative mRNA splicing, via spliceosome | 43/4634 | 77/18723 | 5.31e-09 | 2.10e-07 | 43 |
| GO:00507927 | Liver | Cirrhotic | regulation of viral process | 74/4634 | 164/18723 | 9.54e-09 | 3.69e-07 | 74 |
| GO:200123512 | Liver | Cirrhotic | positive regulation of apoptotic signaling pathway | 60/4634 | 126/18723 | 2.08e-08 | 7.47e-07 | 60 |
| GO:004206012 | Liver | Cirrhotic | wound healing | 155/4634 | 422/18723 | 2.12e-08 | 7.56e-07 | 155 |
| GO:007149612 | Liver | Cirrhotic | cellular response to external stimulus | 123/4634 | 320/18723 | 3.27e-08 | 1.10e-06 | 123 |
| GO:001648211 | Liver | Cirrhotic | cytosolic transport | 74/4634 | 168/18723 | 3.34e-08 | 1.12e-06 | 74 |
| GO:00346603 | Liver | Cirrhotic | ncRNA metabolic process | 173/4634 | 485/18723 | 3.64e-08 | 1.21e-06 | 173 |
| GO:19012147 | Liver | Cirrhotic | regulation of neuron death | 122/4634 | 319/18723 | 5.17e-08 | 1.62e-06 | 122 |
| GO:003311912 | Liver | Cirrhotic | negative regulation of RNA splicing | 19/4634 | 25/18723 | 1.05e-07 | 3.01e-06 | 19 |
| GO:00521267 | Liver | Cirrhotic | movement in host environment | 75/4634 | 175/18723 | 1.08e-07 | 3.07e-06 | 75 |
| Page: 1 2 3 4 5 6 7 8 9 10 11 12 13 14 15 16 17 18 19 20 21 22 23 24 25 26 27 28 29 30 31 32 33 34 35 36 37 38 39 40 41 42 43 44 45 46 47 48 49 50 51 52 53 54 55 56 57 58 59 60 61 62 63 64 65 66 67 68 69 70 71 72 73 74 75 76 77 78 79 80 81 82 83 84 85 86 87 88 89 90 91 92 93 94 95 96 97 98 99 100 101 102 103 104 105 106 107 108 109 110 111 112 |
| Pathway ID | Tissue | Disease Stage | Description | Gene Ratio | Bg Ratio | pvalue | p.adjust | qvalue | Count |
| Page: 1 |
Top |
Cell-cell communication analysis |
| Identification of potential cell-cell interactions between two cell types and their ligand-receptor pairs for different disease states |
| Ligand | Receptor | LRpair | Pathway | Tissue | Disease Stage |
| TNF | TNFRSF1A | TNF_TNFRSF1A | TNF | Breast | ADJ |
| TNF | TNFRSF1B | TNF_TNFRSF1B | TNF | Breast | ADJ |
| TNFSF13B | TNFRSF17 | TNFSF13B_TNFRSF17 | BAFF | Breast | DCIS |
| TNFSF13B | TNFRSF13B | TNFSF13B_TNFRSF13B | BAFF | Breast | DCIS |
| TNFSF13B | TNFRSF13C | TNFSF13B_TNFRSF13C | BAFF | Breast | DCIS |
| TNF | TNFRSF1A | TNF_TNFRSF1A | TNF | Breast | DCIS |
| TNF | TNFRSF1B | TNF_TNFRSF1B | TNF | Breast | DCIS |
| TNFSF14 | TNFRSF14 | TNFSF14_TNFRSF14 | LIGHT | Breast | DCIS |
| TNFSF12 | TNFRSF12A | TNFSF12_TNFRSF12A | TWEAK | Breast | DCIS |
| TNF | TNFRSF1A | TNF_TNFRSF1A | TNF | Breast | Healthy |
| TNF | TNFRSF1B | TNF_TNFRSF1B | TNF | Breast | Healthy |
| TNFSF12 | TNFRSF12A | TNFSF12_TNFRSF12A | TWEAK | Breast | Healthy |
| TNFSF13B | TNFRSF17 | TNFSF13B_TNFRSF17 | BAFF | Breast | Healthy |
| TNFSF13B | TNFRSF13C | TNFSF13B_TNFRSF13C | BAFF | Breast | Healthy |
| TNFSF13B | TNFRSF17 | TNFSF13B_TNFRSF17 | BAFF | Breast | IDC |
| TNFSF13B | TNFRSF13C | TNFSF13B_TNFRSF13C | BAFF | Breast | IDC |
| TNFSF12 | TNFRSF12A | TNFSF12_TNFRSF12A | TWEAK | Cervix | ADJ |
| LTA | TNFRSF1A | LTA_TNFRSF1A | LT | Cervix | ADJ |
| LTA | TNFRSF1B | LTA_TNFRSF1B | LT | Cervix | ADJ |
| LTA | TNFRSF14 | LTA_TNFRSF14 | LT | Cervix | ADJ |
| Page: 1 |
Top |
Single-cell gene regulatory network inference analysis |
| Find out the significant the regulons (TFs) and the target genes of each regulon across cell types for different disease states |
| TF | Cell Type | Tissue | Disease Stage | Target Gene | RSS | Regulon Activity |
| ∗The dot plots of a searched regulon are shown for all cell subpopulations in each disease state of each tissue based on the regulon specific score inferred using pySCENIC and by calculating the average expression. |
| Page: 1 |
Top |
Somatic mutation of malignant transformation related genes |
| Annotation of somatic variants for genes involved in malignant transformation |
| Hugo Symbol | Variant Class | Variant Classification | dbSNP RS | HGVSc | HGVSp | HGVSp Short | SWISSPROT | BIOTYPE | SIFT | PolyPhen | Tumor Sample Barcode | Tissue | Histology | Sex | Age | Stage | Therapy Types | Drugs | Outcome |
| RSF1 | SNV | Missense_Mutation | c.1989A>C | p.Lys663Asn | p.K663N | Q96T23 | protein_coding | tolerated_low_confidence(0.23) | benign(0) | TCGA-A2-A0EV-01 | Breast | breast invasive carcinoma | Female | >=65 | I/II | Unknown | Unknown | SD | |
| RSF1 | SNV | Missense_Mutation | novel | c.1274G>C | p.Cys425Ser | p.C425S | Q96T23 | protein_coding | tolerated_low_confidence(0.33) | benign(0.031) | TCGA-A2-A3XT-01 | Breast | breast invasive carcinoma | Female | <65 | I/II | Chemotherapy | cyclophosphamide | PR |
| RSF1 | SNV | Missense_Mutation | rs779258393 | c.3217G>A | p.Glu1073Lys | p.E1073K | Q96T23 | protein_coding | deleterious(0.01) | probably_damaging(0.996) | TCGA-A8-A09E-01 | Breast | breast invasive carcinoma | Female | >=65 | III/IV | Hormone Therapy | anastrozole | SD |
| RSF1 | SNV | Missense_Mutation | novel | c.334N>A | p.Leu112Ile | p.L112I | Q96T23 | protein_coding | tolerated(0.06) | benign(0.321) | TCGA-AN-A046-01 | Breast | breast invasive carcinoma | Female | >=65 | I/II | Unknown | Unknown | SD |
| RSF1 | SNV | Missense_Mutation | novel | c.3529G>C | p.Glu1177Gln | p.E1177Q | Q96T23 | protein_coding | deleterious(0.02) | possibly_damaging(0.725) | TCGA-AN-A0FL-01 | Breast | breast invasive carcinoma | Female | <65 | I/II | Unknown | Unknown | SD |
| RSF1 | SNV | Missense_Mutation | c.2074G>C | p.Glu692Gln | p.E692Q | Q96T23 | protein_coding | deleterious(0.03) | benign(0.203) | TCGA-AN-A0XW-01 | Breast | breast invasive carcinoma | Female | <65 | III/IV | Unknown | Unknown | SD | |
| RSF1 | SNV | Missense_Mutation | c.1645N>T | p.Asp549Tyr | p.D549Y | Q96T23 | protein_coding | deleterious_low_confidence(0) | benign(0.406) | TCGA-BH-A0DG-01 | Breast | breast invasive carcinoma | Female | <65 | I/II | Chemotherapy | taxotere | CR | |
| RSF1 | SNV | Missense_Mutation | c.2905N>C | p.Glu969Gln | p.E969Q | Q96T23 | protein_coding | deleterious(0.04) | possibly_damaging(0.734) | TCGA-D8-A27G-01 | Breast | breast invasive carcinoma | Female | >=65 | I/II | Unknown | Unknown | SD | |
| RSF1 | SNV | Missense_Mutation | novel | c.3947N>C | p.Gly1316Ala | p.G1316A | Q96T23 | protein_coding | tolerated_low_confidence(0.19) | benign(0.15) | TCGA-LL-A5YL-01 | Breast | breast invasive carcinoma | Female | <65 | I/II | Chemotherapy | adriamycin | SD |
| RSF1 | insertion | In_Frame_Ins | novel | c.1529_1530insCCT | p.Arg510delinsSerLeu | p.R510delinsSL | Q96T23 | protein_coding | TCGA-BH-A0AY-01 | Breast | breast invasive carcinoma | Female | <65 | I/II | Chemotherapy | SD |
| Page: 1 2 3 4 5 6 7 8 9 10 11 12 13 |
Top |
Related drugs of malignant transformation related genes |
| Identification of chemicals and drugs interact with genes involved in malignant transfromation |
| (DGIdb 4.0) |
| Entrez ID | Symbol | Category | Interaction Types | Drug Claim Name | Drug Name | PMIDs |
| Page: 1 |

Copyright 2023-Present -The University of Texas Health Science Center at Houston |