
|
|||||
|
 | |
| |
| |
| |
| |
| |
|
Gene: ATP5I |
Gene summary for ATP5I |
| Gene information | Species | Human | Gene symbol | ATP5I | Gene ID | 521 |
| Gene name | ATP synthase membrane subunit e | |
| Gene Alias | ATP5I | |
| Cytomap | 4p16.3 | |
| Gene Type | protein-coding | GO ID | GO:0006091 | UniProtAcc | P56385 |
Top |
Malignant transformation analysis |
| Identification of the aberrant gene expression in precancerous and cancerous lesions by comparing the gene expression of stem-like cells in diseased tissues with normal stem cells |
| Entrez ID | Symbol | Replicates | Species | Organ | Tissue | Adj P-value | Log2FC | Malignancy |
| 521 | ATP5I | GSM4909280 | Human | Breast | Precancer | 4.76e-02 | -4.14e-01 | 0.0305 |
| 521 | ATP5I | GSM4909281 | Human | Breast | IDC | 1.24e-19 | -4.14e-01 | 0.21 |
| 521 | ATP5I | GSM4909282 | Human | Breast | IDC | 1.24e-19 | -4.14e-01 | -0.0288 |
| 521 | ATP5I | GSM4909285 | Human | Breast | IDC | 2.86e-19 | -4.14e-01 | 0.21 |
| 521 | ATP5I | GSM4909286 | Human | Breast | IDC | 5.35e-20 | -4.14e-01 | 0.1081 |
| 521 | ATP5I | GSM4909287 | Human | Breast | IDC | 1.15e-21 | -4.14e-01 | 0.2057 |
| 521 | ATP5I | GSM4909288 | Human | Breast | IDC | 4.73e-05 | -4.14e-01 | 0.0988 |
| 521 | ATP5I | GSM4909289 | Human | Breast | IDC | 1.76e-03 | -4.14e-01 | 0.1064 |
| 521 | ATP5I | GSM4909290 | Human | Breast | IDC | 1.58e-15 | -4.14e-01 | 0.2096 |
| 521 | ATP5I | GSM4909291 | Human | Breast | IDC | 1.39e-12 | -4.14e-01 | 0.1753 |
| 521 | ATP5I | GSM4909293 | Human | Breast | IDC | 2.86e-19 | -4.14e-01 | 0.1581 |
| 521 | ATP5I | GSM4909294 | Human | Breast | IDC | 5.35e-20 | -4.14e-01 | 0.2022 |
| 521 | ATP5I | GSM4909295 | Human | Breast | IDC | 6.99e-10 | -4.14e-01 | 0.0898 |
| 521 | ATP5I | GSM4909296 | Human | Breast | IDC | 2.31e-20 | -4.14e-01 | 0.1524 |
| 521 | ATP5I | GSM4909297 | Human | Breast | IDC | 4.25e-21 | -4.14e-01 | 0.1517 |
| 521 | ATP5I | GSM4909298 | Human | Breast | IDC | 9.92e-21 | -4.14e-01 | 0.1551 |
| 521 | ATP5I | GSM4909299 | Human | Breast | IDC | 6.58e-19 | -4.14e-01 | 0.035 |
| 521 | ATP5I | GSM4909300 | Human | Breast | IDC | 1.02e-08 | -4.14e-01 | 0.0334 |
| 521 | ATP5I | GSM4909301 | Human | Breast | IDC | 9.92e-21 | -4.14e-01 | 0.1577 |
| 521 | ATP5I | GSM4909302 | Human | Breast | IDC | 2.34e-21 | -4.14e-01 | 0.1545 |
| Page: 1 2 3 4 5 6 7 8 9 10 11 12 13 14 15 |
| Tissue | Expression Dynamics | Abbreviation |
| Breast |  | IDC: Invasive ductal carcinoma |
| DCIS: Ductal carcinoma in situ | ||
| Precancer(BRCA1-mut): Precancerous lesion from BRCA1 mutation carriers | ||
| Colorectum (GSE201348) |  | FAP: Familial adenomatous polyposis |
| CRC: Colorectal cancer | ||
| Colorectum (HTA11) |  | AD: Adenomas |
| SER: Sessile serrated lesions | ||
| MSI-H: Microsatellite-high colorectal cancer | ||
| MSS: Microsatellite stable colorectal cancer | ||
| Esophagus | 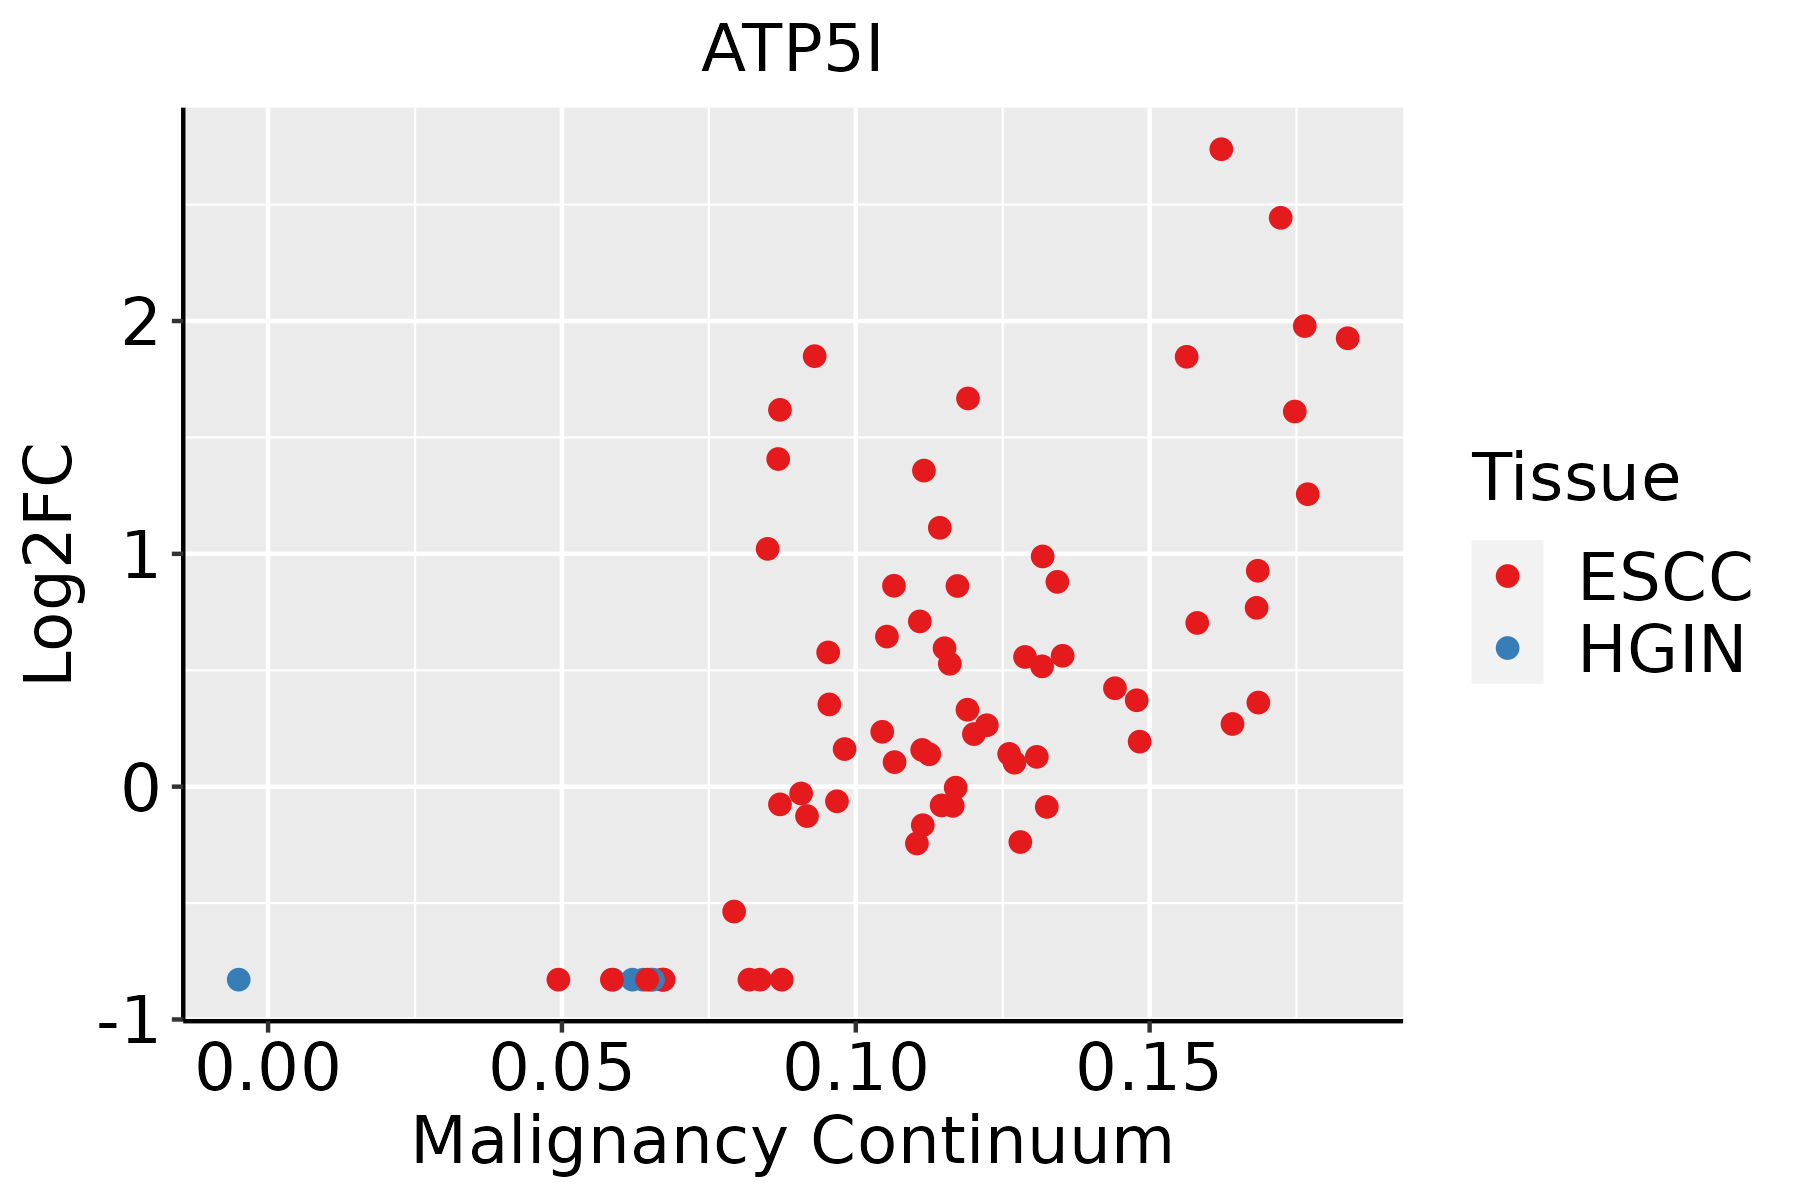 | ESCC: Esophageal squamous cell carcinoma |
| HGIN: High-grade intraepithelial neoplasias | ||
| LGIN: Low-grade intraepithelial neoplasias | ||
| GC |  | CAG: Chronic atrophic gastritis |
| CAG with IM: Chronic atrophic gastritis with intestinal metaplasia | ||
| CSG: Chronic superficial gastritis | ||
| GC: Gastric cancer | ||
| SIM: Severe intestinal metaplasia | ||
| WIM: Wild intestinal metaplasia | ||
| Liver | 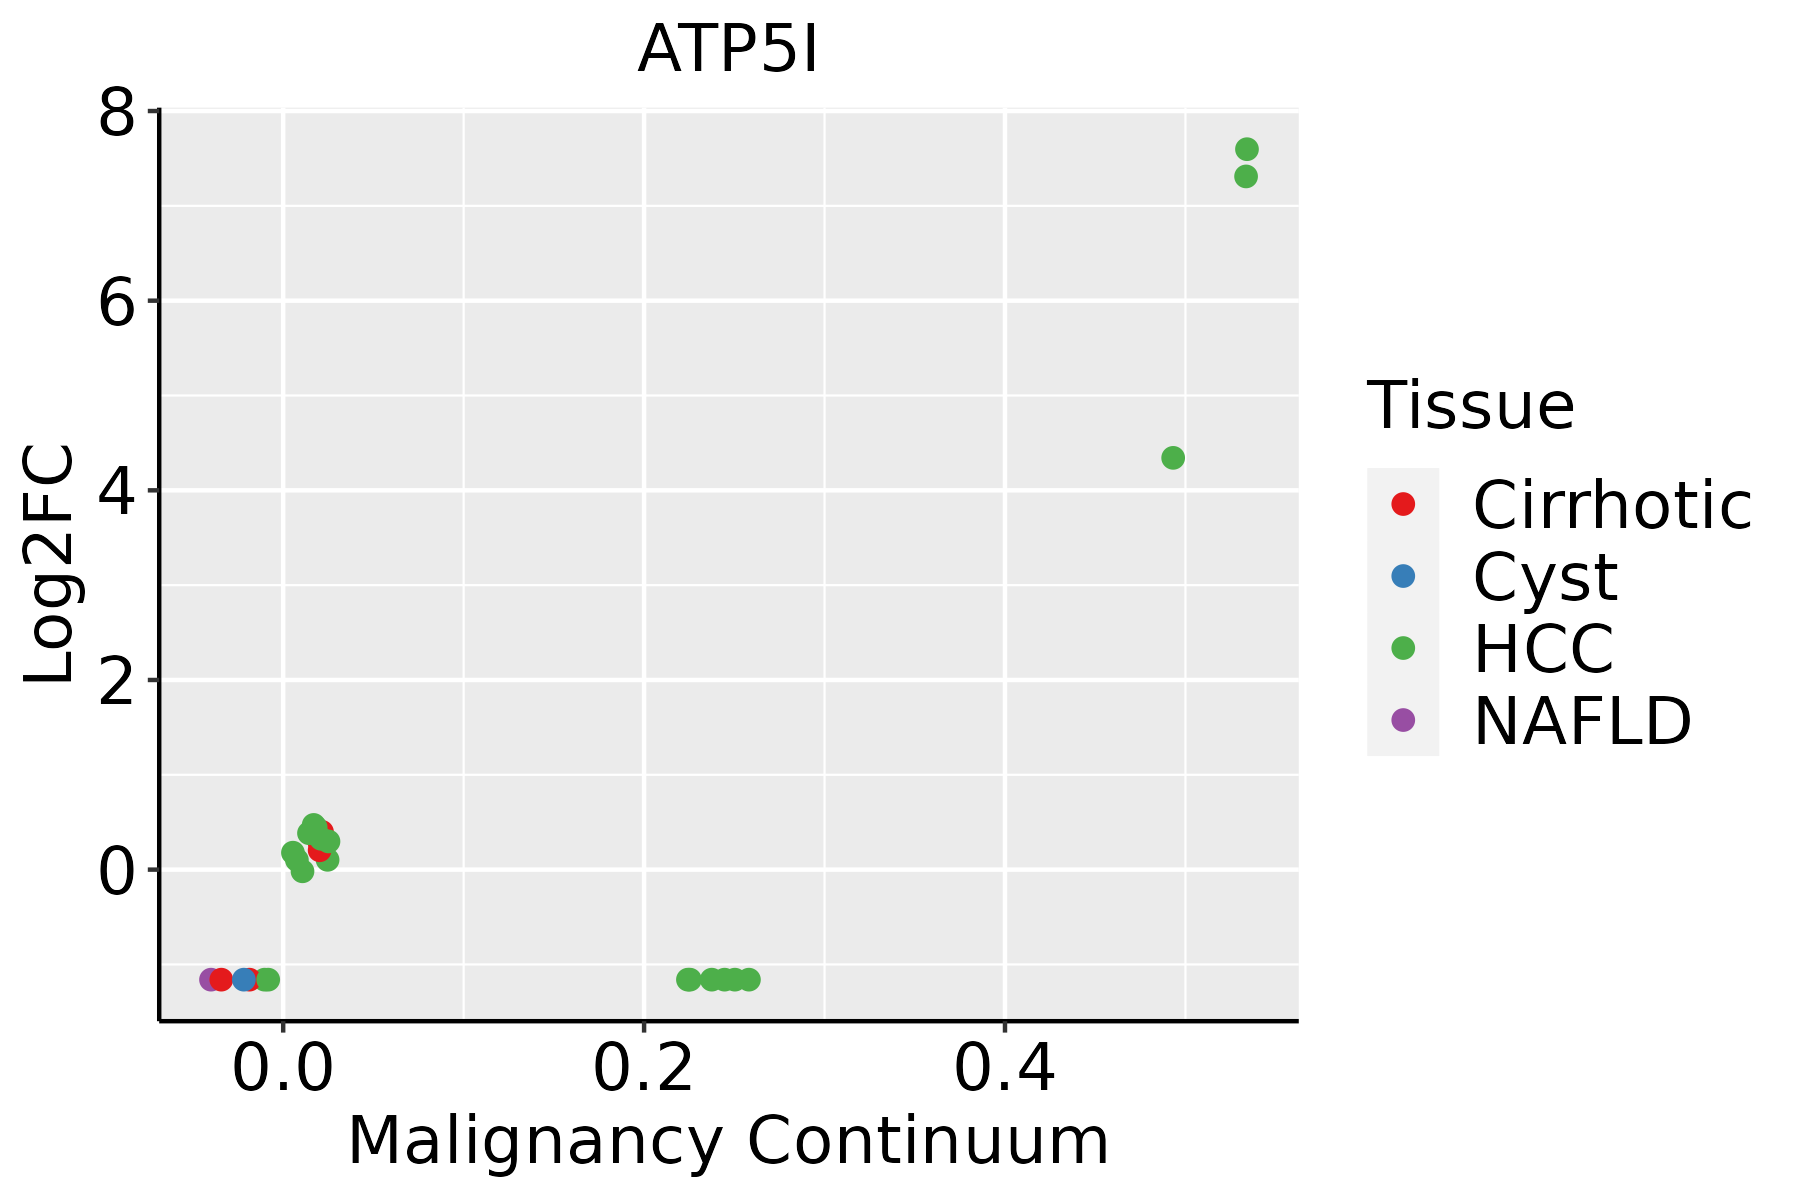 | HCC: Hepatocellular carcinoma |
| NAFLD: Non-alcoholic fatty liver disease | ||
| Lung |  | AAH: Atypical adenomatous hyperplasia |
| AIS: Adenocarcinoma in situ | ||
| IAC: Invasive lung adenocarcinoma | ||
| MIA: Minimally invasive adenocarcinoma | ||
| Oral Cavity |  | EOLP: Erosive Oral lichen planus |
| LP: leukoplakia | ||
| NEOLP: Non-erosive oral lichen planus | ||
| OSCC: Oral squamous cell carcinoma | ||
| Prostate | 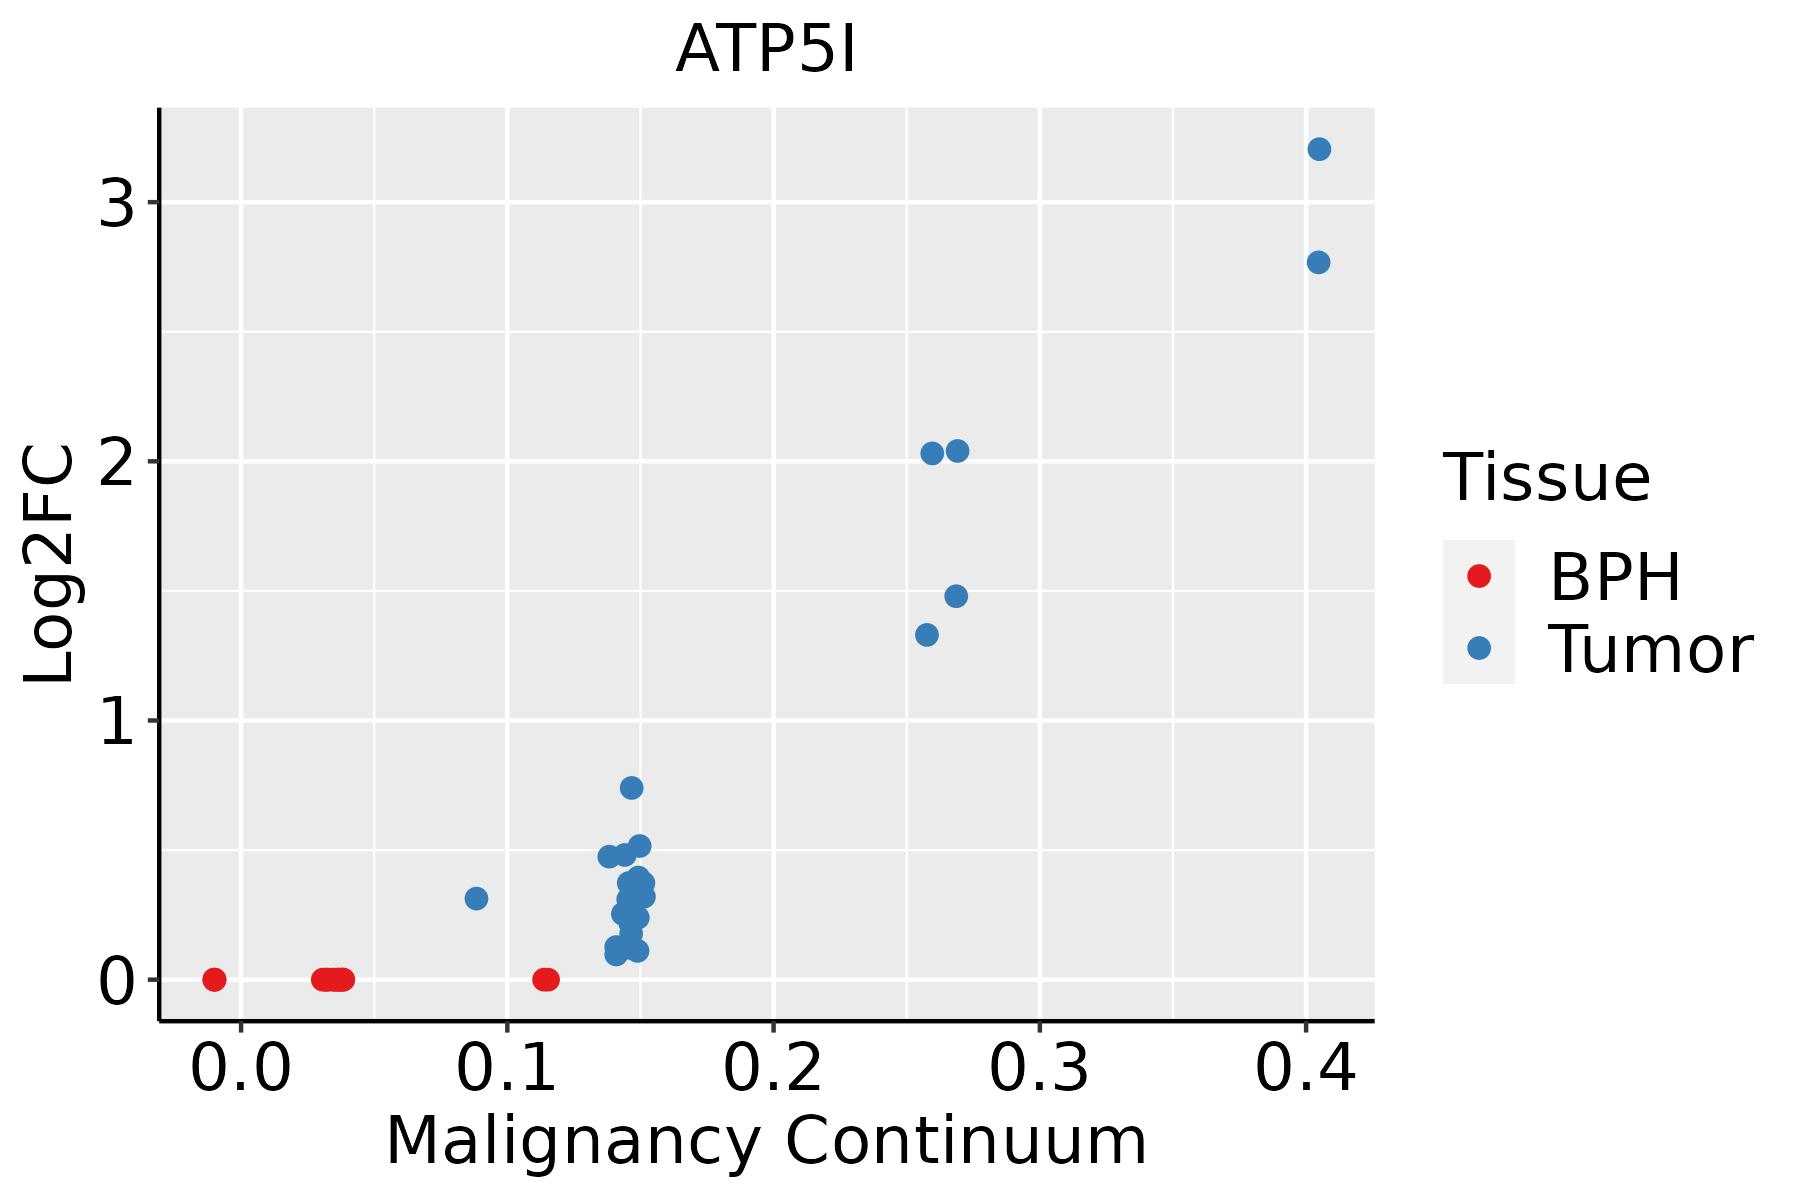 | BPH: Benign Prostatic Hyperplasia |
| Skin |  | AK: Actinic keratosis |
| cSCC: Cutaneous squamous cell carcinoma | ||
| SCCIS:squamous cell carcinoma in situ | ||
| Thyroid | 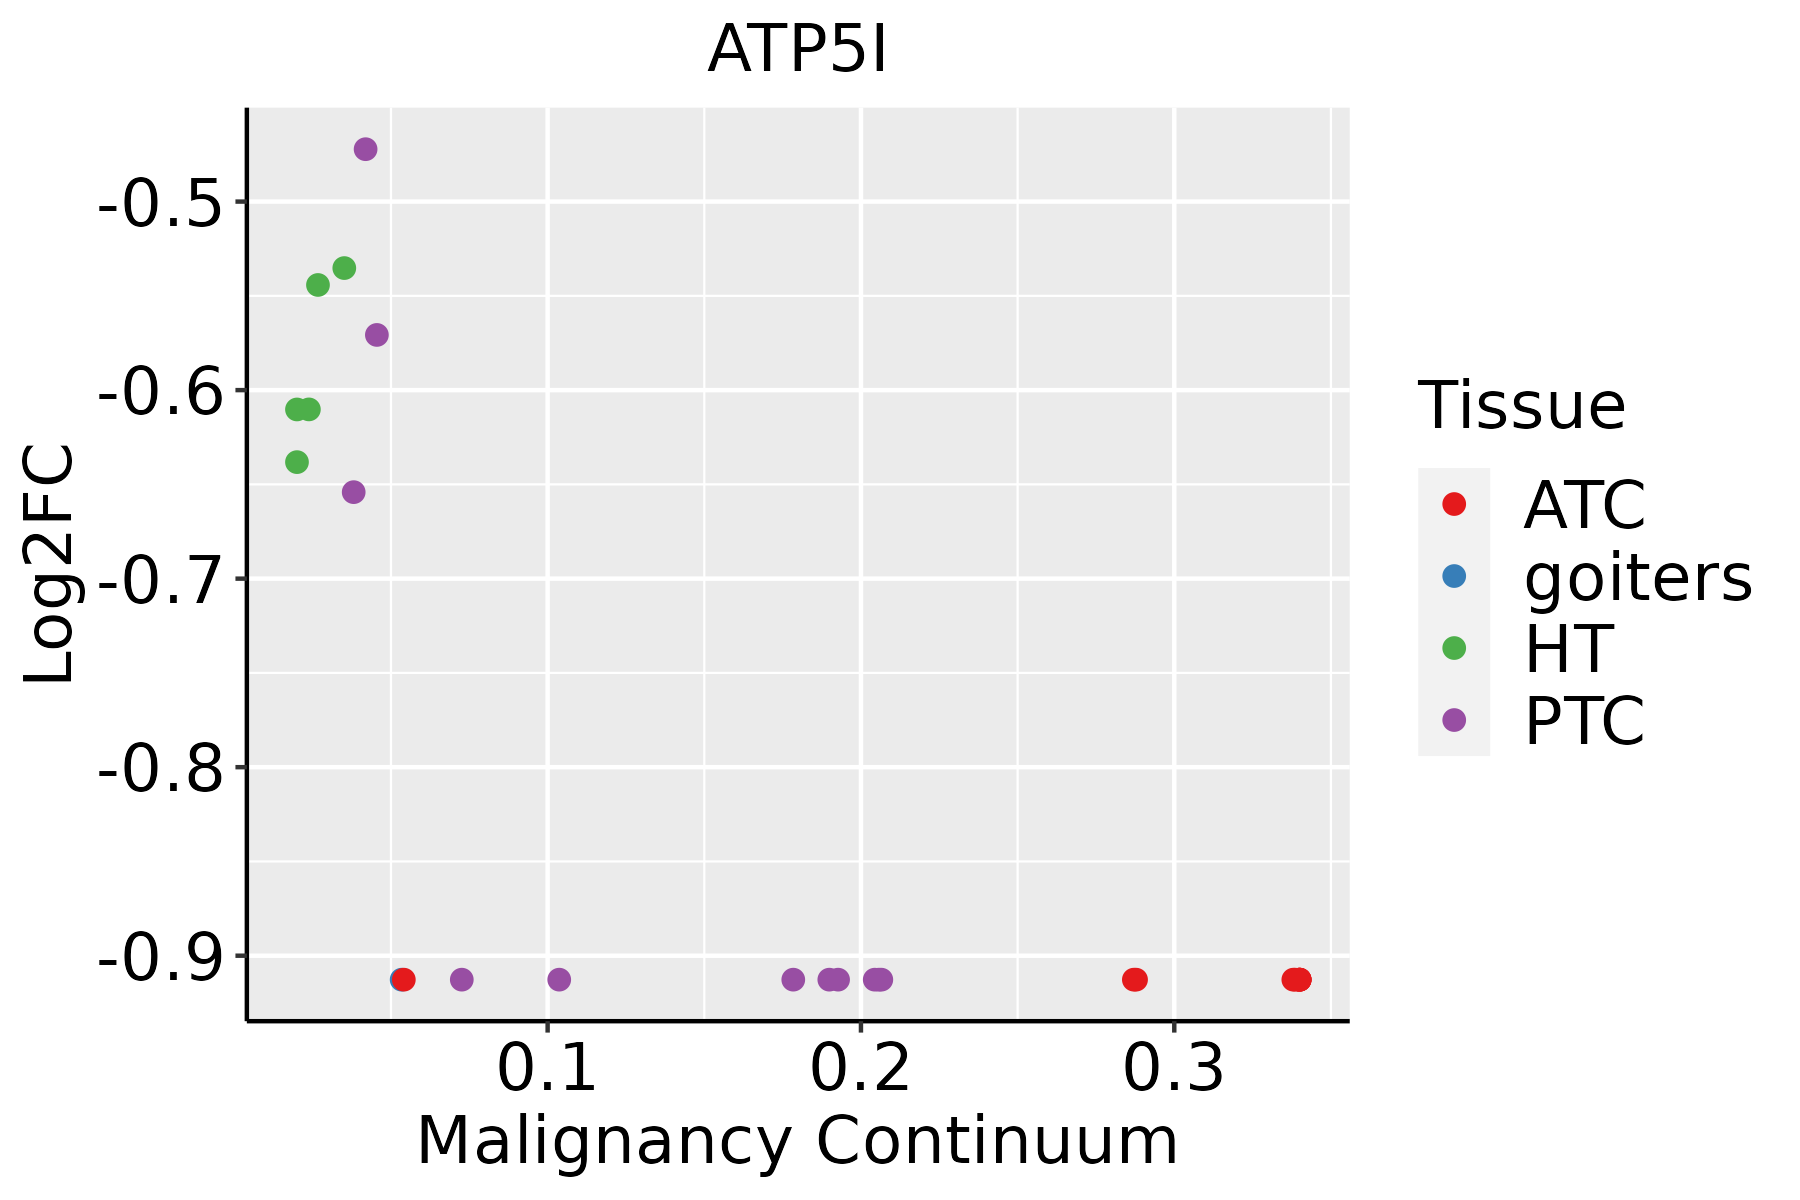 | ATC: Anaplastic thyroid cancer |
| HT: Hashimoto's thyroiditis | ||
| PTC: Papillary thyroid cancer |
| ∗log2FC in expression of this searched gene in stem-like cells from each diseased tissue sample relative to stem-like cells in normal samples in each tissue plotted against the malignancy continuum. Samples are colored based on if they are from different disease stage. |
Top |
Malignant transformation related pathway analysis |
| Find out the enriched GO biological processes and KEGG pathways involved in transition from healthy to precancer to cancer |
| Tissue | Disease Stage | Enriched GO biological Processes |
| Colorectum | AD |  |
| Colorectum | SER |  |
| Colorectum | MSS |  |
| Colorectum | MSI-H |  |
| Colorectum | FAP |  |
| ∗Top 15 enriched GO BP terms are showed in the bar plot of each disease state in each tissue. Each row represents a significant GO biological process which is colored according to the -log10(p.adjust). |
| Page: 1 2 3 4 5 6 7 8 9 |
| GO ID | Tissue | Disease Stage | Description | Gene Ratio | Bg Ratio | pvalue | p.adjust | Count |
| GO:1903364112 | Skin | SCCIS | positive regulation of cellular protein catabolic process | 26/919 | 155/18723 | 3.64e-08 | 7.72e-06 | 26 |
| GO:1903050112 | Skin | SCCIS | regulation of proteolysis involved in cellular protein catabolic process | 32/919 | 221/18723 | 3.93e-08 | 7.72e-06 | 32 |
| GO:0050673110 | Skin | SCCIS | epithelial cell proliferation | 48/919 | 437/18723 | 1.56e-07 | 1.84e-05 | 48 |
| GO:0045862112 | Skin | SCCIS | positive regulation of proteolysis | 43/919 | 372/18723 | 1.69e-07 | 1.91e-05 | 43 |
| GO:0009896112 | Skin | SCCIS | positive regulation of catabolic process | 49/919 | 492/18723 | 2.10e-06 | 1.09e-04 | 49 |
| GO:0030099112 | Skin | SCCIS | myeloid cell differentiation | 41/919 | 381/18723 | 2.11e-06 | 1.09e-04 | 41 |
| GO:1903052111 | Skin | SCCIS | positive regulation of proteolysis involved in cellular protein catabolic process | 20/919 | 133/18723 | 7.61e-06 | 2.80e-04 | 20 |
| GO:005067819 | Skin | SCCIS | regulation of epithelial cell proliferation | 39/919 | 381/18723 | 1.22e-05 | 4.13e-04 | 39 |
| GO:0051346111 | Skin | SCCIS | negative regulation of hydrolase activity | 38/919 | 379/18723 | 2.49e-05 | 6.97e-04 | 38 |
| GO:0031331112 | Skin | SCCIS | positive regulation of cellular catabolic process | 41/919 | 427/18723 | 3.33e-05 | 8.88e-04 | 41 |
| GO:0048872112 | Skin | SCCIS | homeostasis of number of cells | 27/919 | 272/18723 | 4.19e-04 | 6.73e-03 | 27 |
| GO:005068011 | Skin | SCCIS | negative regulation of epithelial cell proliferation | 18/919 | 164/18723 | 1.18e-03 | 1.40e-02 | 18 |
| GO:0034101112 | Skin | SCCIS | erythrocyte homeostasis | 15/919 | 129/18723 | 1.66e-03 | 1.84e-02 | 15 |
| GO:0006839111 | Skin | SCCIS | mitochondrial transport | 24/919 | 254/18723 | 1.68e-03 | 1.84e-02 | 24 |
| GO:0072594111 | Skin | SCCIS | establishment of protein localization to organelle | 35/919 | 422/18723 | 1.77e-03 | 1.90e-02 | 35 |
| GO:0033157111 | Skin | SCCIS | regulation of intracellular protein transport | 22/919 | 229/18723 | 2.09e-03 | 2.14e-02 | 22 |
| GO:0008637111 | Skin | SCCIS | apoptotic mitochondrial changes | 13/919 | 107/18723 | 2.23e-03 | 2.24e-02 | 13 |
| GO:0070585111 | Skin | SCCIS | protein localization to mitochondrion | 14/919 | 125/18723 | 3.31e-03 | 2.97e-02 | 14 |
| GO:0002262112 | Skin | SCCIS | myeloid cell homeostasis | 16/919 | 157/18723 | 4.54e-03 | 3.78e-02 | 16 |
| GO:0030218112 | Skin | SCCIS | erythrocyte differentiation | 13/919 | 120/18723 | 6.03e-03 | 4.63e-02 | 13 |
| Page: 1 2 3 4 5 6 7 8 9 10 11 12 13 14 15 16 17 18 19 20 21 22 23 24 25 26 27 28 29 30 31 32 33 34 35 36 37 38 39 40 41 42 43 44 45 46 47 48 49 50 51 52 53 54 55 |
| Pathway ID | Tissue | Disease Stage | Description | Gene Ratio | Bg Ratio | pvalue | p.adjust | qvalue | Count |
| hsa0019016 | Breast | Precancer | Oxidative phosphorylation | 59/684 | 134/8465 | 6.15e-30 | 3.24e-28 | 2.48e-28 | 59 |
| hsa0471418 | Breast | Precancer | Thermogenesis | 68/684 | 232/8465 | 4.40e-22 | 1.26e-20 | 9.69e-21 | 68 |
| hsa0019017 | Breast | Precancer | Oxidative phosphorylation | 59/684 | 134/8465 | 6.15e-30 | 3.24e-28 | 2.48e-28 | 59 |
| hsa0471419 | Breast | Precancer | Thermogenesis | 68/684 | 232/8465 | 4.40e-22 | 1.26e-20 | 9.69e-21 | 68 |
| hsa0019023 | Breast | IDC | Oxidative phosphorylation | 62/867 | 134/8465 | 4.78e-27 | 2.59e-25 | 1.94e-25 | 62 |
| hsa0471424 | Breast | IDC | Thermogenesis | 75/867 | 232/8465 | 8.41e-21 | 3.04e-19 | 2.27e-19 | 75 |
| hsa0019033 | Breast | IDC | Oxidative phosphorylation | 62/867 | 134/8465 | 4.78e-27 | 2.59e-25 | 1.94e-25 | 62 |
| hsa0471434 | Breast | IDC | Thermogenesis | 75/867 | 232/8465 | 8.41e-21 | 3.04e-19 | 2.27e-19 | 75 |
| hsa0019043 | Breast | DCIS | Oxidative phosphorylation | 61/846 | 134/8465 | 9.84e-27 | 5.30e-25 | 3.90e-25 | 61 |
| hsa0471443 | Breast | DCIS | Thermogenesis | 74/846 | 232/8465 | 8.72e-21 | 3.13e-19 | 2.30e-19 | 74 |
| hsa0019053 | Breast | DCIS | Oxidative phosphorylation | 61/846 | 134/8465 | 9.84e-27 | 5.30e-25 | 3.90e-25 | 61 |
| hsa0471453 | Breast | DCIS | Thermogenesis | 74/846 | 232/8465 | 8.72e-21 | 3.13e-19 | 2.30e-19 | 74 |
| hsa0019018 | Cervix | CC | Oxidative phosphorylation | 64/1267 | 134/8465 | 1.25e-19 | 8.07e-18 | 4.77e-18 | 64 |
| hsa0471420 | Cervix | CC | Thermogenesis | 76/1267 | 232/8465 | 4.29e-12 | 1.16e-10 | 6.85e-11 | 76 |
| hsa0019019 | Cervix | CC | Oxidative phosphorylation | 64/1267 | 134/8465 | 1.25e-19 | 8.07e-18 | 4.77e-18 | 64 |
| hsa04714110 | Cervix | CC | Thermogenesis | 76/1267 | 232/8465 | 4.29e-12 | 1.16e-10 | 6.85e-11 | 76 |
| hsa0019024 | Cervix | HSIL_HPV | Oxidative phosphorylation | 25/459 | 134/8465 | 4.23e-08 | 1.55e-06 | 1.25e-06 | 25 |
| hsa0471425 | Cervix | HSIL_HPV | Thermogenesis | 25/459 | 232/8465 | 7.63e-04 | 5.88e-03 | 4.76e-03 | 25 |
| hsa0019034 | Cervix | HSIL_HPV | Oxidative phosphorylation | 25/459 | 134/8465 | 4.23e-08 | 1.55e-06 | 1.25e-06 | 25 |
| hsa0471435 | Cervix | HSIL_HPV | Thermogenesis | 25/459 | 232/8465 | 7.63e-04 | 5.88e-03 | 4.76e-03 | 25 |
| Page: 1 2 3 4 |
Top |
Cell-cell communication analysis |
| Identification of potential cell-cell interactions between two cell types and their ligand-receptor pairs for different disease states |
| Ligand | Receptor | LRpair | Pathway | Tissue | Disease Stage |
| Page: 1 |
Top |
Single-cell gene regulatory network inference analysis |
| Find out the significant the regulons (TFs) and the target genes of each regulon across cell types for different disease states |
| TF | Cell Type | Tissue | Disease Stage | Target Gene | RSS | Regulon Activity |
| ∗The dot plots of a searched regulon are shown for all cell subpopulations in each disease state of each tissue based on the regulon specific score inferred using pySCENIC and by calculating the average expression. |
| Page: 1 |
Top |
Somatic mutation of malignant transformation related genes |
| Annotation of somatic variants for genes involved in malignant transformation |
| Hugo Symbol | Variant Class | Variant Classification | dbSNP RS | HGVSc | HGVSp | HGVSp Short | SWISSPROT | BIOTYPE | SIFT | PolyPhen | Tumor Sample Barcode | Tissue | Histology | Sex | Age | Stage | Therapy Types | Drugs | Outcome |
| ATP5I | insertion | Nonsense_Mutation | novel | c.207_208insGTCTCCCAGTGGTAACTATCCAAAAATGGATGAGTAA | p.Ter70ValfsTer5 | p.*70Vfs*5 | P56385 | protein_coding | TCGA-AO-A03R-01 | Breast | breast invasive carcinoma | Female | <65 | I/II | Chemotherapy | doxorubicin | SD | ||
| ATP5I | SNV | Missense_Mutation | novel | c.141N>T | p.Glu47Asp | p.E47D | P56385 | protein_coding | tolerated(0.09) | possibly_damaging(0.687) | TCGA-AX-A2HC-01 | Endometrium | uterine corpus endometrioid carcinoma | Female | <65 | III/IV | Chemotherapy | paclitaxel | PD |
| ATP5I | SNV | Missense_Mutation | c.137N>G | p.Glu46Gly | p.E46G | P56385 | protein_coding | deleterious(0) | possibly_damaging(0.817) | TCGA-D1-A103-01 | Endometrium | uterine corpus endometrioid carcinoma | Female | >=65 | I/II | Unknown | Unknown | SD | |
| ATP5I | SNV | Missense_Mutation | c.119A>G | p.Glu40Gly | p.E40G | P56385 | protein_coding | deleterious(0.03) | possibly_damaging(0.775) | TCGA-D1-A16Y-01 | Endometrium | uterine corpus endometrioid carcinoma | Female | <65 | I/II | Unknown | Unknown | SD | |
| ATP5I | SNV | Missense_Mutation | novel | c.197G>T | p.Ser66Ile | p.S66I | P56385 | protein_coding | deleterious(0.01) | benign(0.289) | TCGA-EO-A22U-01 | Endometrium | uterine corpus endometrioid carcinoma | Female | >=65 | I/II | Unknown | Unknown | SD |
| Page: 1 |
Top |
Related drugs of malignant transformation related genes |
| Identification of chemicals and drugs interact with genes involved in malignant transfromation |
| (DGIdb 4.0) |
| Entrez ID | Symbol | Category | Interaction Types | Drug Claim Name | Drug Name | PMIDs |
| Page: 1 |

Copyright 2023-Present -The University of Texas Health Science Center at Houston |