
|
|||||
|
 | |
| |
| |
| |
| |
| |
|
Gene: ADAM17 |
Gene summary for ADAM17 |
| Gene information | Species | Human | Gene symbol | ADAM17 | Gene ID | 6868 |
| Gene name | ADAM metallopeptidase domain 17 | |
| Gene Alias | ADAM18 | |
| Cytomap | 2p25.1 | |
| Gene Type | protein-coding | GO ID | GO:0000079 | UniProtAcc | B2RNB2 |
Top |
Malignant transformation analysis |
| Identification of the aberrant gene expression in precancerous and cancerous lesions by comparing the gene expression of stem-like cells in diseased tissues with normal stem cells |
| Entrez ID | Symbol | Replicates | Species | Organ | Tissue | Adj P-value | Log2FC | Malignancy |
| 6868 | ADAM17 | CA_HPV_3 | Human | Cervix | CC | 2.91e-02 | -2.03e-01 | 0.0414 |
| 6868 | ADAM17 | N_HPV_1 | Human | Cervix | N_HPV | 7.21e-05 | -2.21e-01 | 0.0079 |
| 6868 | ADAM17 | N_HPV_2 | Human | Cervix | N_HPV | 2.07e-03 | 3.11e-02 | -0.0131 |
| 6868 | ADAM17 | CCI_1 | Human | Cervix | CC | 1.66e-03 | 9.42e-01 | 0.528 |
| 6868 | ADAM17 | CCI_2 | Human | Cervix | CC | 1.31e-02 | 7.74e-01 | 0.5249 |
| 6868 | ADAM17 | CCI_3 | Human | Cervix | CC | 3.60e-03 | 5.96e-01 | 0.516 |
| 6868 | ADAM17 | T3 | Human | Cervix | CC | 8.03e-03 | 1.46e-01 | 0.1389 |
| 6868 | ADAM17 | AEH-subject1 | Human | Endometrium | AEH | 4.24e-07 | 2.73e-01 | -0.3059 |
| 6868 | ADAM17 | AEH-subject3 | Human | Endometrium | AEH | 4.73e-03 | 1.52e-01 | -0.2576 |
| 6868 | ADAM17 | AEH-subject4 | Human | Endometrium | AEH | 9.57e-14 | 5.61e-01 | -0.2657 |
| 6868 | ADAM17 | EEC-subject1 | Human | Endometrium | EEC | 7.37e-08 | 3.29e-01 | -0.2682 |
| 6868 | ADAM17 | GSM6177620_NYU_UCEC1_lib1_lib1 | Human | Endometrium | EEC | 7.51e-05 | -7.85e-02 | -0.1869 |
| 6868 | ADAM17 | GSM6177620_NYU_UCEC1_lib2_lib2 | Human | Endometrium | EEC | 4.40e-06 | -3.11e-02 | -0.1875 |
| 6868 | ADAM17 | GSM6177620_NYU_UCEC1_lib3_lib3 | Human | Endometrium | EEC | 1.37e-08 | -1.19e-01 | -0.1883 |
| 6868 | ADAM17 | GSM6177621_NYU_UCEC2_lib1_lib1 | Human | Endometrium | EEC | 7.98e-09 | 7.08e-02 | -0.1934 |
| 6868 | ADAM17 | GSM6177622_NYU_UCEC3_lib1_lib1 | Human | Endometrium | EEC | 9.01e-12 | -7.43e-03 | -0.1917 |
| 6868 | ADAM17 | GSM6177622_NYU_UCEC3_lib2_lib2 | Human | Endometrium | EEC | 6.86e-11 | 5.67e-03 | -0.1916 |
| 6868 | ADAM17 | LZE4T | Human | Esophagus | ESCC | 1.16e-13 | 7.43e-01 | 0.0811 |
| 6868 | ADAM17 | LZE7T | Human | Esophagus | ESCC | 9.31e-13 | 4.44e-01 | 0.0667 |
| 6868 | ADAM17 | LZE8T | Human | Esophagus | ESCC | 1.35e-03 | 1.56e-01 | 0.067 |
| Page: 1 2 3 4 5 6 7 |
| Tissue | Expression Dynamics | Abbreviation |
| Cervix | 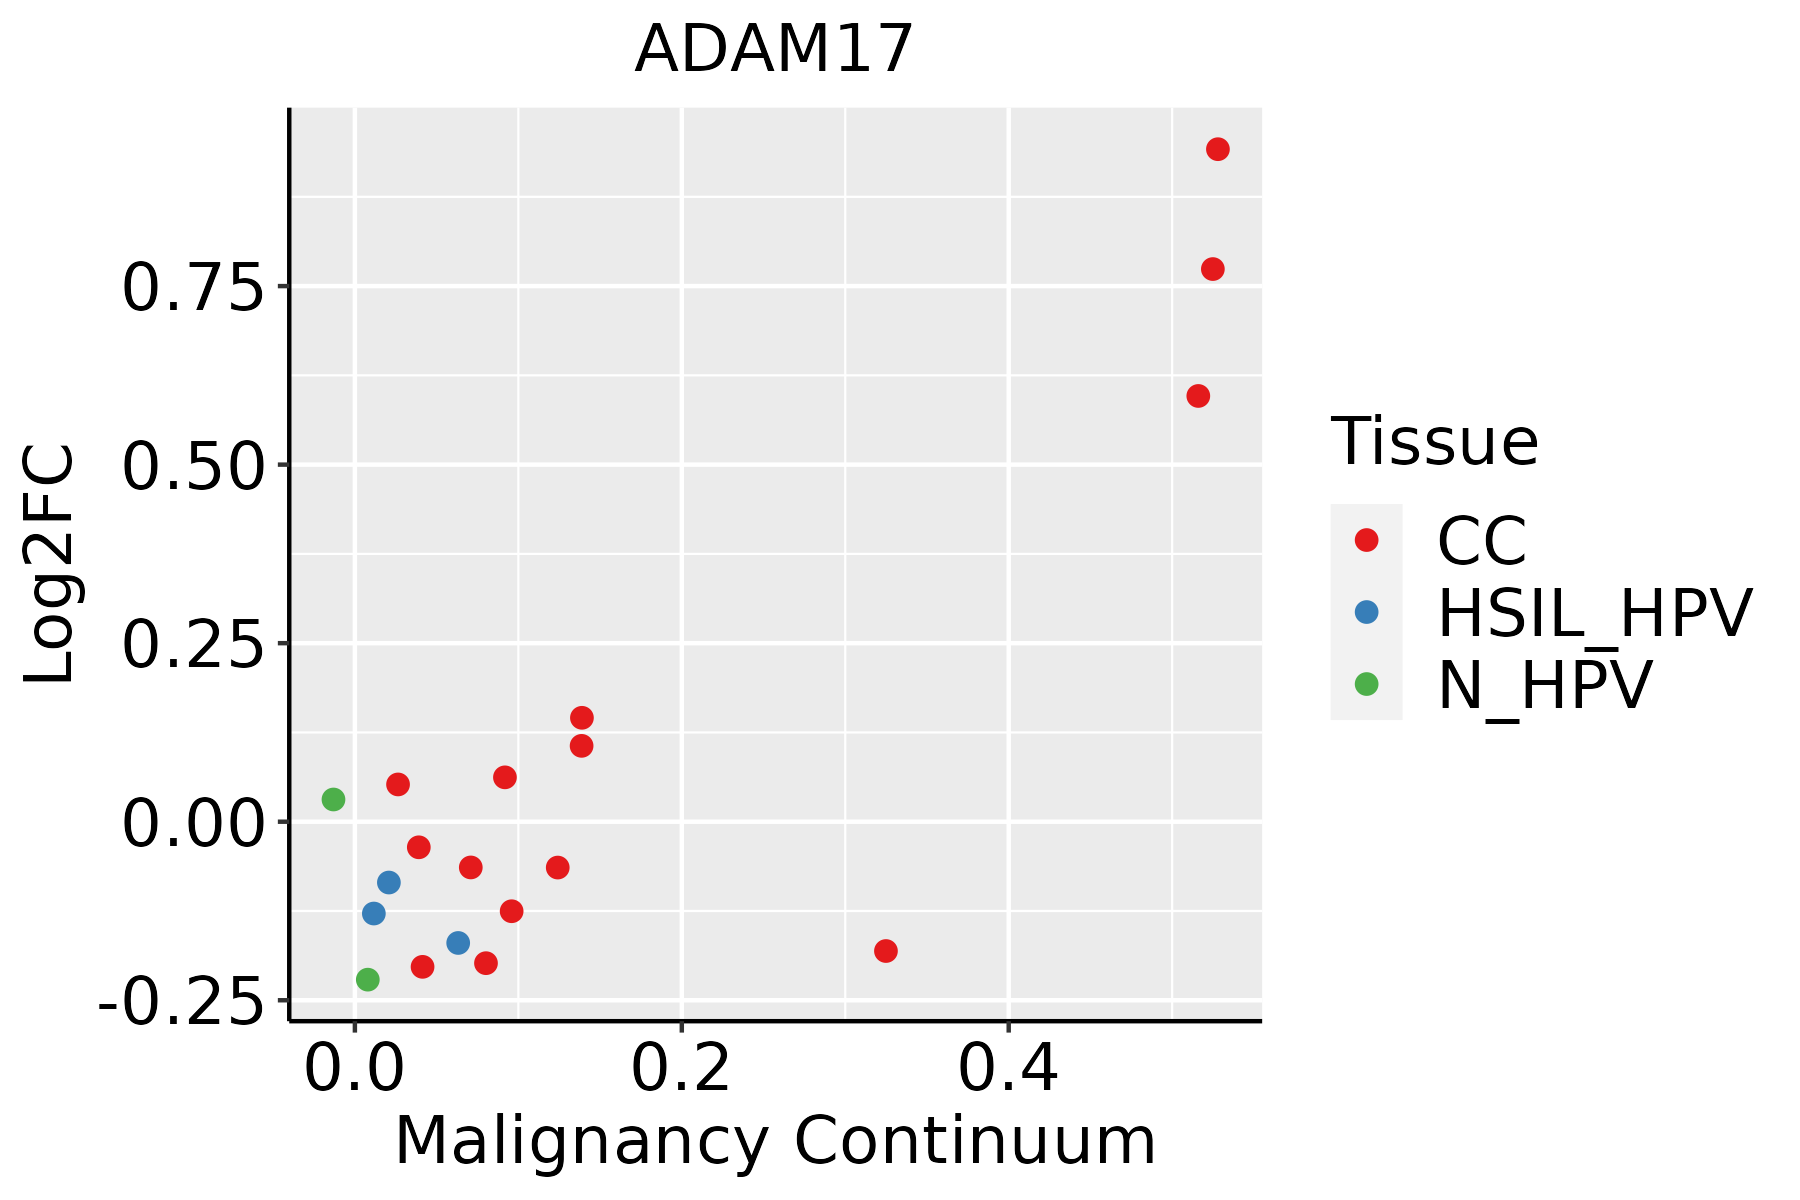 | CC: Cervix cancer |
| HSIL_HPV: HPV-infected high-grade squamous intraepithelial lesions | ||
| N_HPV: HPV-infected normal cervix | ||
| Endometrium |  | AEH: Atypical endometrial hyperplasia |
| EEC: Endometrioid Cancer | ||
| Esophagus | 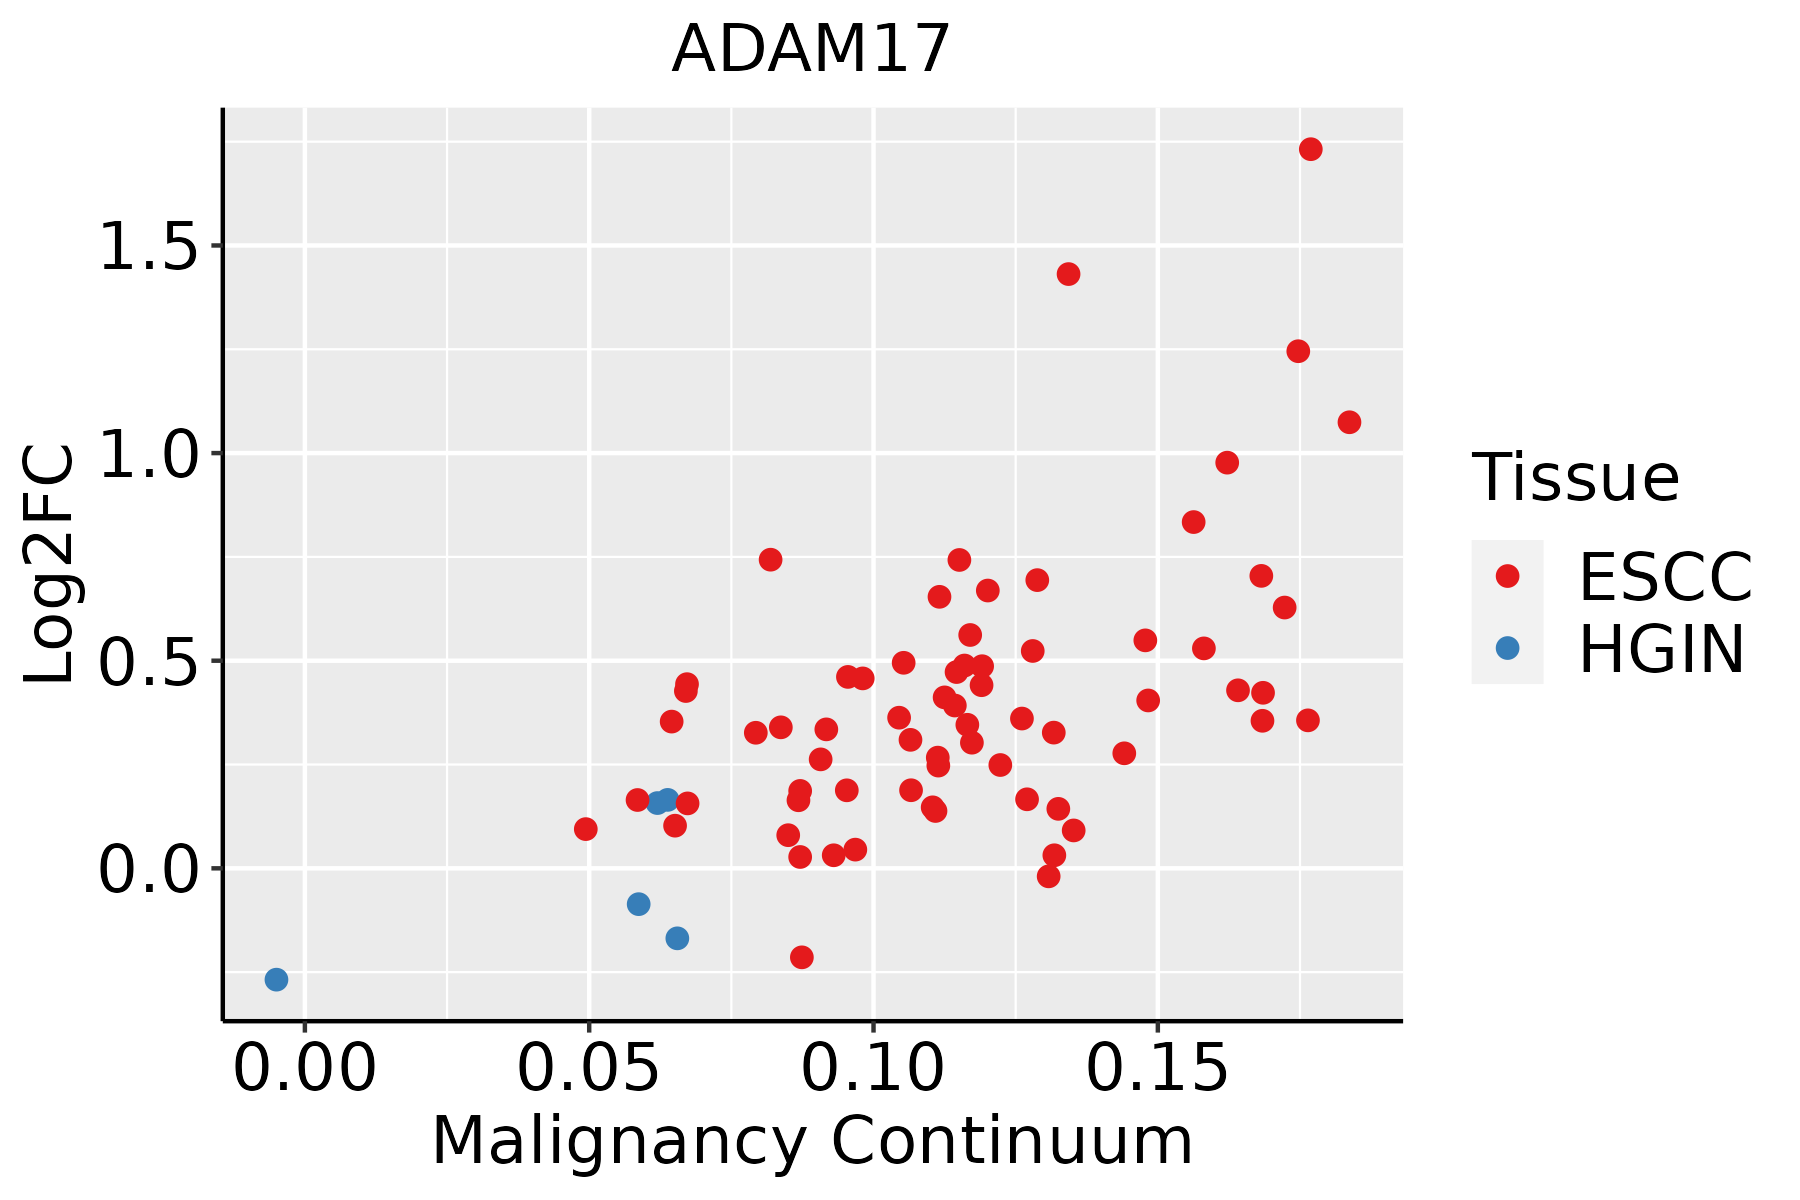 | ESCC: Esophageal squamous cell carcinoma |
| HGIN: High-grade intraepithelial neoplasias | ||
| LGIN: Low-grade intraepithelial neoplasias | ||
| Liver | 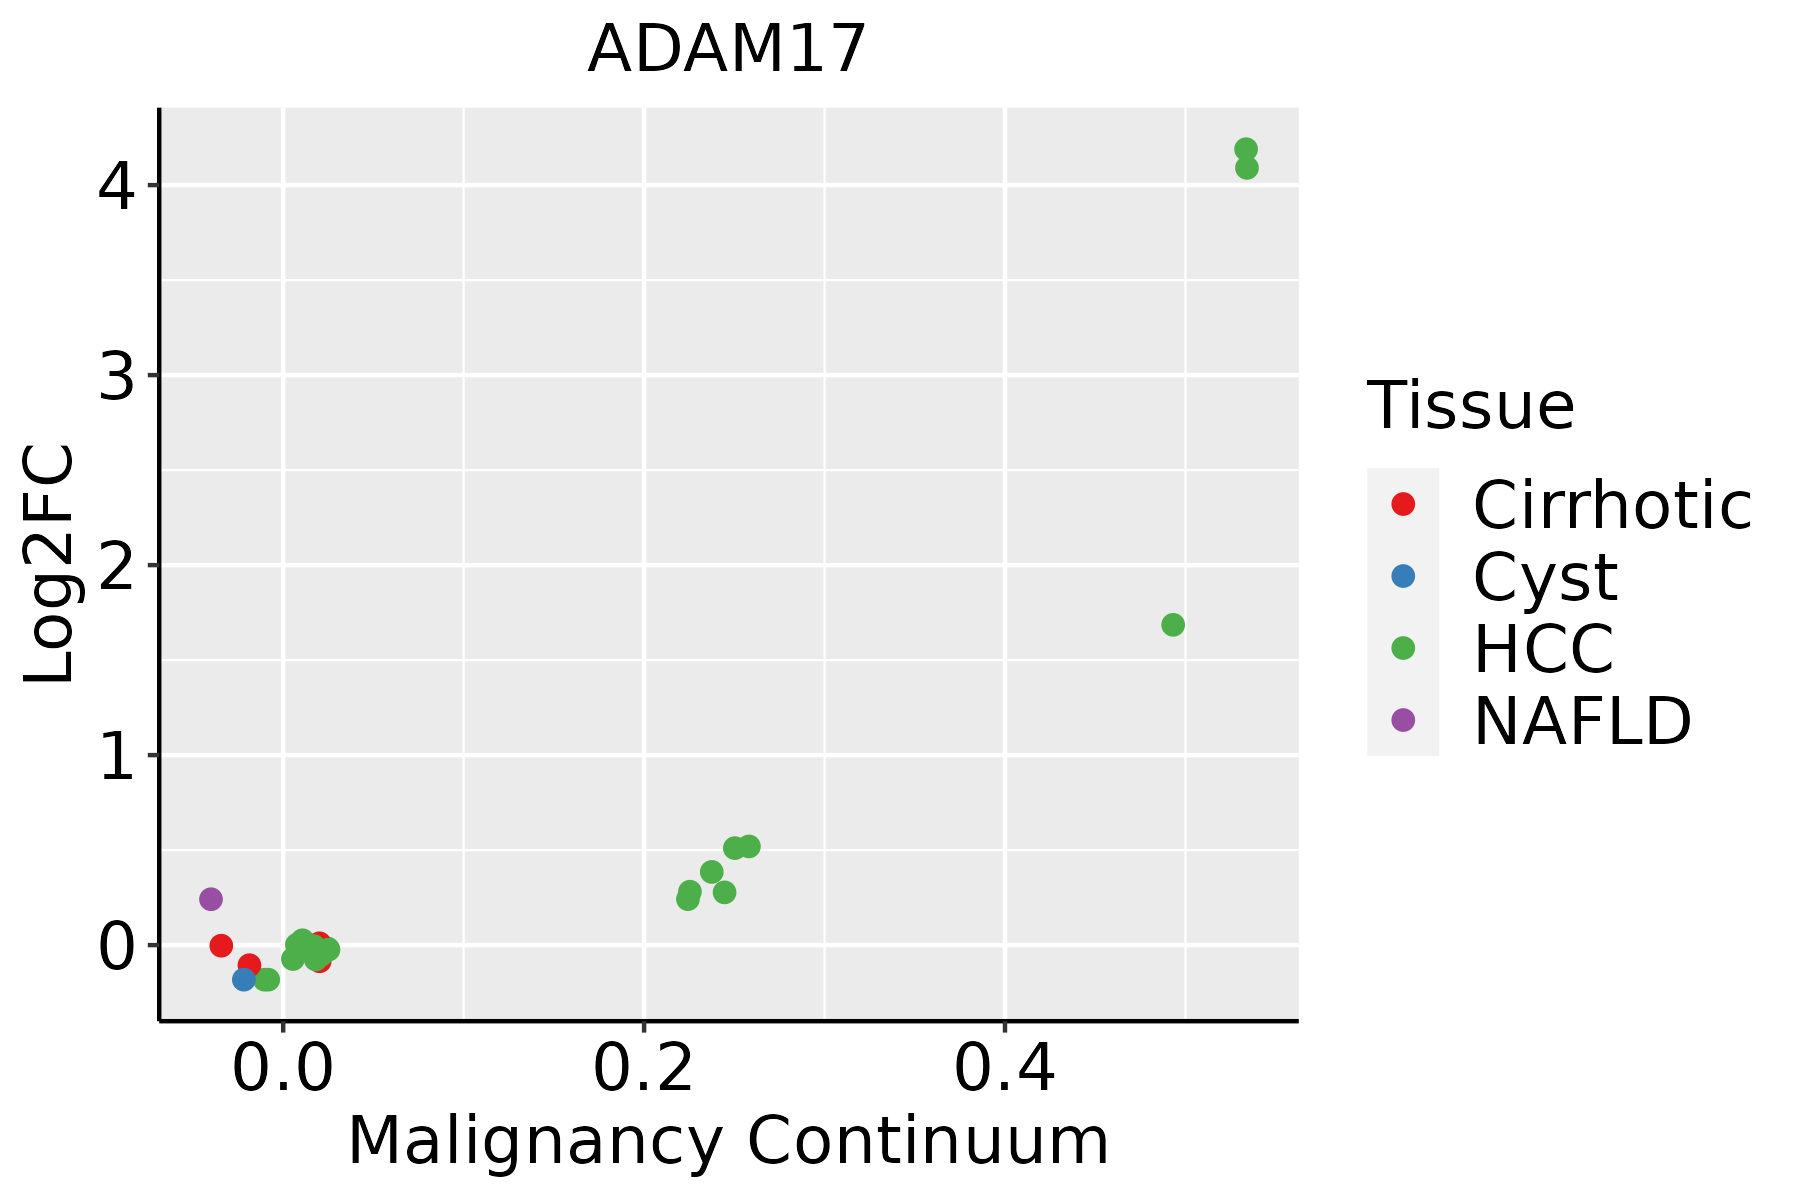 | HCC: Hepatocellular carcinoma |
| NAFLD: Non-alcoholic fatty liver disease | ||
| Lung |  | AAH: Atypical adenomatous hyperplasia |
| AIS: Adenocarcinoma in situ | ||
| IAC: Invasive lung adenocarcinoma | ||
| MIA: Minimally invasive adenocarcinoma | ||
| Oral Cavity | 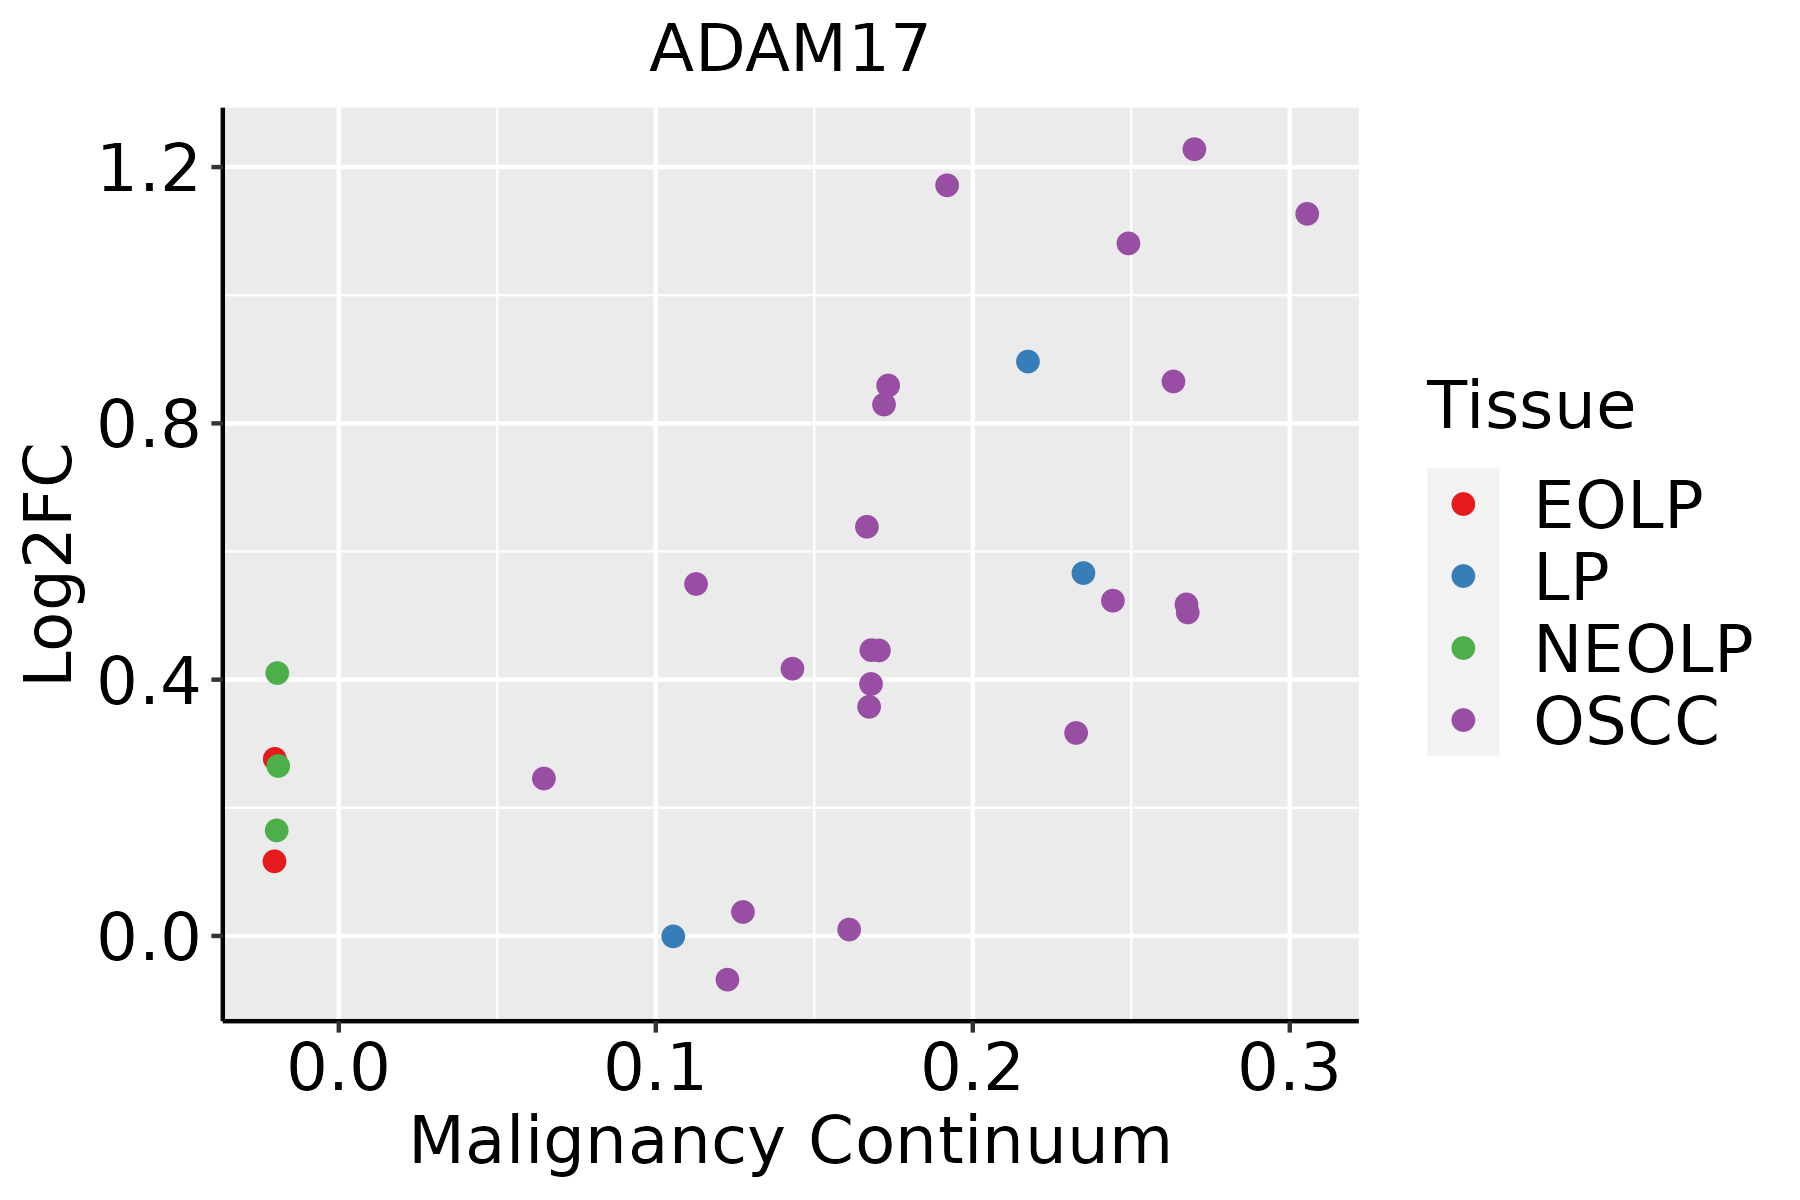 | EOLP: Erosive Oral lichen planus |
| LP: leukoplakia | ||
| NEOLP: Non-erosive oral lichen planus | ||
| OSCC: Oral squamous cell carcinoma | ||
| Skin | 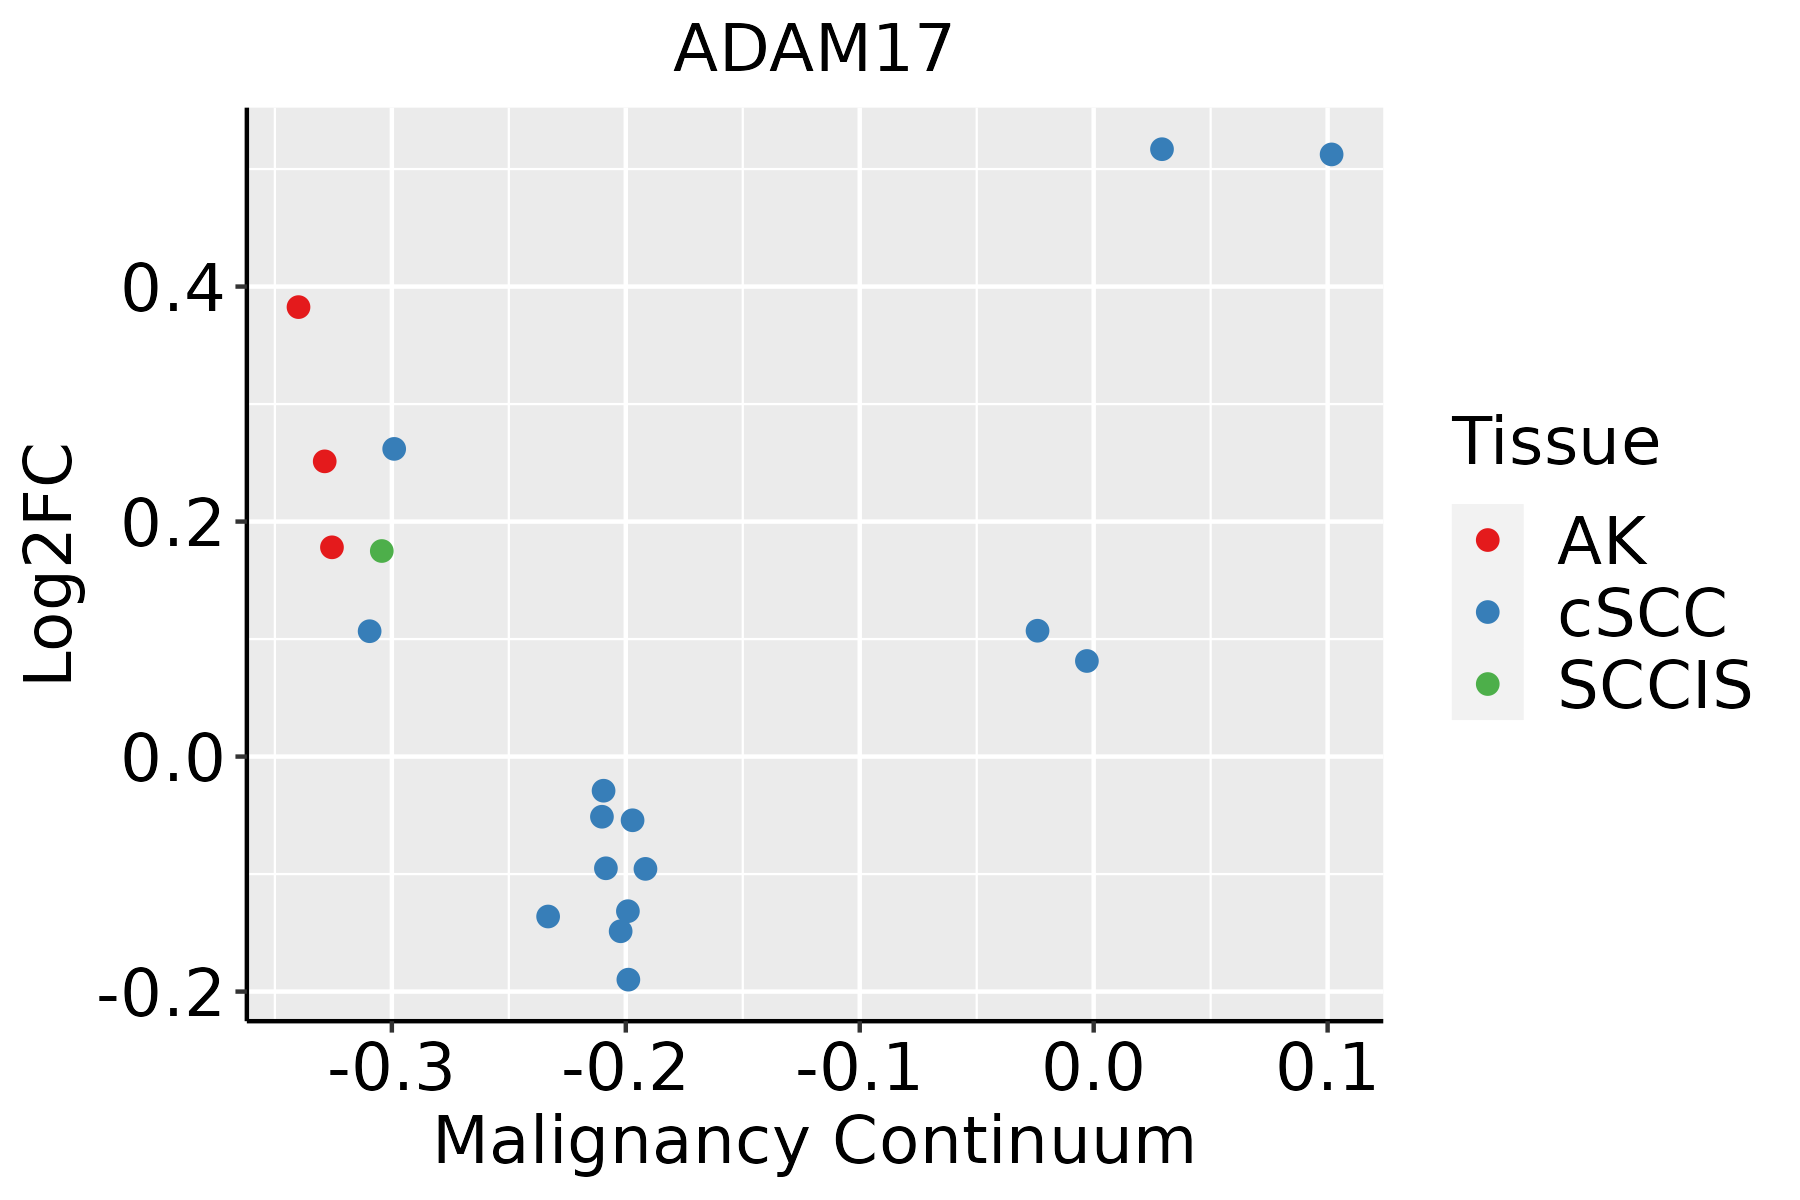 | AK: Actinic keratosis |
| cSCC: Cutaneous squamous cell carcinoma | ||
| SCCIS:squamous cell carcinoma in situ | ||
| Thyroid |  | ATC: Anaplastic thyroid cancer |
| HT: Hashimoto's thyroiditis | ||
| PTC: Papillary thyroid cancer |
| ∗log2FC in expression of this searched gene in stem-like cells from each diseased tissue sample relative to stem-like cells in normal samples in each tissue plotted against the malignancy continuum. Samples are colored based on if they are from different disease stage. |
Top |
Malignant transformation related pathway analysis |
| Find out the enriched GO biological processes and KEGG pathways involved in transition from healthy to precancer to cancer |
| Tissue | Disease Stage | Enriched GO biological Processes |
| Colorectum | AD |  |
| Colorectum | SER |  |
| Colorectum | MSS |  |
| Colorectum | MSI-H |  |
| Colorectum | FAP |  |
| ∗Top 15 enriched GO BP terms are showed in the bar plot of each disease state in each tissue. Each row represents a significant GO biological process which is colored according to the -log10(p.adjust). |
| Page: 1 2 3 4 5 6 7 8 9 |
| GO ID | Tissue | Disease Stage | Description | Gene Ratio | Bg Ratio | pvalue | p.adjust | Count |
| GO:000166625 | Skin | AK | response to hypoxia | 49/1910 | 307/18723 | 1.05e-03 | 8.20e-03 | 49 |
| GO:000223720 | Skin | AK | response to molecule of bacterial origin | 56/1910 | 363/18723 | 1.10e-03 | 8.60e-03 | 56 |
| GO:00330772 | Skin | AK | T cell differentiation in thymus | 17/1910 | 75/18723 | 1.22e-03 | 9.32e-03 | 17 |
| GO:00300985 | Skin | AK | lymphocyte differentiation | 57/1910 | 374/18723 | 1.34e-03 | 1.00e-02 | 57 |
| GO:00108182 | Skin | AK | T cell chemotaxis | 9/1910 | 28/18723 | 1.34e-03 | 1.00e-02 | 9 |
| GO:00610973 | Skin | AK | regulation of protein tyrosine kinase activity | 19/1910 | 90/18723 | 1.61e-03 | 1.15e-02 | 19 |
| GO:004586019 | Skin | AK | positive regulation of protein kinase activity | 58/1910 | 386/18723 | 1.71e-03 | 1.20e-02 | 58 |
| GO:19000871 | Skin | AK | positive regulation of G1/S transition of mitotic cell cycle | 12/1910 | 46/18723 | 1.76e-03 | 1.23e-02 | 12 |
| GO:007048225 | Skin | AK | response to oxygen levels | 53/1910 | 347/18723 | 1.84e-03 | 1.27e-02 | 53 |
| GO:00105958 | Skin | AK | positive regulation of endothelial cell migration | 25/1910 | 133/18723 | 1.89e-03 | 1.29e-02 | 25 |
| GO:00716777 | Skin | AK | positive regulation of mononuclear cell migration | 15/1910 | 65/18723 | 1.92e-03 | 1.31e-02 | 15 |
| GO:003461225 | Skin | AK | response to tumor necrosis factor | 41/1910 | 253/18723 | 1.92e-03 | 1.31e-02 | 41 |
| GO:000941025 | Skin | AK | response to xenobiotic stimulus | 67/1910 | 462/18723 | 1.98e-03 | 1.34e-02 | 67 |
| GO:000181917 | Skin | AK | positive regulation of cytokine production | 67/1910 | 467/18723 | 2.59e-03 | 1.67e-02 | 67 |
| GO:00429824 | Skin | AK | amyloid precursor protein metabolic process | 19/1910 | 95/18723 | 3.08e-03 | 1.92e-02 | 19 |
| GO:00726762 | Skin | AK | lymphocyte migration | 22/1910 | 117/18723 | 3.41e-03 | 2.08e-02 | 22 |
| GO:19028082 | Skin | AK | positive regulation of cell cycle G1/S phase transition | 13/1910 | 58/18723 | 4.89e-03 | 2.77e-02 | 13 |
| GO:00170157 | Skin | AK | regulation of transforming growth factor beta receptor signaling pathway | 23/1910 | 128/18723 | 5.03e-03 | 2.83e-02 | 23 |
| GO:19011849 | Skin | AK | regulation of ERBB signaling pathway | 16/1910 | 79/18723 | 5.56e-03 | 3.05e-02 | 16 |
| GO:007190017 | Skin | AK | regulation of protein serine/threonine kinase activity | 52/1910 | 359/18723 | 6.06e-03 | 3.27e-02 | 52 |
| Page: 1 2 3 4 5 6 7 8 9 10 11 12 13 14 15 16 17 18 19 20 21 22 23 24 25 26 27 28 29 30 31 32 33 34 35 36 37 38 39 40 41 42 43 44 45 46 47 48 49 50 51 52 53 |
| Pathway ID | Tissue | Disease Stage | Description | Gene Ratio | Bg Ratio | pvalue | p.adjust | qvalue | Count |
| hsa0517120 | Cervix | CC | Coronavirus disease - COVID-19 | 111/1267 | 232/8465 | 1.82e-33 | 5.90e-31 | 3.49e-31 | 111 |
| hsa0501018 | Cervix | CC | Alzheimer disease | 113/1267 | 384/8465 | 9.67e-14 | 3.92e-12 | 2.32e-12 | 113 |
| hsa051207 | Cervix | CC | Epithelial cell signaling in Helicobacter pylori infection | 24/1267 | 70/8465 | 4.35e-05 | 3.09e-04 | 1.83e-04 | 24 |
| hsa04330 | Cervix | CC | Notch signaling pathway | 17/1267 | 62/8465 | 7.99e-03 | 2.56e-02 | 1.51e-02 | 17 |
| hsa05171110 | Cervix | CC | Coronavirus disease - COVID-19 | 111/1267 | 232/8465 | 1.82e-33 | 5.90e-31 | 3.49e-31 | 111 |
| hsa0501019 | Cervix | CC | Alzheimer disease | 113/1267 | 384/8465 | 9.67e-14 | 3.92e-12 | 2.32e-12 | 113 |
| hsa0512014 | Cervix | CC | Epithelial cell signaling in Helicobacter pylori infection | 24/1267 | 70/8465 | 4.35e-05 | 3.09e-04 | 1.83e-04 | 24 |
| hsa043301 | Cervix | CC | Notch signaling pathway | 17/1267 | 62/8465 | 7.99e-03 | 2.56e-02 | 1.51e-02 | 17 |
| hsa05010210 | Esophagus | ESCC | Alzheimer disease | 263/4205 | 384/8465 | 1.80e-14 | 5.47e-13 | 2.80e-13 | 263 |
| hsa05171211 | Esophagus | ESCC | Coronavirus disease - COVID-19 | 156/4205 | 232/8465 | 3.18e-08 | 2.68e-07 | 1.37e-07 | 156 |
| hsa0512018 | Esophagus | ESCC | Epithelial cell signaling in Helicobacter pylori infection | 52/4205 | 70/8465 | 2.17e-05 | 1.07e-04 | 5.47e-05 | 52 |
| hsa043306 | Esophagus | ESCC | Notch signaling pathway | 42/4205 | 62/8465 | 2.97e-03 | 7.97e-03 | 4.08e-03 | 42 |
| hsa0501038 | Esophagus | ESCC | Alzheimer disease | 263/4205 | 384/8465 | 1.80e-14 | 5.47e-13 | 2.80e-13 | 263 |
| hsa05171310 | Esophagus | ESCC | Coronavirus disease - COVID-19 | 156/4205 | 232/8465 | 3.18e-08 | 2.68e-07 | 1.37e-07 | 156 |
| hsa0512019 | Esophagus | ESCC | Epithelial cell signaling in Helicobacter pylori infection | 52/4205 | 70/8465 | 2.17e-05 | 1.07e-04 | 5.47e-05 | 52 |
| hsa0433013 | Esophagus | ESCC | Notch signaling pathway | 42/4205 | 62/8465 | 2.97e-03 | 7.97e-03 | 4.08e-03 | 42 |
| hsa0517142 | Liver | HCC | Coronavirus disease - COVID-19 | 167/4020 | 232/8465 | 1.50e-14 | 4.19e-13 | 2.33e-13 | 167 |
| hsa0501022 | Liver | HCC | Alzheimer disease | 254/4020 | 384/8465 | 3.75e-14 | 8.97e-13 | 4.99e-13 | 254 |
| hsa051202 | Liver | HCC | Epithelial cell signaling in Helicobacter pylori infection | 50/4020 | 70/8465 | 3.96e-05 | 2.16e-04 | 1.20e-04 | 50 |
| hsa0517152 | Liver | HCC | Coronavirus disease - COVID-19 | 167/4020 | 232/8465 | 1.50e-14 | 4.19e-13 | 2.33e-13 | 167 |
| Page: 1 2 |
Top |
Cell-cell communication analysis |
| Identification of potential cell-cell interactions between two cell types and their ligand-receptor pairs for different disease states |
| Ligand | Receptor | LRpair | Pathway | Tissue | Disease Stage |
| Page: 1 |
Top |
Single-cell gene regulatory network inference analysis |
| Find out the significant the regulons (TFs) and the target genes of each regulon across cell types for different disease states |
| TF | Cell Type | Tissue | Disease Stage | Target Gene | RSS | Regulon Activity |
| ∗The dot plots of a searched regulon are shown for all cell subpopulations in each disease state of each tissue based on the regulon specific score inferred using pySCENIC and by calculating the average expression. |
| Page: 1 |
Top |
Somatic mutation of malignant transformation related genes |
| Annotation of somatic variants for genes involved in malignant transformation |
| Hugo Symbol | Variant Class | Variant Classification | dbSNP RS | HGVSc | HGVSp | HGVSp Short | SWISSPROT | BIOTYPE | SIFT | PolyPhen | Tumor Sample Barcode | Tissue | Histology | Sex | Age | Stage | Therapy Types | Drugs | Outcome |
| ADAM17 | SNV | Missense_Mutation | novel | c.884N>G | p.Glu295Gly | p.E295G | P78536 | protein_coding | tolerated(0.13) | benign(0.003) | TCGA-AO-A03T-01 | Breast | breast invasive carcinoma | Female | <65 | I/II | Chemotherapy | cyclophosphamide | SD |
| ADAM17 | SNV | Missense_Mutation | rs764050476 | c.2437C>T | p.Arg813Cys | p.R813C | P78536 | protein_coding | deleterious_low_confidence(0) | probably_damaging(0.964) | TCGA-BH-A0BL-01 | Breast | breast invasive carcinoma | Female | <65 | I/II | Chemotherapy | adriamycin | CR |
| ADAM17 | SNV | Missense_Mutation | c.282N>G | p.Phe94Leu | p.F94L | P78536 | protein_coding | deleterious(0.05) | benign(0.074) | TCGA-EK-A2RJ-01 | Cervix | cervical & endocervical cancer | Female | <65 | I/II | Unknown | Unknown | SD | |
| ADAM17 | SNV | Missense_Mutation | novel | c.13N>T | p.Leu5Phe | p.L5F | P78536 | protein_coding | tolerated_low_confidence(0.22) | benign(0.02) | TCGA-EK-A2RJ-01 | Cervix | cervical & endocervical cancer | Female | <65 | I/II | Unknown | Unknown | SD |
| ADAM17 | SNV | Missense_Mutation | rs865879773 | c.787N>T | p.Arg263Trp | p.R263W | P78536 | protein_coding | deleterious(0) | probably_damaging(0.99) | TCGA-AA-3870-01 | Colorectum | colon adenocarcinoma | Female | >=65 | III/IV | Chemotherapy | folinic | CR |
| ADAM17 | SNV | Missense_Mutation | c.1891A>G | p.Thr631Ala | p.T631A | P78536 | protein_coding | deleterious(0.04) | benign(0.082) | TCGA-AA-3977-01 | Colorectum | colon adenocarcinoma | Male | >=65 | I/II | Unknown | Unknown | SD | |
| ADAM17 | SNV | Missense_Mutation | rs756129840 | c.1846G>A | p.Asp616Asn | p.D616N | P78536 | protein_coding | tolerated(0.17) | benign(0.001) | TCGA-AA-3984-01 | Colorectum | colon adenocarcinoma | Female | <65 | I/II | Unknown | Unknown | SD |
| ADAM17 | SNV | Missense_Mutation | c.701G>A | p.Arg234His | p.R234H | P78536 | protein_coding | deleterious(0) | possibly_damaging(0.841) | TCGA-AA-A00N-01 | Colorectum | colon adenocarcinoma | Male | >=65 | I/II | Unknown | Unknown | PD | |
| ADAM17 | SNV | Missense_Mutation | c.1615N>G | p.Asn539Asp | p.N539D | P78536 | protein_coding | tolerated(0.32) | benign(0.01) | TCGA-AA-A010-01 | Colorectum | colon adenocarcinoma | Female | <65 | I/II | Chemotherapy | folinic | CR | |
| ADAM17 | SNV | Missense_Mutation | novel | c.989C>G | p.Ser330Cys | p.S330C | P78536 | protein_coding | deleterious(0) | possibly_damaging(0.888) | TCGA-AY-4070-01 | Colorectum | colon adenocarcinoma | Female | <65 | III/IV | Chemotherapy | 5-fu | PD |
| Page: 1 2 3 4 5 6 7 |
Top |
Related drugs of malignant transformation related genes |
| Identification of chemicals and drugs interact with genes involved in malignant transfromation |
| (DGIdb 4.0) |
| Entrez ID | Symbol | Category | Interaction Types | Drug Claim Name | Drug Name | PMIDs |
| 6868 | ADAM17 | DRUGGABLE GENOME, PROTEASE, CELL SURFACE, NEUTRAL ZINC METALLOPEPTIDASE, TRANSPORTER, ENZYME | inhibitor | 178103981 | ILOMASTAT | |
| 6868 | ADAM17 | DRUGGABLE GENOME, PROTEASE, CELL SURFACE, NEUTRAL ZINC METALLOPEPTIDASE, TRANSPORTER, ENZYME | MARIMASTAT | MARIMASTAT | 26192023 | |
| 6868 | ADAM17 | DRUGGABLE GENOME, PROTEASE, CELL SURFACE, NEUTRAL ZINC METALLOPEPTIDASE, TRANSPORTER, ENZYME | Apratastat | APRATASTAT | ||
| 6868 | ADAM17 | DRUGGABLE GENOME, PROTEASE, CELL SURFACE, NEUTRAL ZINC METALLOPEPTIDASE, TRANSPORTER, ENZYME | GW-3333 | |||
| 6868 | ADAM17 | DRUGGABLE GENOME, PROTEASE, CELL SURFACE, NEUTRAL ZINC METALLOPEPTIDASE, TRANSPORTER, ENZYME | inhibitor | 252166880 | ||
| 6868 | ADAM17 | DRUGGABLE GENOME, PROTEASE, CELL SURFACE, NEUTRAL ZINC METALLOPEPTIDASE, TRANSPORTER, ENZYME | inhibitor | 178103123 | CHEMBL489100 | |
| 6868 | ADAM17 | DRUGGABLE GENOME, PROTEASE, CELL SURFACE, NEUTRAL ZINC METALLOPEPTIDASE, TRANSPORTER, ENZYME | INCB7839 | |||
| 6868 | ADAM17 | DRUGGABLE GENOME, PROTEASE, CELL SURFACE, NEUTRAL ZINC METALLOPEPTIDASE, TRANSPORTER, ENZYME | Aderbasib | ADERBASIB | ||
| 6868 | ADAM17 | DRUGGABLE GENOME, PROTEASE, CELL SURFACE, NEUTRAL ZINC METALLOPEPTIDASE, TRANSPORTER, ENZYME | inhibitor | 348353646 | ||
| 6868 | ADAM17 | DRUGGABLE GENOME, PROTEASE, CELL SURFACE, NEUTRAL ZINC METALLOPEPTIDASE, TRANSPORTER, ENZYME | CB7969312 | CHEMBL599255 |
| Page: 1 2 |

Copyright 2023-Present -The University of Texas Health Science Center at Houston |