
|
|||||
|
 | |
| |
| |
| |
| |
| |
|
Gene: ZFPM1 |
Gene summary for ZFPM1 |
| Gene information | Species | Human | Gene symbol | ZFPM1 | Gene ID | 161882 |
| Gene name | zinc finger protein, FOG family member 1 | |
| Gene Alias | FOG | |
| Cytomap | 16q24.2 | |
| Gene Type | protein-coding | GO ID | GO:0000122 | UniProtAcc | Q8IX07 |
Top |
Malignant transformation analysis |
| Identification of the aberrant gene expression in precancerous and cancerous lesions by comparing the gene expression of stem-like cells in diseased tissues with normal stem cells |
| Entrez ID | Symbol | Replicates | Species | Organ | Tissue | Adj P-value | Log2FC | Malignancy |
| 161882 | ZFPM1 | C21 | Human | Oral cavity | OSCC | 3.47e-02 | 8.57e-02 | 0.2678 |
| 161882 | ZFPM1 | SYSMH1 | Human | Oral cavity | OSCC | 1.67e-15 | 4.61e-01 | 0.1127 |
| 161882 | ZFPM1 | SYSMH2 | Human | Oral cavity | OSCC | 8.25e-24 | 8.66e-01 | 0.2326 |
| 161882 | ZFPM1 | SYSMH3 | Human | Oral cavity | OSCC | 1.23e-27 | 9.00e-01 | 0.2442 |
| 161882 | ZFPM1 | SYSMH5 | Human | Oral cavity | OSCC | 2.06e-05 | 2.29e-01 | 0.0647 |
| 161882 | ZFPM1 | SYSMH6 | Human | Oral cavity | OSCC | 5.94e-08 | 3.35e-01 | 0.1275 |
| 161882 | ZFPM1 | PTC03 | Human | Thyroid | PTC | 6.94e-04 | 2.06e-01 | 0.1784 |
| 161882 | ZFPM1 | PTC04 | Human | Thyroid | PTC | 4.69e-05 | 1.71e-01 | 0.1927 |
| 161882 | ZFPM1 | PTC05 | Human | Thyroid | PTC | 4.29e-20 | 5.21e-01 | 0.2065 |
| 161882 | ZFPM1 | PTC06 | Human | Thyroid | PTC | 9.59e-27 | 5.51e-01 | 0.2057 |
| 161882 | ZFPM1 | PTC07 | Human | Thyroid | PTC | 2.00e-32 | 5.25e-01 | 0.2044 |
| 161882 | ZFPM1 | ATC12 | Human | Thyroid | ATC | 9.37e-08 | 1.89e-01 | 0.34 |
| 161882 | ZFPM1 | ATC13 | Human | Thyroid | ATC | 1.74e-29 | 6.86e-01 | 0.34 |
| 161882 | ZFPM1 | ATC2 | Human | Thyroid | ATC | 8.57e-18 | 7.65e-01 | 0.34 |
| 161882 | ZFPM1 | ATC4 | Human | Thyroid | ATC | 4.82e-12 | 2.40e-01 | 0.34 |
| 161882 | ZFPM1 | ATC5 | Human | Thyroid | ATC | 4.52e-38 | 7.32e-01 | 0.34 |
| Page: 1 |
| Tissue | Expression Dynamics | Abbreviation |
| Oral Cavity |  | EOLP: Erosive Oral lichen planus |
| LP: leukoplakia | ||
| NEOLP: Non-erosive oral lichen planus | ||
| OSCC: Oral squamous cell carcinoma | ||
| Thyroid | 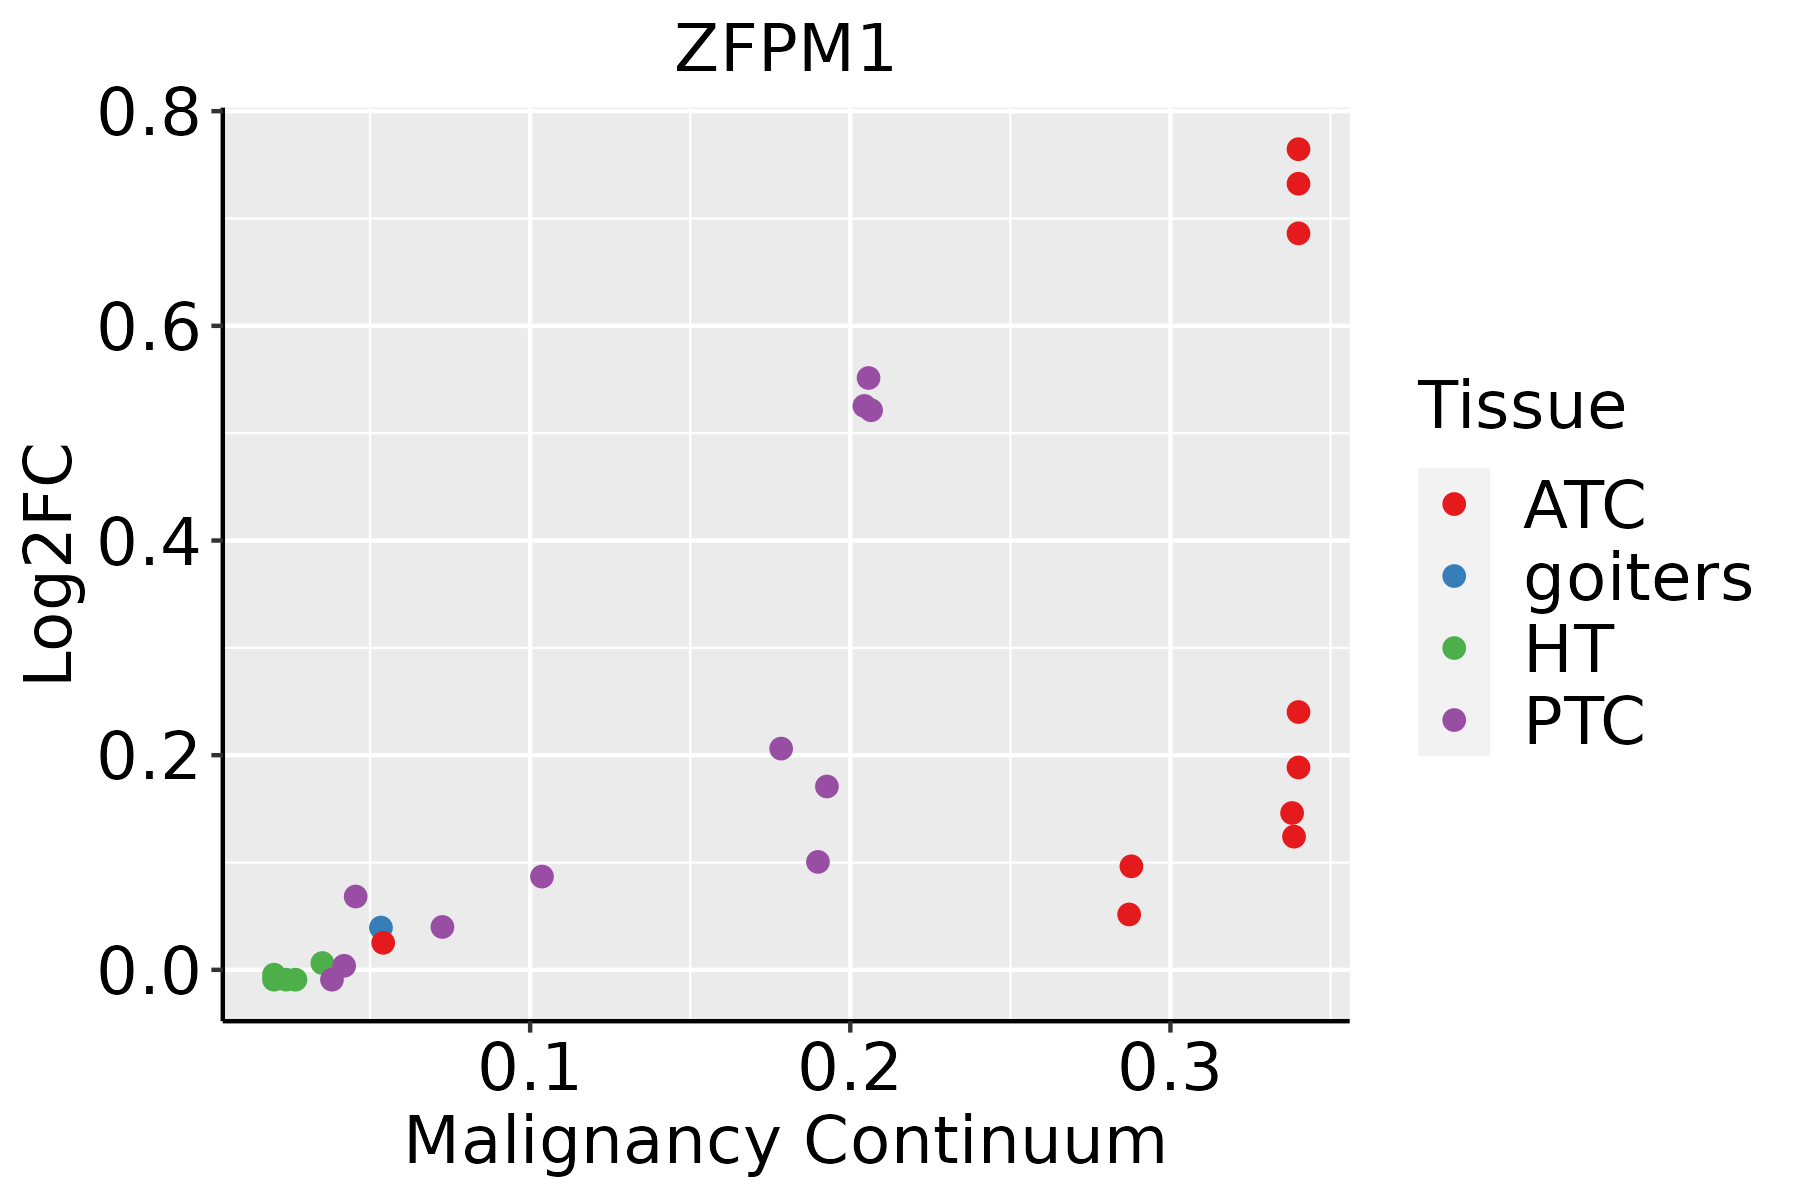 | ATC: Anaplastic thyroid cancer |
| HT: Hashimoto's thyroiditis | ||
| PTC: Papillary thyroid cancer |
| ∗log2FC in expression of this searched gene in stem-like cells from each diseased tissue sample relative to stem-like cells in normal samples in each tissue plotted against the malignancy continuum. Samples are colored based on if they are from different disease stage. |
Top |
Malignant transformation related pathway analysis |
| Find out the enriched GO biological processes and KEGG pathways involved in transition from healthy to precancer to cancer |
| Tissue | Disease Stage | Enriched GO biological Processes |
| Colorectum | AD |  |
| Colorectum | SER |  |
| Colorectum | MSS |  |
| Colorectum | MSI-H |  |
| Colorectum | FAP |  |
| ∗Top 15 enriched GO BP terms are showed in the bar plot of each disease state in each tissue. Each row represents a significant GO biological process which is colored according to the -log10(p.adjust). |
| Page: 1 2 3 4 5 6 7 8 9 |
| GO ID | Tissue | Disease Stage | Description | Gene Ratio | Bg Ratio | pvalue | p.adjust | Count |
| GO:005110027 | Thyroid | ATC | negative regulation of binding | 86/6293 | 162/18723 | 2.41e-07 | 3.73e-06 | 86 |
| GO:003410134 | Thyroid | ATC | erythrocyte homeostasis | 71/6293 | 129/18723 | 4.36e-07 | 6.34e-06 | 71 |
| GO:006034813 | Thyroid | ATC | bone development | 102/6293 | 205/18723 | 1.18e-06 | 1.52e-05 | 102 |
| GO:006053724 | Thyroid | ATC | muscle tissue development | 181/6293 | 403/18723 | 1.27e-06 | 1.62e-05 | 181 |
| GO:003009933 | Thyroid | ATC | myeloid cell differentiation | 170/6293 | 381/18723 | 4.26e-06 | 4.68e-05 | 170 |
| GO:0030218210 | Thyroid | ATC | erythrocyte differentiation | 64/6293 | 120/18723 | 6.52e-06 | 6.76e-05 | 64 |
| GO:000327912 | Thyroid | ATC | cardiac septum development | 56/6293 | 103/18723 | 1.14e-05 | 1.11e-04 | 56 |
| GO:001470622 | Thyroid | ATC | striated muscle tissue development | 168/6293 | 384/18723 | 1.91e-05 | 1.73e-04 | 168 |
| GO:003209119 | Thyroid | ATC | negative regulation of protein binding | 51/6293 | 94/18723 | 2.97e-05 | 2.48e-04 | 51 |
| GO:000320512 | Thyroid | ATC | cardiac chamber development | 79/6293 | 161/18723 | 3.39e-05 | 2.80e-04 | 79 |
| GO:004544423 | Thyroid | ATC | fat cell differentiation | 105/6293 | 229/18723 | 7.42e-05 | 5.62e-04 | 105 |
| GO:000317012 | Thyroid | ATC | heart valve development | 37/6293 | 65/18723 | 9.43e-05 | 6.91e-04 | 37 |
| GO:00030075 | Thyroid | ATC | heart morphogenesis | 110/6293 | 246/18723 | 1.76e-04 | 1.20e-03 | 110 |
| GO:000317912 | Thyroid | ATC | heart valve morphogenesis | 31/6293 | 55/18723 | 4.33e-04 | 2.59e-03 | 31 |
| GO:000751716 | Thyroid | ATC | muscle organ development | 139/6293 | 327/18723 | 4.45e-04 | 2.64e-03 | 139 |
| GO:004564625 | Thyroid | ATC | regulation of erythrocyte differentiation | 27/6293 | 47/18723 | 6.69e-04 | 3.77e-03 | 27 |
| GO:004873811 | Thyroid | ATC | cardiac muscle tissue development | 103/6293 | 236/18723 | 7.93e-04 | 4.37e-03 | 103 |
| GO:000318111 | Thyroid | ATC | atrioventricular valve morphogenesis | 16/6293 | 24/18723 | 9.46e-04 | 5.07e-03 | 16 |
| GO:000328121 | Thyroid | ATC | ventricular septum development | 37/6293 | 71/18723 | 9.80e-04 | 5.21e-03 | 37 |
| GO:000181924 | Thyroid | ATC | positive regulation of cytokine production | 189/6293 | 467/18723 | 1.00e-03 | 5.31e-03 | 189 |
| Page: 1 2 3 4 5 |
| Pathway ID | Tissue | Disease Stage | Description | Gene Ratio | Bg Ratio | pvalue | p.adjust | qvalue | Count |
| Page: 1 |
Top |
Cell-cell communication analysis |
| Identification of potential cell-cell interactions between two cell types and their ligand-receptor pairs for different disease states |
| Ligand | Receptor | LRpair | Pathway | Tissue | Disease Stage |
| Page: 1 |
Top |
Single-cell gene regulatory network inference analysis |
| Find out the significant the regulons (TFs) and the target genes of each regulon across cell types for different disease states |
| TF | Cell Type | Tissue | Disease Stage | Target Gene | RSS | Regulon Activity |
| ZFPM1 | LYMEND | Colorectum | AD | MUC13,CDX2,TSC22D1, etc. | 1.11e-16 |  |
| ZFPM1 | ICAF | Colorectum | CRC | MUC13,CDX2,TSC22D1, etc. | 2.73e-02 |  |
| ZFPM1 | PCV | Colorectum | CRC | MUC13,CDX2,TSC22D1, etc. | 0.00e+00 | |
| ZFPM1 | ICAF | Colorectum | FAP | MUC13,CDX2,TSC22D1, etc. | 2.49e-02 |  |
| ZFPM1 | LYMEND | Colorectum | MSS | MUC13,CDX2,TSC22D1, etc. | 0.00e+00 |  |
| ZFPM1 | VFIB | Colorectum | MSS | MUC13,CDX2,TSC22D1, etc. | 0.00e+00 | |
| ∗The dot plots of a searched regulon are shown for all cell subpopulations in each disease state of each tissue based on the regulon specific score inferred using pySCENIC and by calculating the average expression. |
| Page: 1 |
Top |
Somatic mutation of malignant transformation related genes |
| Annotation of somatic variants for genes involved in malignant transformation |
| Hugo Symbol | Variant Class | Variant Classification | dbSNP RS | HGVSc | HGVSp | HGVSp Short | SWISSPROT | BIOTYPE | SIFT | PolyPhen | Tumor Sample Barcode | Tissue | Histology | Sex | Age | Stage | Therapy Types | Drugs | Outcome |
| ZFPM1 | SNV | Missense_Mutation | rs758092528 | c.172N>T | p.Pro58Ser | p.P58S | Q8IX07 | protein_coding | tolerated(0.16) | benign(0.015) | TCGA-AR-A5QQ-01 | Breast | breast invasive carcinoma | Female | >=65 | III/IV | Chemotherapy | carboplatin | PD |
| ZFPM1 | SNV | Missense_Mutation | novel | c.2929C>A | p.Arg977Ser | p.R977S | Q8IX07 | protein_coding | deleterious(0) | probably_damaging(0.996) | TCGA-OL-A5D7-01 | Breast | breast invasive carcinoma | Female | >=65 | I/II | Chemotherapy | cytoxan | CR |
| ZFPM1 | insertion | Frame_Shift_Ins | novel | c.456_457insC | p.Gln154ProfsTer5 | p.Q154Pfs*5 | Q8IX07 | protein_coding | TCGA-E2-A15L-01 | Breast | breast invasive carcinoma | Female | >=65 | I/II | Hormone Therapy | arimidex | SD | ||
| ZFPM1 | deletion | Frame_Shift_Del | novel | c.546delN | p.Gly184AspfsTer3 | p.G184Dfs*3 | Q8IX07 | protein_coding | TCGA-LL-A50Y-01 | Breast | breast invasive carcinoma | Female | >=65 | I/II | Hormone Therapy | arimidex | CR | ||
| ZFPM1 | SNV | Missense_Mutation | novel | c.934C>T | p.Arg312Cys | p.R312C | Q8IX07 | protein_coding | deleterious(0) | probably_damaging(0.989) | TCGA-2W-A8YY-01 | Cervix | cervical & endocervical cancer | Female | <65 | I/II | Chemotherapy | cisplatin | CR |
| ZFPM1 | SNV | Missense_Mutation | c.961G>A | p.Val321Met | p.V321M | Q8IX07 | protein_coding | deleterious(0) | probably_damaging(0.993) | TCGA-C5-A1BQ-01 | Cervix | cervical & endocervical cancer | Female | >=65 | III/IV | Chemotherapy | cisplatin | CR | |
| ZFPM1 | SNV | Missense_Mutation | novel | c.996G>C | p.Lys332Asn | p.K332N | Q8IX07 | protein_coding | deleterious(0) | probably_damaging(0.982) | TCGA-C5-A8XH-01 | Cervix | cervical & endocervical cancer | Female | <65 | I/II | Unknown | Unknown | SD |
| ZFPM1 | SNV | Missense_Mutation | c.620C>T | p.Ala207Val | p.A207V | Q8IX07 | protein_coding | tolerated(0.5) | benign(0.003) | TCGA-VS-A9UJ-01 | Cervix | cervical & endocervical cancer | Female | <65 | I/II | Unknown | Unknown | PD | |
| ZFPM1 | SNV | Missense_Mutation | novel | c.1445G>T | p.Gly482Val | p.G482V | Q8IX07 | protein_coding | tolerated(0.13) | possibly_damaging(0.725) | TCGA-5M-AAT6-01 | Colorectum | colon adenocarcinoma | Female | <65 | III/IV | Unknown | Unknown | PD |
| ZFPM1 | SNV | Missense_Mutation | rs112394415 | c.649N>A | p.Asp217Asn | p.D217N | Q8IX07 | protein_coding | deleterious(0) | possibly_damaging(0.761) | TCGA-5M-AATE-01 | Colorectum | colon adenocarcinoma | Male | >=65 | I/II | Unknown | Unknown | PD |
| Page: 1 2 3 4 |
Top |
Related drugs of malignant transformation related genes |
| Identification of chemicals and drugs interact with genes involved in malignant transfromation |
| (DGIdb 4.0) |
| Entrez ID | Symbol | Category | Interaction Types | Drug Claim Name | Drug Name | PMIDs |
| Page: 1 |

Copyright 2023-Present -The University of Texas Health Science Center at Houston |