
|
|||||
|
 | |
| |
| |
| |
| |
| |
|
Gene: XAB2 |
Gene summary for XAB2 |
| Gene information | Species | Human | Gene symbol | XAB2 | Gene ID | 56949 |
| Gene name | XPA binding protein 2 | |
| Gene Alias | HCNP | |
| Cytomap | 19p13.2 | |
| Gene Type | protein-coding | GO ID | GO:0000349 | UniProtAcc | Q9HCS7 |
Top |
Malignant transformation analysis |
| Identification of the aberrant gene expression in precancerous and cancerous lesions by comparing the gene expression of stem-like cells in diseased tissues with normal stem cells |
| Entrez ID | Symbol | Replicates | Species | Organ | Tissue | Adj P-value | Log2FC | Malignancy |
| 56949 | XAB2 | LZE2T | Human | Esophagus | ESCC | 2.55e-04 | 4.71e-01 | 0.082 |
| 56949 | XAB2 | LZE4T | Human | Esophagus | ESCC | 1.63e-04 | 1.44e-01 | 0.0811 |
| 56949 | XAB2 | LZE5T | Human | Esophagus | ESCC | 1.28e-02 | 2.26e-01 | 0.0514 |
| 56949 | XAB2 | LZE7T | Human | Esophagus | ESCC | 3.41e-10 | 3.84e-01 | 0.0667 |
| 56949 | XAB2 | LZE8T | Human | Esophagus | ESCC | 4.57e-04 | 1.08e-01 | 0.067 |
| 56949 | XAB2 | LZE20T | Human | Esophagus | ESCC | 3.94e-04 | 1.25e-01 | 0.0662 |
| 56949 | XAB2 | LZE24T | Human | Esophagus | ESCC | 1.08e-15 | 2.79e-01 | 0.0596 |
| 56949 | XAB2 | LZE21T | Human | Esophagus | ESCC | 2.74e-06 | 2.29e-01 | 0.0655 |
| 56949 | XAB2 | P1T-E | Human | Esophagus | ESCC | 2.38e-10 | 6.52e-01 | 0.0875 |
| 56949 | XAB2 | P2T-E | Human | Esophagus | ESCC | 1.18e-27 | 2.54e-01 | 0.1177 |
| 56949 | XAB2 | P4T-E | Human | Esophagus | ESCC | 3.78e-15 | 2.39e-01 | 0.1323 |
| 56949 | XAB2 | P5T-E | Human | Esophagus | ESCC | 6.36e-19 | 3.12e-01 | 0.1327 |
| 56949 | XAB2 | P8T-E | Human | Esophagus | ESCC | 6.72e-32 | 4.87e-01 | 0.0889 |
| 56949 | XAB2 | P9T-E | Human | Esophagus | ESCC | 5.20e-13 | 3.05e-01 | 0.1131 |
| 56949 | XAB2 | P10T-E | Human | Esophagus | ESCC | 1.59e-24 | 4.18e-01 | 0.116 |
| 56949 | XAB2 | P11T-E | Human | Esophagus | ESCC | 1.85e-11 | 4.71e-01 | 0.1426 |
| 56949 | XAB2 | P12T-E | Human | Esophagus | ESCC | 1.14e-29 | 5.40e-01 | 0.1122 |
| 56949 | XAB2 | P15T-E | Human | Esophagus | ESCC | 1.81e-23 | 4.84e-01 | 0.1149 |
| 56949 | XAB2 | P16T-E | Human | Esophagus | ESCC | 2.19e-21 | 3.15e-01 | 0.1153 |
| 56949 | XAB2 | P17T-E | Human | Esophagus | ESCC | 2.37e-21 | 7.28e-01 | 0.1278 |
| Page: 1 2 3 4 5 6 |
| Tissue | Expression Dynamics | Abbreviation |
| Esophagus | 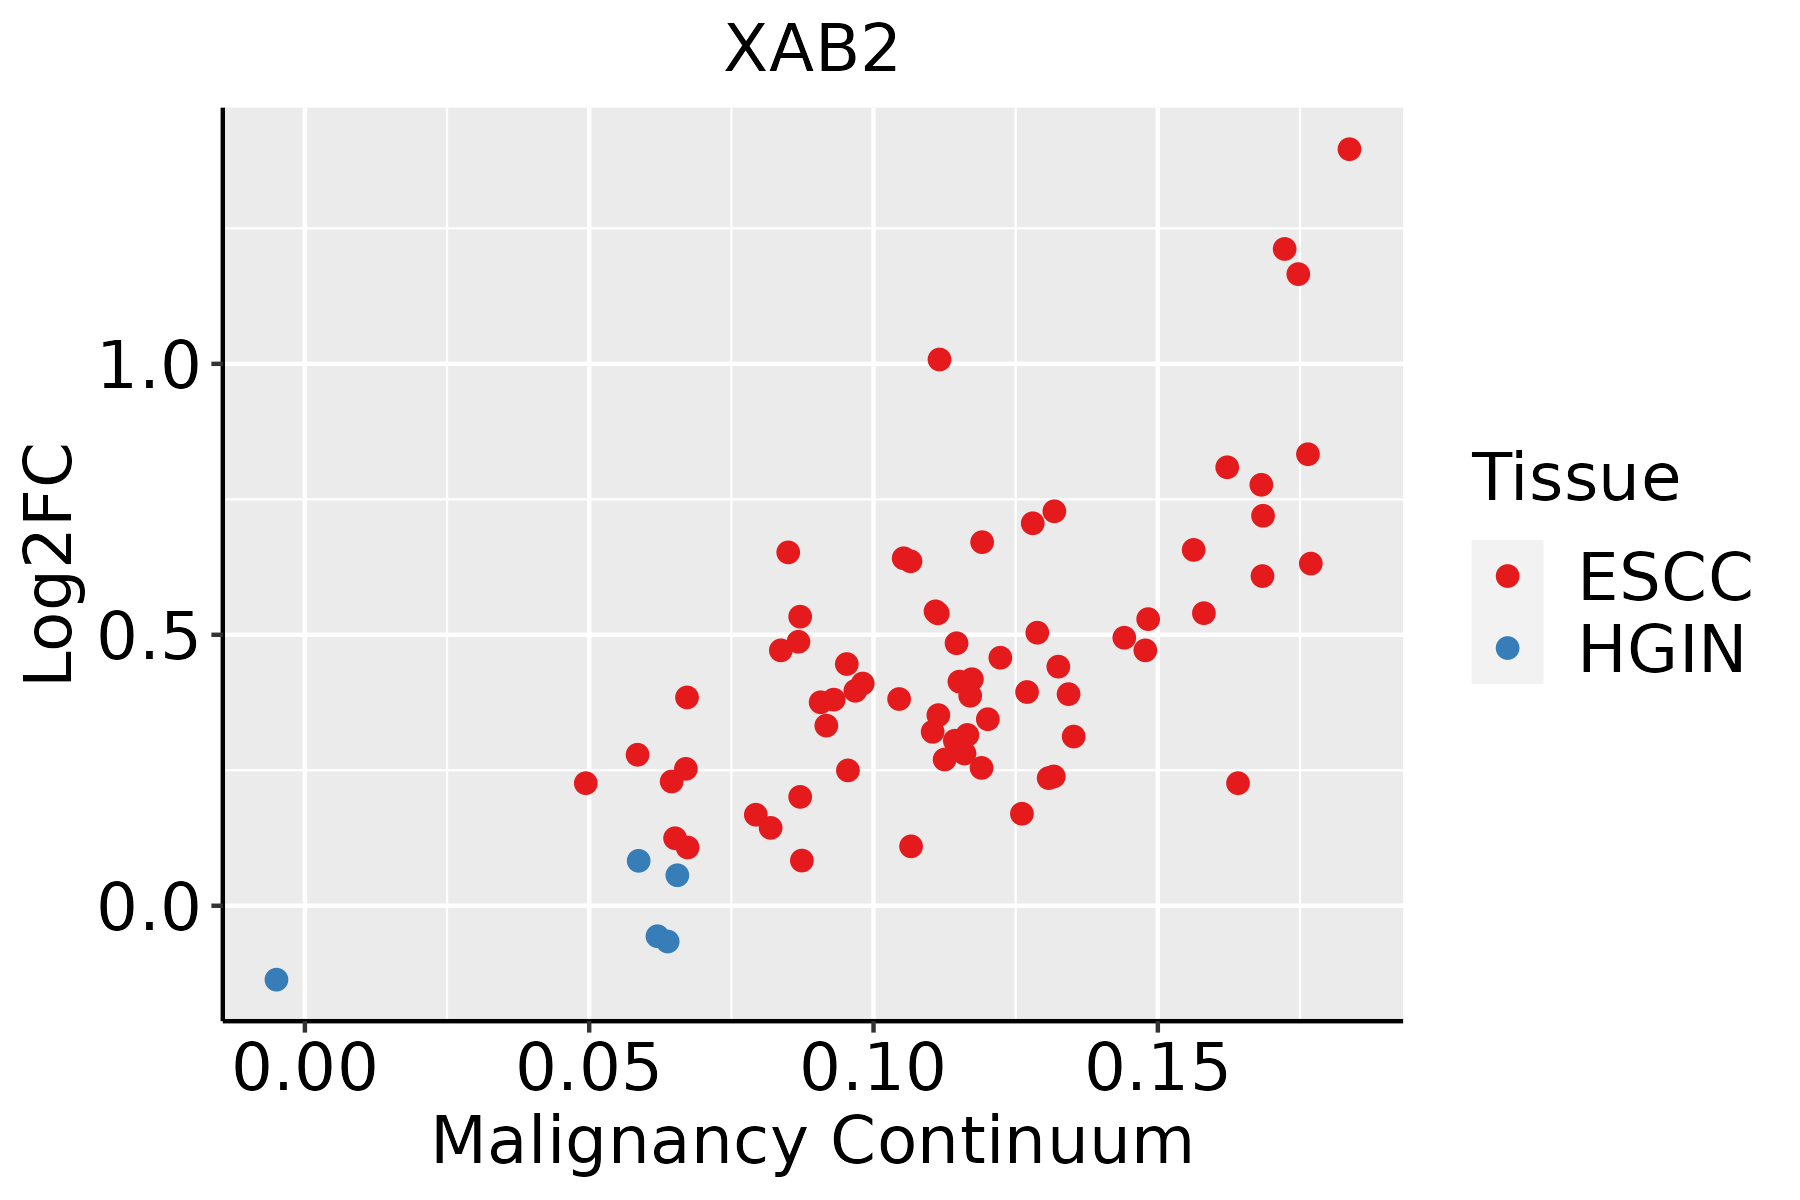 | ESCC: Esophageal squamous cell carcinoma |
| HGIN: High-grade intraepithelial neoplasias | ||
| LGIN: Low-grade intraepithelial neoplasias | ||
| Oral Cavity | 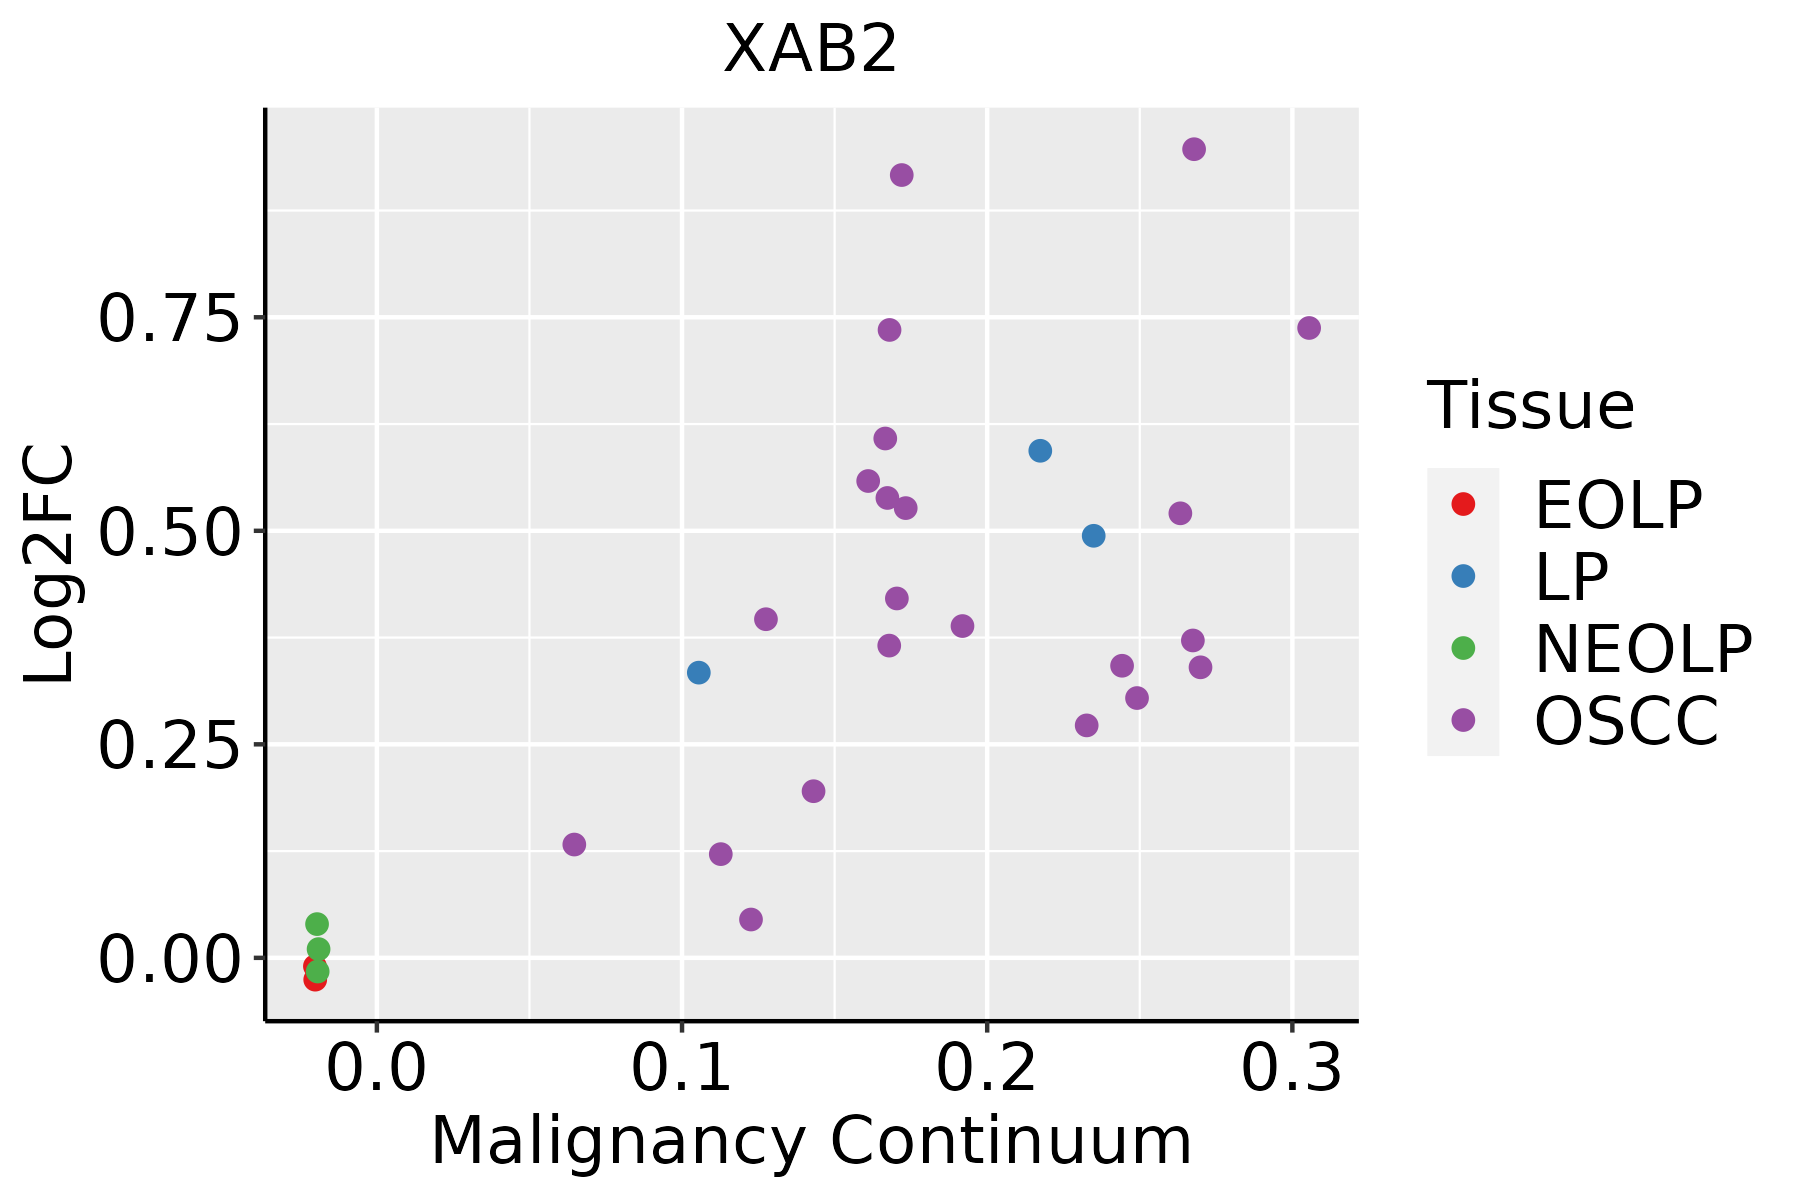 | EOLP: Erosive Oral lichen planus |
| LP: leukoplakia | ||
| NEOLP: Non-erosive oral lichen planus | ||
| OSCC: Oral squamous cell carcinoma | ||
| Prostate | 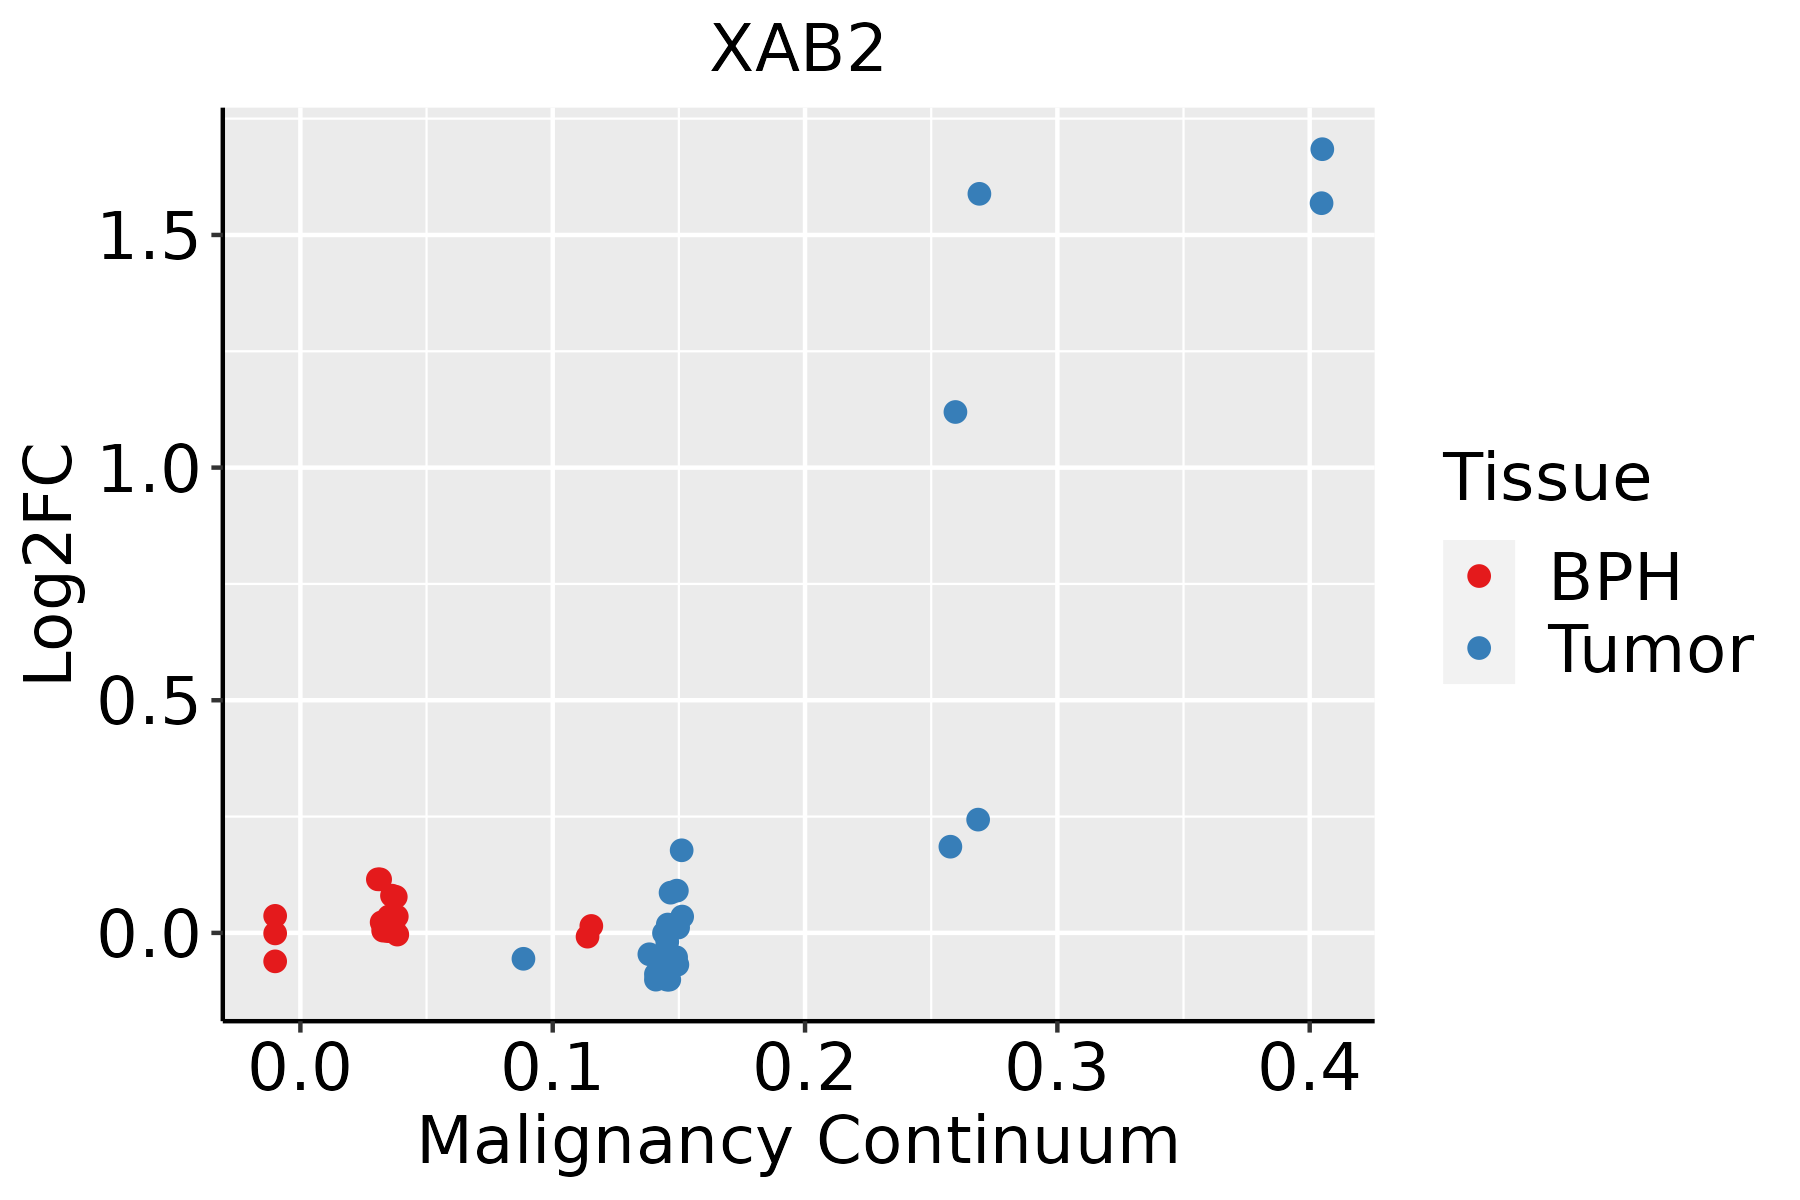 | BPH: Benign Prostatic Hyperplasia |
| Skin | 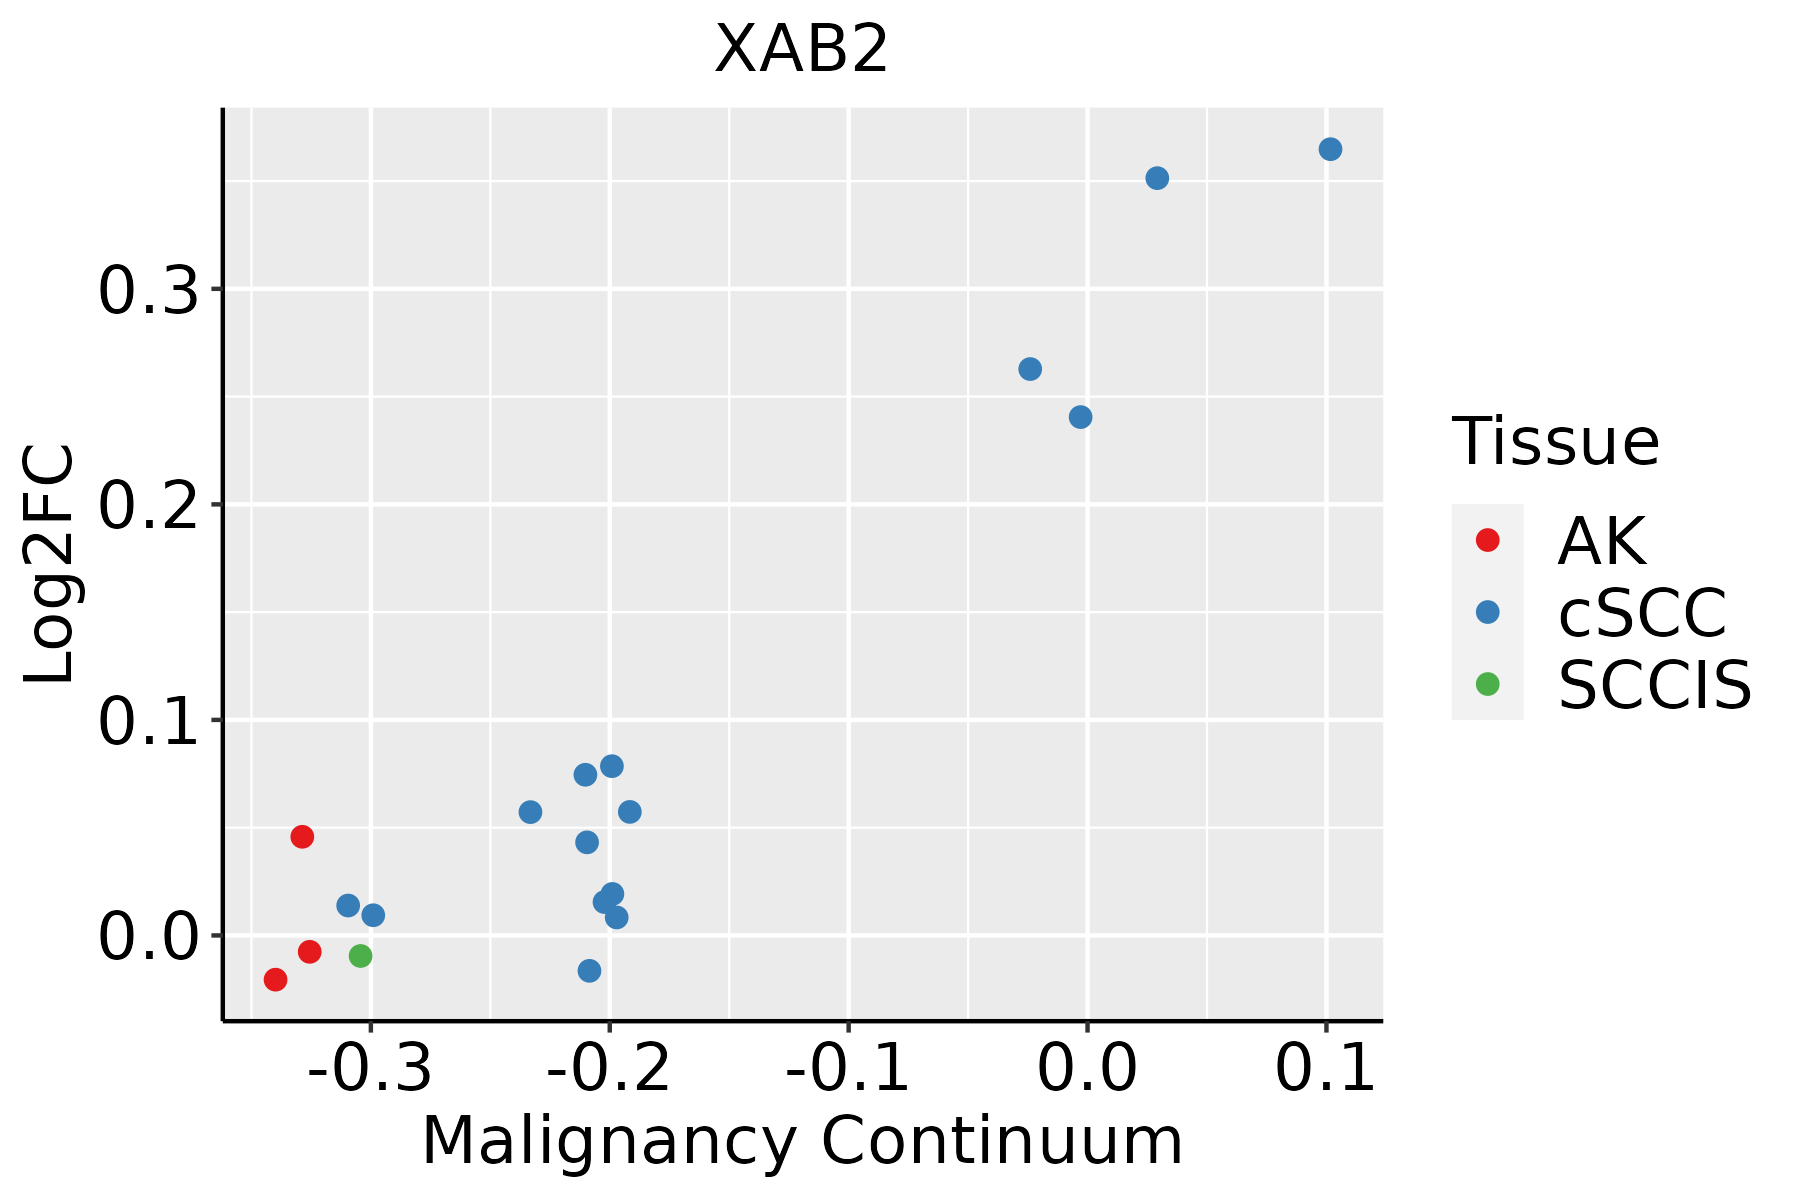 | AK: Actinic keratosis |
| cSCC: Cutaneous squamous cell carcinoma | ||
| SCCIS:squamous cell carcinoma in situ | ||
| Thyroid |  | ATC: Anaplastic thyroid cancer |
| HT: Hashimoto's thyroiditis | ||
| PTC: Papillary thyroid cancer |
| ∗log2FC in expression of this searched gene in stem-like cells from each diseased tissue sample relative to stem-like cells in normal samples in each tissue plotted against the malignancy continuum. Samples are colored based on if they are from different disease stage. |
Top |
Malignant transformation related pathway analysis |
| Find out the enriched GO biological processes and KEGG pathways involved in transition from healthy to precancer to cancer |
| Tissue | Disease Stage | Enriched GO biological Processes |
| Colorectum | AD |  |
| Colorectum | SER |  |
| Colorectum | MSS |  |
| Colorectum | MSI-H |  |
| Colorectum | FAP |  |
| ∗Top 15 enriched GO BP terms are showed in the bar plot of each disease state in each tissue. Each row represents a significant GO biological process which is colored according to the -log10(p.adjust). |
| Page: 1 2 3 4 5 6 7 8 9 |
| GO ID | Tissue | Disease Stage | Description | Gene Ratio | Bg Ratio | pvalue | p.adjust | Count |
| GO:0000398113 | Thyroid | PTC | mRNA splicing, via spliceosome | 199/5968 | 320/18723 | 2.96e-29 | 1.44e-26 | 199 |
| GO:0071826113 | Thyroid | PTC | ribonucleoprotein complex subunit organization | 134/5968 | 227/18723 | 2.34e-17 | 2.24e-15 | 134 |
| GO:0022618113 | Thyroid | PTC | ribonucleoprotein complex assembly | 130/5968 | 220/18723 | 6.25e-17 | 5.47e-15 | 130 |
| GO:0001701111 | Thyroid | PTC | in utero embryonic development | 175/5968 | 367/18723 | 1.40e-10 | 4.73e-09 | 175 |
| GO:00018246 | Thyroid | PTC | blastocyst development | 49/5968 | 106/18723 | 1.37e-03 | 7.72e-03 | 49 |
| GO:00215438 | Thyroid | PTC | pallium development | 72/5968 | 169/18723 | 2.09e-03 | 1.11e-02 | 72 |
| GO:00215373 | Thyroid | PTC | telencephalon development | 100/5968 | 248/18723 | 2.90e-03 | 1.44e-02 | 100 |
| GO:002198713 | Thyroid | PTC | cerebral cortex development | 50/5968 | 114/18723 | 4.71e-03 | 2.21e-02 | 50 |
| GO:00309007 | Thyroid | PTC | forebrain development | 143/5968 | 379/18723 | 8.47e-03 | 3.56e-02 | 143 |
| GO:002261334 | Thyroid | ATC | ribonucleoprotein complex biogenesis | 292/6293 | 463/18723 | 3.05e-39 | 9.63e-36 | 292 |
| GO:000838034 | Thyroid | ATC | RNA splicing | 270/6293 | 434/18723 | 7.50e-35 | 1.19e-31 | 270 |
| GO:000037534 | Thyroid | ATC | RNA splicing, via transesterification reactions | 200/6293 | 324/18723 | 1.75e-25 | 7.39e-23 | 200 |
| GO:000037734 | Thyroid | ATC | RNA splicing, via transesterification reactions with bulged adenosine as nucleophile | 197/6293 | 320/18723 | 6.54e-25 | 2.18e-22 | 197 |
| GO:000039834 | Thyroid | ATC | mRNA splicing, via spliceosome | 197/6293 | 320/18723 | 6.54e-25 | 2.18e-22 | 197 |
| GO:007182635 | Thyroid | ATC | ribonucleoprotein complex subunit organization | 133/6293 | 227/18723 | 8.32e-15 | 5.01e-13 | 133 |
| GO:002261835 | Thyroid | ATC | ribonucleoprotein complex assembly | 129/6293 | 220/18723 | 1.93e-14 | 1.10e-12 | 129 |
| GO:000170126 | Thyroid | ATC | in utero embryonic development | 183/6293 | 367/18723 | 6.62e-11 | 2.11e-09 | 183 |
| GO:003090015 | Thyroid | ATC | forebrain development | 164/6293 | 379/18723 | 4.85e-05 | 3.87e-04 | 164 |
| GO:002153712 | Thyroid | ATC | telencephalon development | 113/6293 | 248/18723 | 5.61e-05 | 4.32e-04 | 113 |
| GO:002154312 | Thyroid | ATC | pallium development | 81/6293 | 169/18723 | 7.67e-05 | 5.80e-04 | 81 |
| Page: 1 2 3 4 5 |
| Pathway ID | Tissue | Disease Stage | Description | Gene Ratio | Bg Ratio | pvalue | p.adjust | qvalue | Count |
| hsa0304027 | Esophagus | ESCC | Spliceosome | 128/4205 | 217/8465 | 3.31e-03 | 8.79e-03 | 4.50e-03 | 128 |
| hsa0304037 | Esophagus | ESCC | Spliceosome | 128/4205 | 217/8465 | 3.31e-03 | 8.79e-03 | 4.50e-03 | 128 |
| hsa0304016 | Oral cavity | OSCC | Spliceosome | 123/3704 | 217/8465 | 7.21e-05 | 2.74e-04 | 1.40e-04 | 123 |
| hsa0304017 | Oral cavity | OSCC | Spliceosome | 123/3704 | 217/8465 | 7.21e-05 | 2.74e-04 | 1.40e-04 | 123 |
| hsa0304026 | Oral cavity | LP | Spliceosome | 106/2418 | 217/8465 | 1.30e-10 | 2.40e-09 | 1.55e-09 | 106 |
| hsa0304036 | Oral cavity | LP | Spliceosome | 106/2418 | 217/8465 | 1.30e-10 | 2.40e-09 | 1.55e-09 | 106 |
| hsa0304025 | Prostate | Tumor | Spliceosome | 66/1791 | 217/8465 | 7.53e-04 | 3.59e-03 | 2.23e-03 | 66 |
| hsa0304035 | Prostate | Tumor | Spliceosome | 66/1791 | 217/8465 | 7.53e-04 | 3.59e-03 | 2.23e-03 | 66 |
| Page: 1 |
Top |
Cell-cell communication analysis |
| Identification of potential cell-cell interactions between two cell types and their ligand-receptor pairs for different disease states |
| Ligand | Receptor | LRpair | Pathway | Tissue | Disease Stage |
| Page: 1 |
Top |
Single-cell gene regulatory network inference analysis |
| Find out the significant the regulons (TFs) and the target genes of each regulon across cell types for different disease states |
| TF | Cell Type | Tissue | Disease Stage | Target Gene | RSS | Regulon Activity |
| ∗The dot plots of a searched regulon are shown for all cell subpopulations in each disease state of each tissue based on the regulon specific score inferred using pySCENIC and by calculating the average expression. |
| Page: 1 |
Top |
Somatic mutation of malignant transformation related genes |
| Annotation of somatic variants for genes involved in malignant transformation |
| Hugo Symbol | Variant Class | Variant Classification | dbSNP RS | HGVSc | HGVSp | HGVSp Short | SWISSPROT | BIOTYPE | SIFT | PolyPhen | Tumor Sample Barcode | Tissue | Histology | Sex | Age | Stage | Therapy Types | Drugs | Outcome |
| XAB2 | SNV | Missense_Mutation | rs763601327 | c.385N>C | p.Thr129Pro | p.T129P | Q9HCS7 | protein_coding | deleterious(0) | possibly_damaging(0.757) | TCGA-A7-A26E-01 | Breast | breast invasive carcinoma | Female | >=65 | III/IV | Chemotherapy | cytoxan | SD |
| XAB2 | SNV | Missense_Mutation | rs763601327 | c.385A>C | p.Thr129Pro | p.T129P | Q9HCS7 | protein_coding | deleterious(0) | possibly_damaging(0.757) | TCGA-AR-A1AY-01 | Breast | breast invasive carcinoma | Female | >=65 | I/II | Unspecific | Doxorubicin | SD |
| XAB2 | SNV | Missense_Mutation | c.1550N>G | p.Thr517Arg | p.T517R | Q9HCS7 | protein_coding | deleterious(0) | probably_damaging(0.984) | TCGA-BH-A0DZ-01 | Breast | breast invasive carcinoma | Female | <65 | I/II | Chemotherapy | docetaxel | SD | |
| XAB2 | SNV | Missense_Mutation | rs745761079 | c.412N>T | p.Arg138Trp | p.R138W | Q9HCS7 | protein_coding | deleterious(0) | probably_damaging(0.932) | TCGA-D8-A1JA-01 | Breast | breast invasive carcinoma | Female | <65 | III/IV | Chemotherapy | adriamycin | PD |
| XAB2 | SNV | Missense_Mutation | c.2222T>C | p.Met741Thr | p.M741T | Q9HCS7 | protein_coding | tolerated(0.2) | benign(0.015) | TCGA-E2-A1IH-01 | Breast | breast invasive carcinoma | Female | >=65 | I/II | Hormone Therapy | aromasin | SD | |
| XAB2 | SNV | Missense_Mutation | rs191550276 | c.623N>A | p.Arg208His | p.R208H | Q9HCS7 | protein_coding | tolerated(0.2) | benign(0.001) | TCGA-E2-A1L9-01 | Breast | breast invasive carcinoma | Female | <65 | I/II | Chemotherapy | cytoxan | SD |
| XAB2 | SNV | Missense_Mutation | rs763601327 | c.385N>C | p.Thr129Pro | p.T129P | Q9HCS7 | protein_coding | deleterious(0) | possibly_damaging(0.757) | TCGA-EW-A1OY-01 | Breast | breast invasive carcinoma | Female | <65 | I/II | Chemotherapy | doxorubicin | SD |
| XAB2 | SNV | Missense_Mutation | rs763601327 | c.385N>C | p.Thr129Pro | p.T129P | Q9HCS7 | protein_coding | deleterious(0) | possibly_damaging(0.757) | TCGA-EW-A1PB-01 | Breast | breast invasive carcinoma | Female | >=65 | III/IV | Unknown | Unknown | SD |
| XAB2 | SNV | Missense_Mutation | rs770164799 | c.2096N>T | p.Thr699Met | p.T699M | Q9HCS7 | protein_coding | deleterious(0.01) | benign(0.018) | TCGA-2W-A8YY-01 | Cervix | cervical & endocervical cancer | Female | <65 | I/II | Chemotherapy | cisplatin | CR |
| XAB2 | SNV | Missense_Mutation | novel | c.1493N>A | p.Gly498Asp | p.G498D | Q9HCS7 | protein_coding | deleterious(0) | probably_damaging(0.98) | TCGA-2W-A8YY-01 | Cervix | cervical & endocervical cancer | Female | <65 | I/II | Chemotherapy | cisplatin | CR |
| Page: 1 2 3 4 5 6 7 8 9 10 11 |
Top |
Related drugs of malignant transformation related genes |
| Identification of chemicals and drugs interact with genes involved in malignant transfromation |
| (DGIdb 4.0) |
| Entrez ID | Symbol | Category | Interaction Types | Drug Claim Name | Drug Name | PMIDs |
| Page: 1 |

Copyright 2023-Present -The University of Texas Health Science Center at Houston |