| Tissue | Expression Dynamics | Abbreviation |
| Cervix | 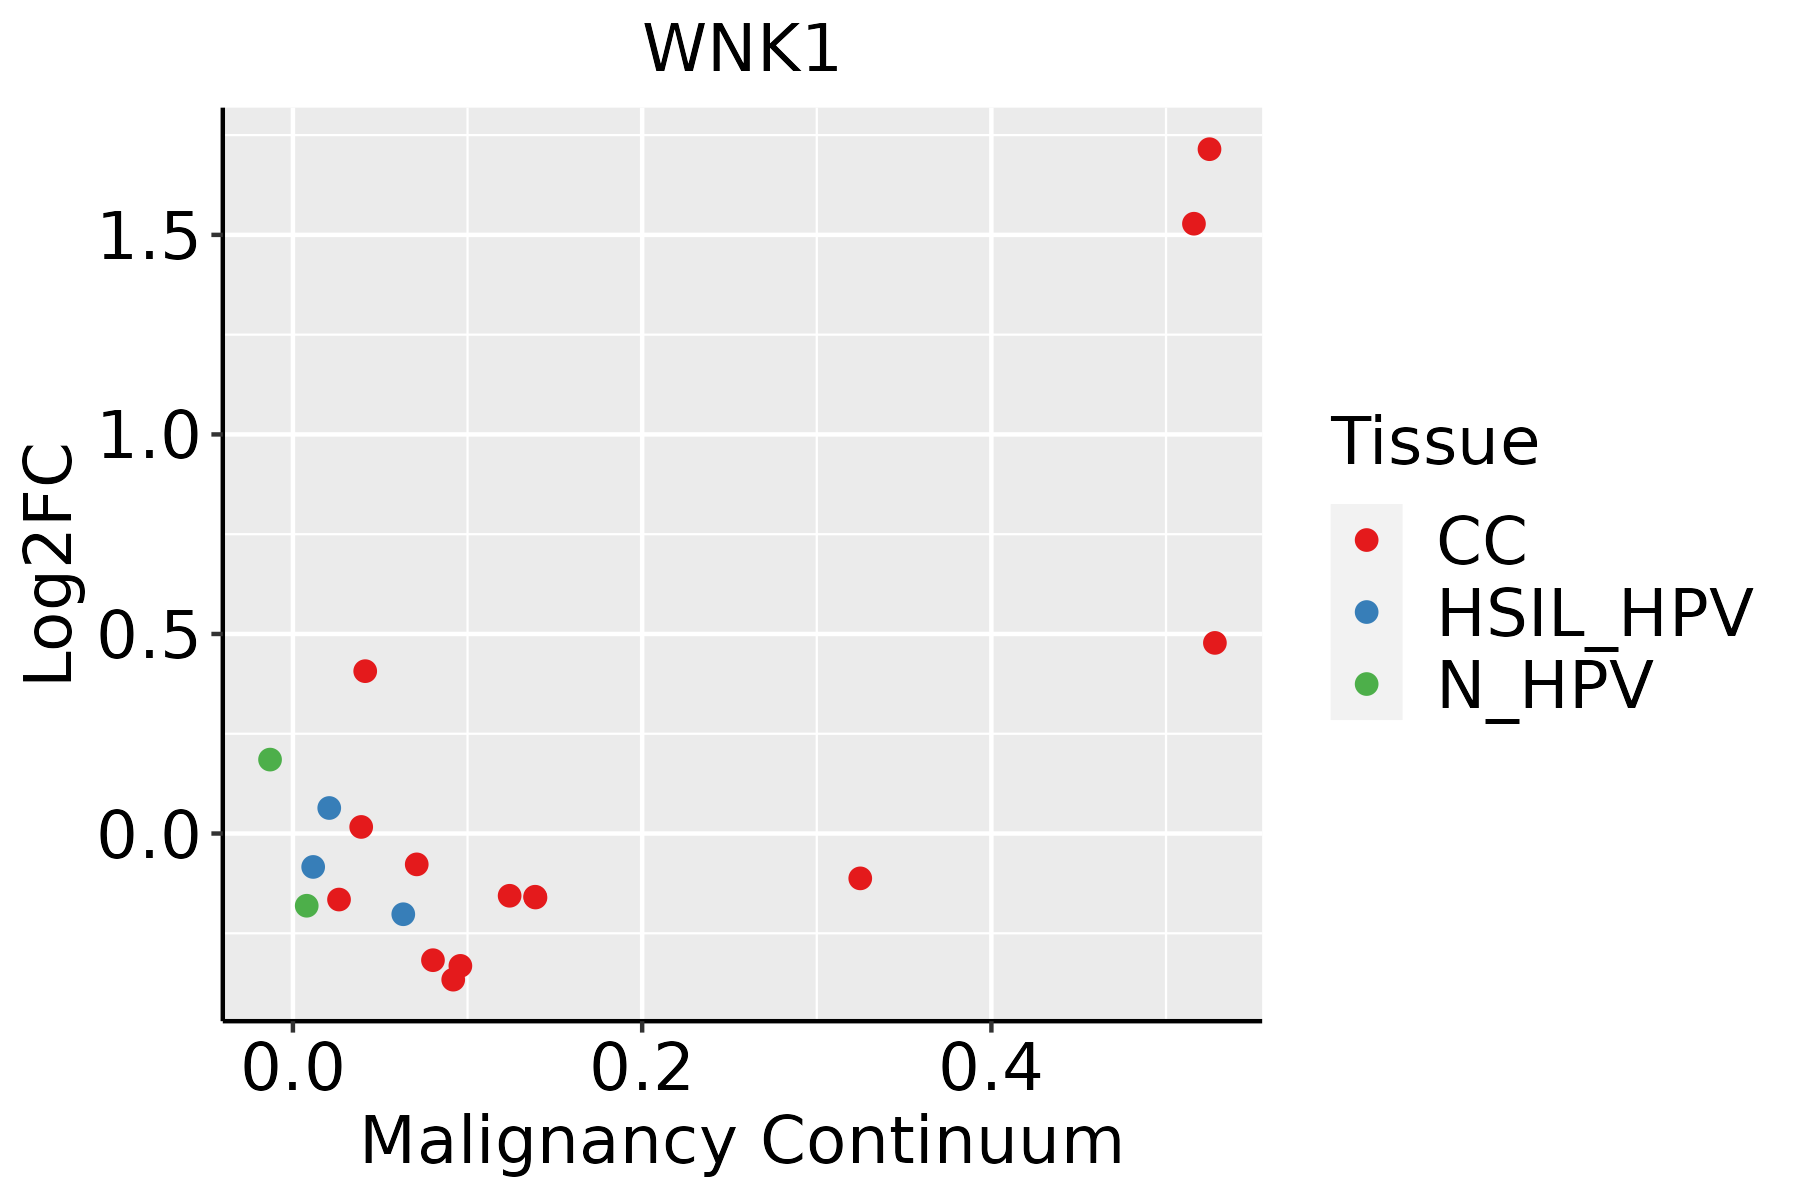 | CC: Cervix cancer |
| HSIL_HPV: HPV-infected high-grade squamous intraepithelial lesions |
| N_HPV: HPV-infected normal cervix |
| Esophagus | 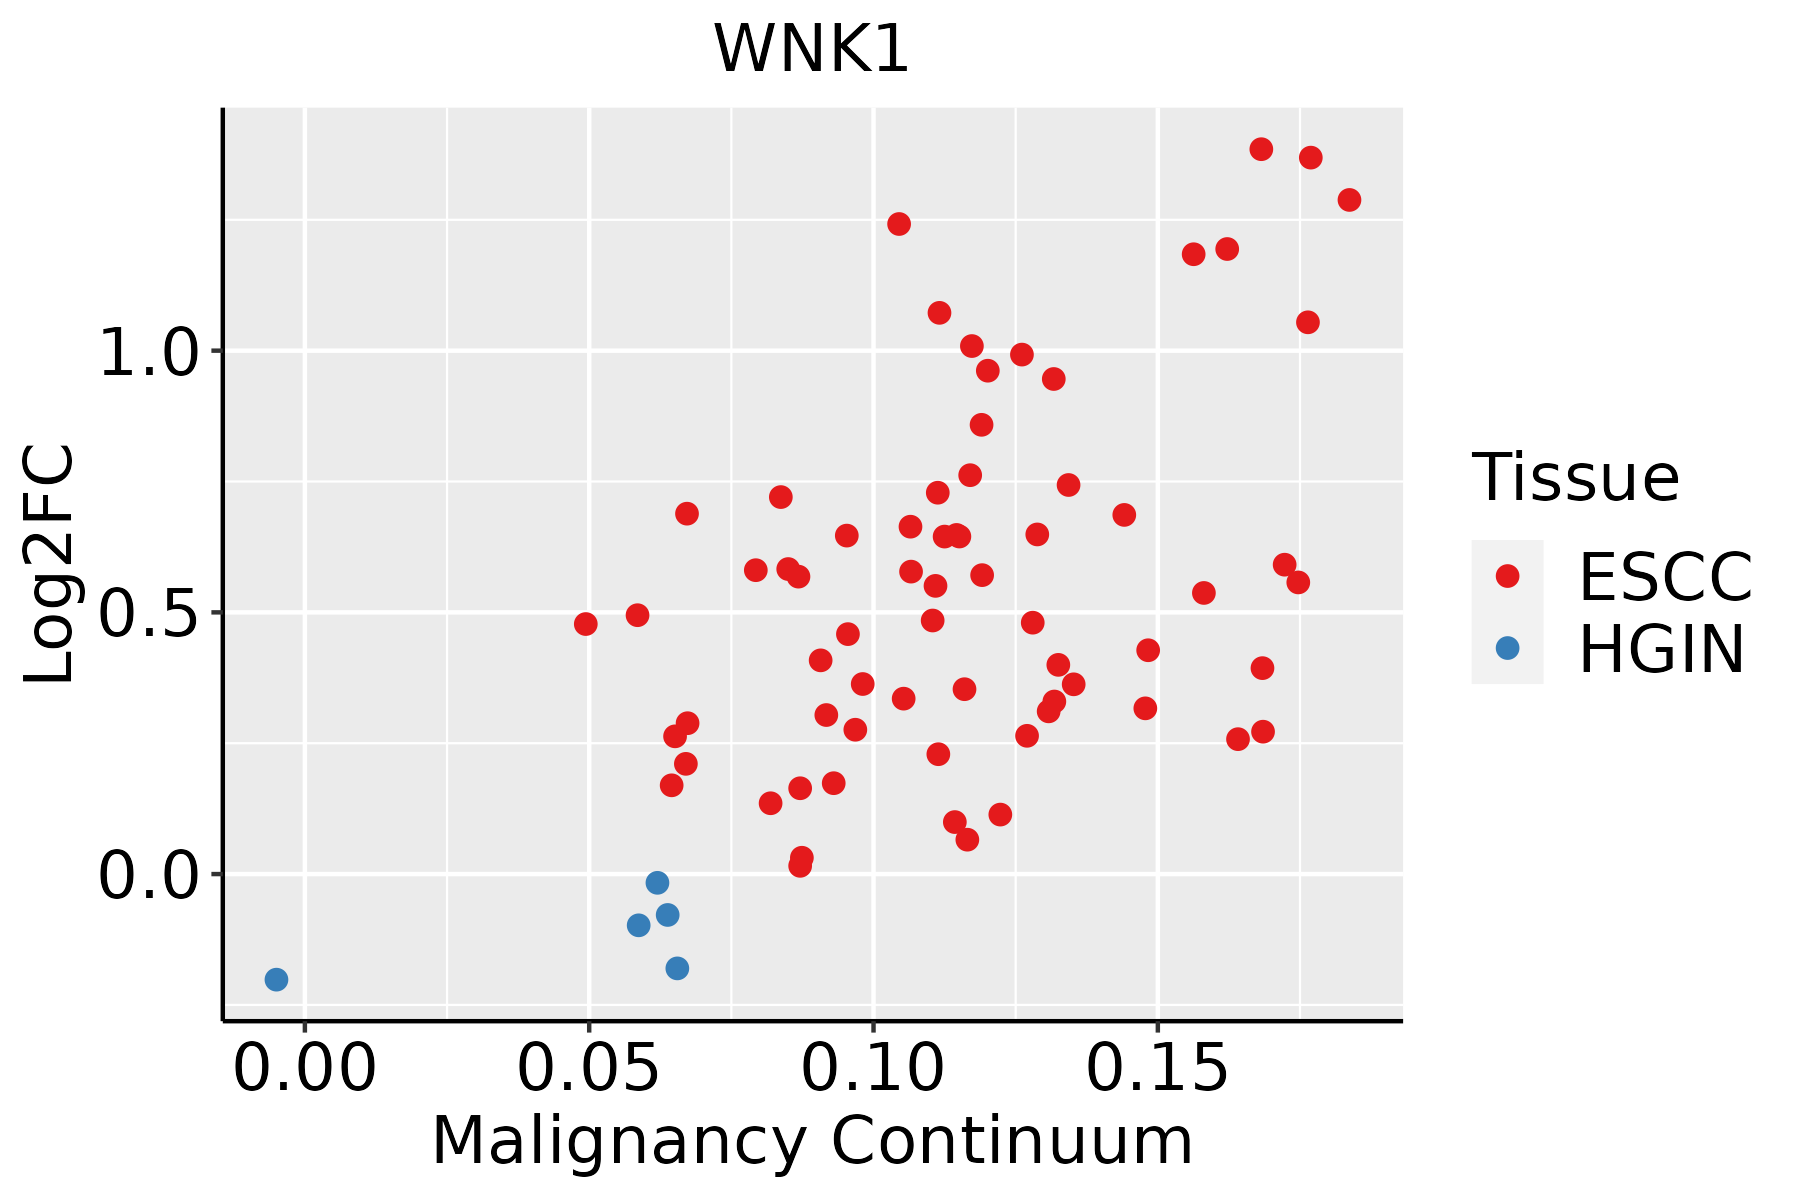 | ESCC: Esophageal squamous cell carcinoma |
| HGIN: High-grade intraepithelial neoplasias |
| LGIN: Low-grade intraepithelial neoplasias |
| Liver | 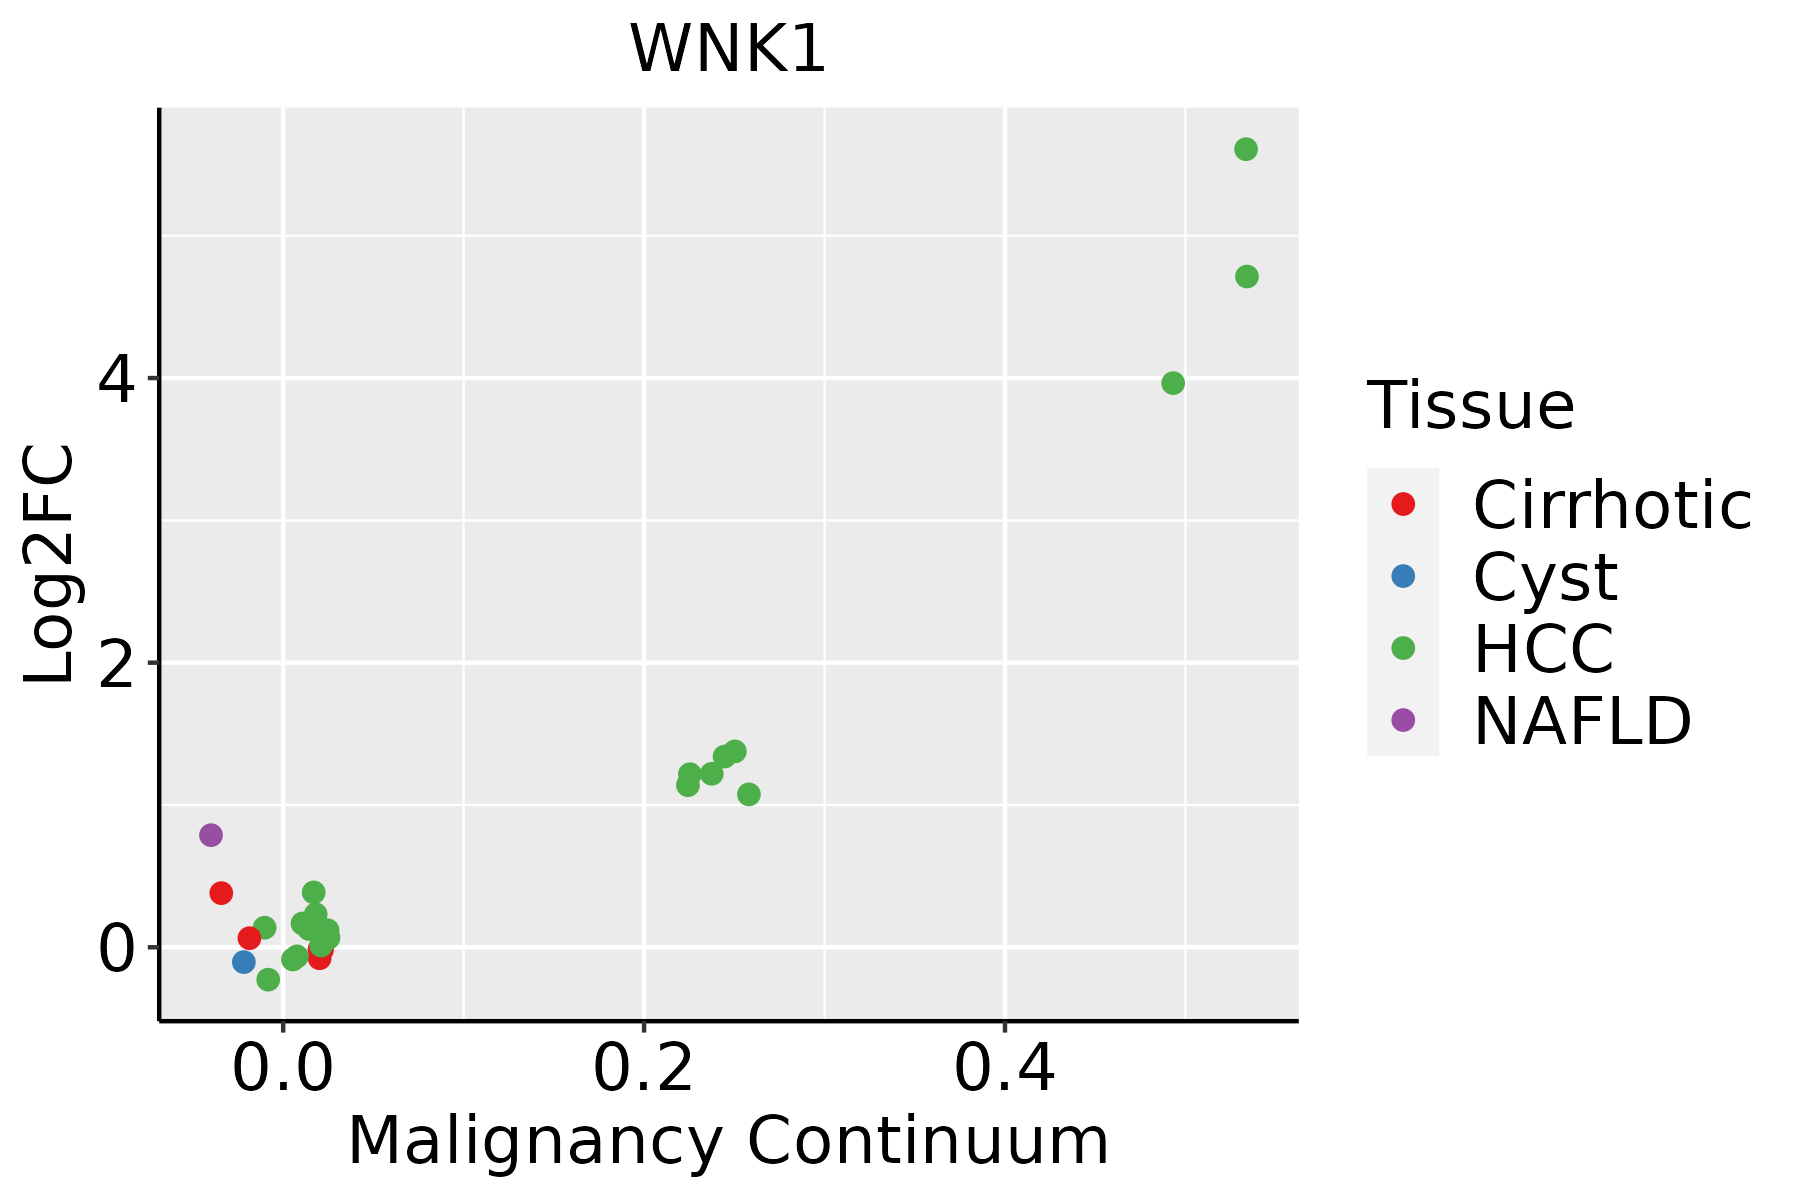 | HCC: Hepatocellular carcinoma |
| NAFLD: Non-alcoholic fatty liver disease |
| Lung | 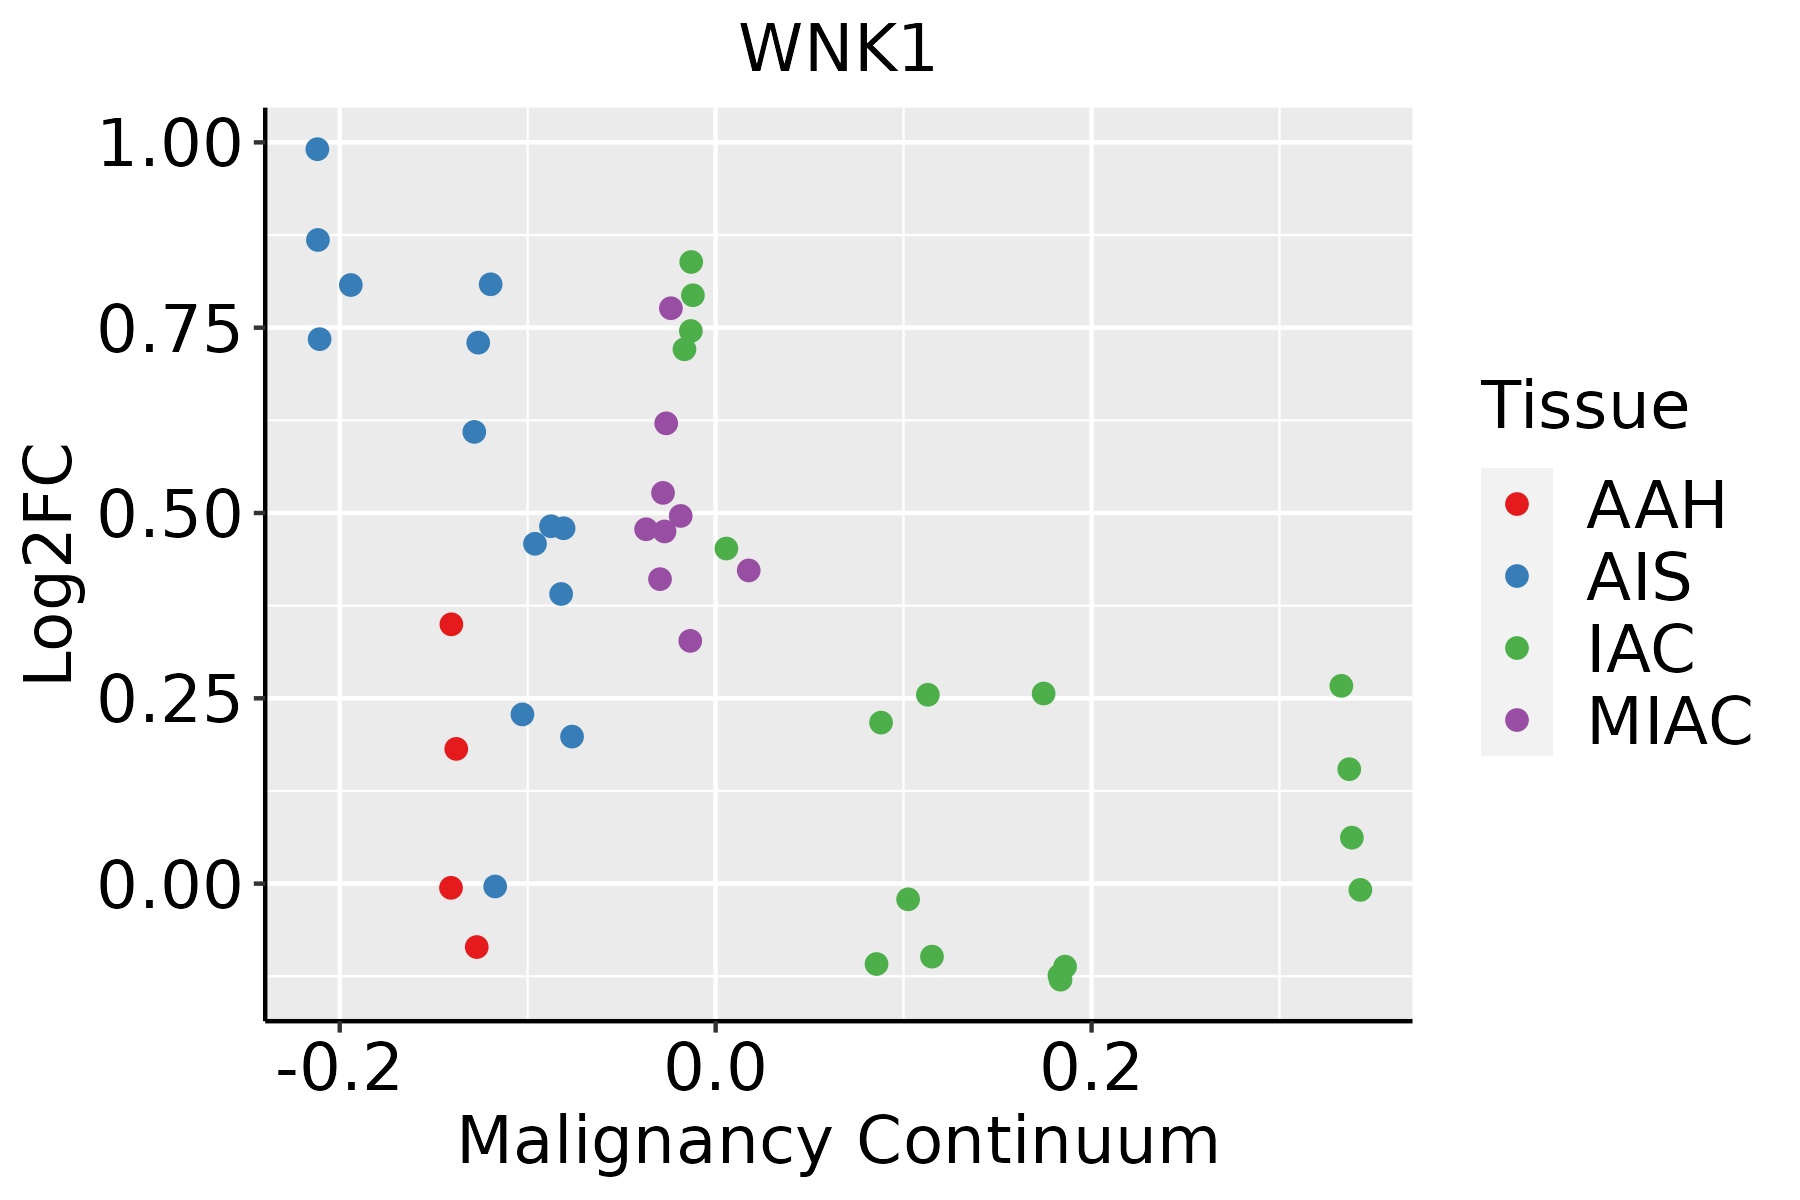 | AAH: Atypical adenomatous hyperplasia |
| AIS: Adenocarcinoma in situ |
| IAC: Invasive lung adenocarcinoma |
| MIA: Minimally invasive adenocarcinoma |
| Oral Cavity | 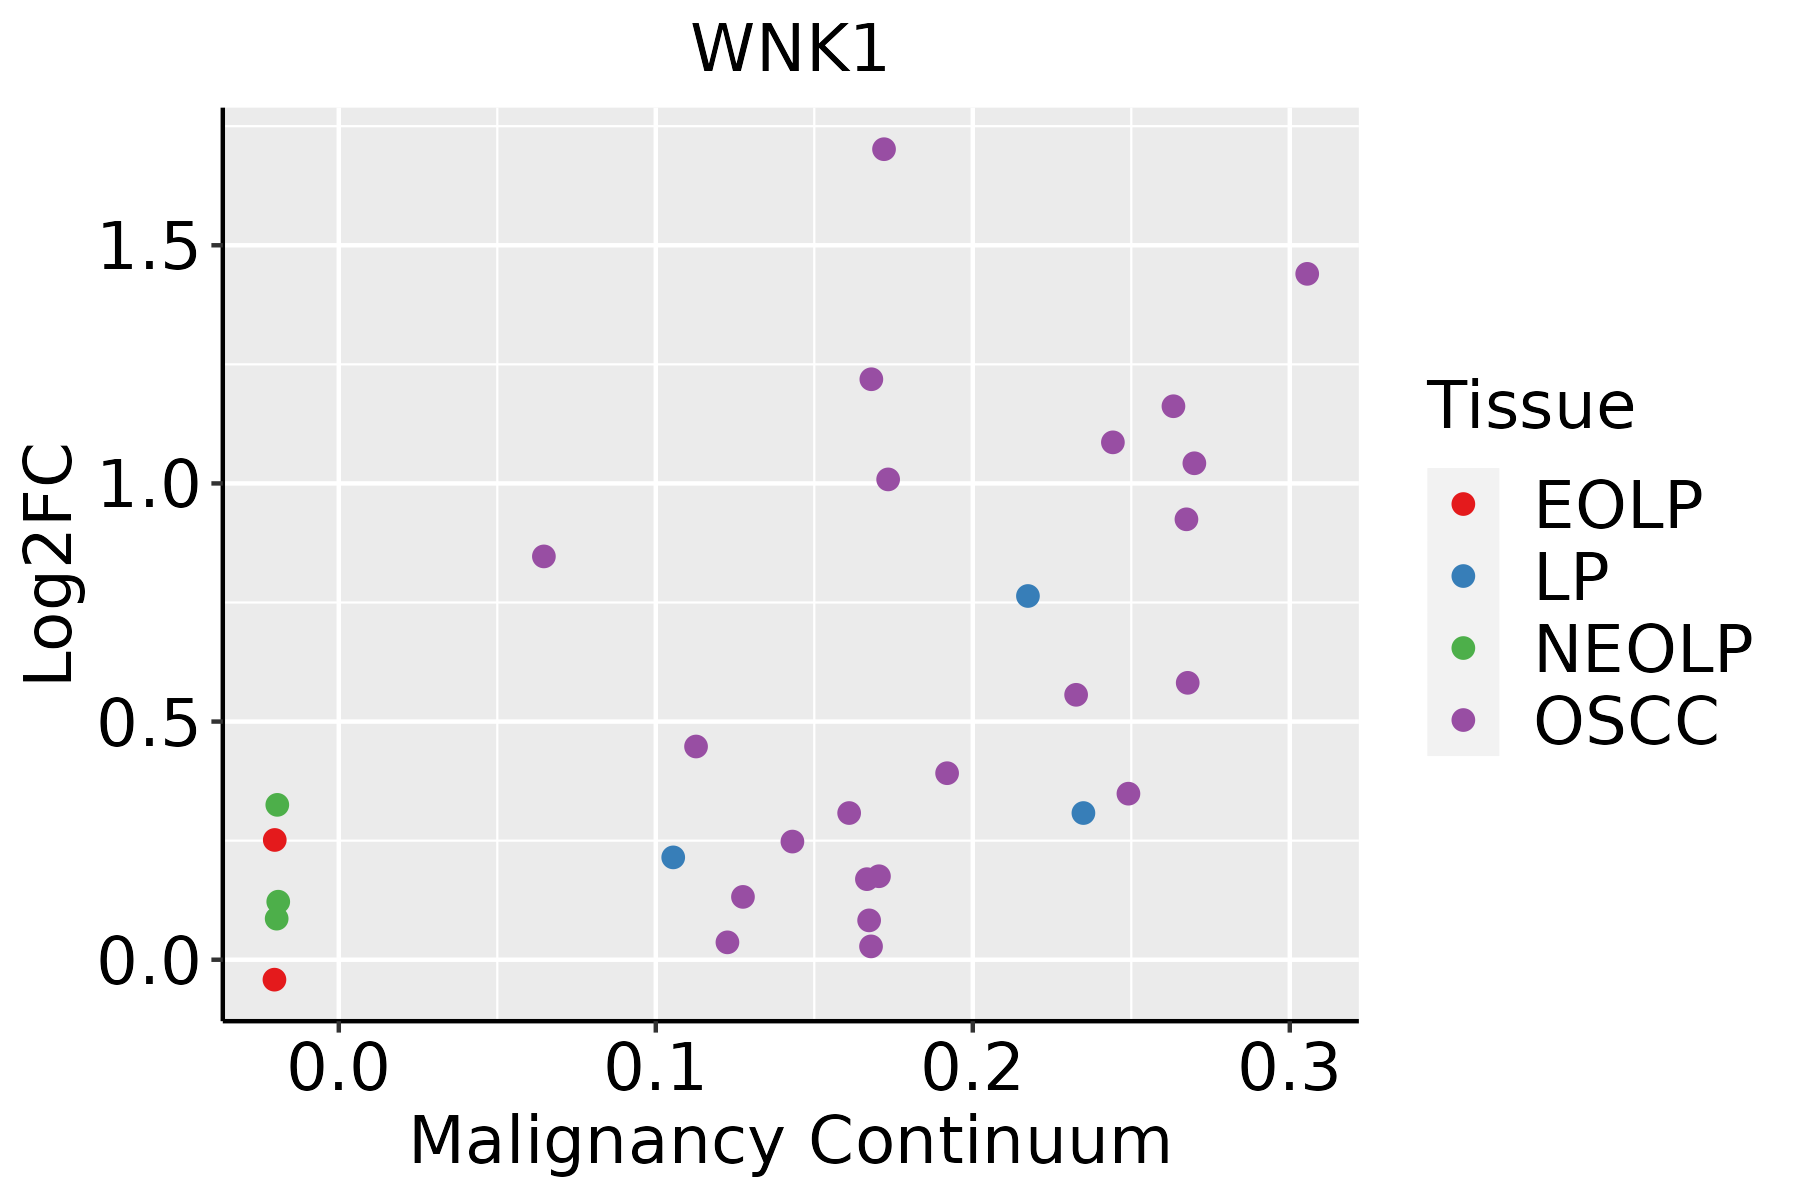 | EOLP: Erosive Oral lichen planus |
| LP: leukoplakia |
| NEOLP: Non-erosive oral lichen planus |
| OSCC: Oral squamous cell carcinoma |
| Prostate | 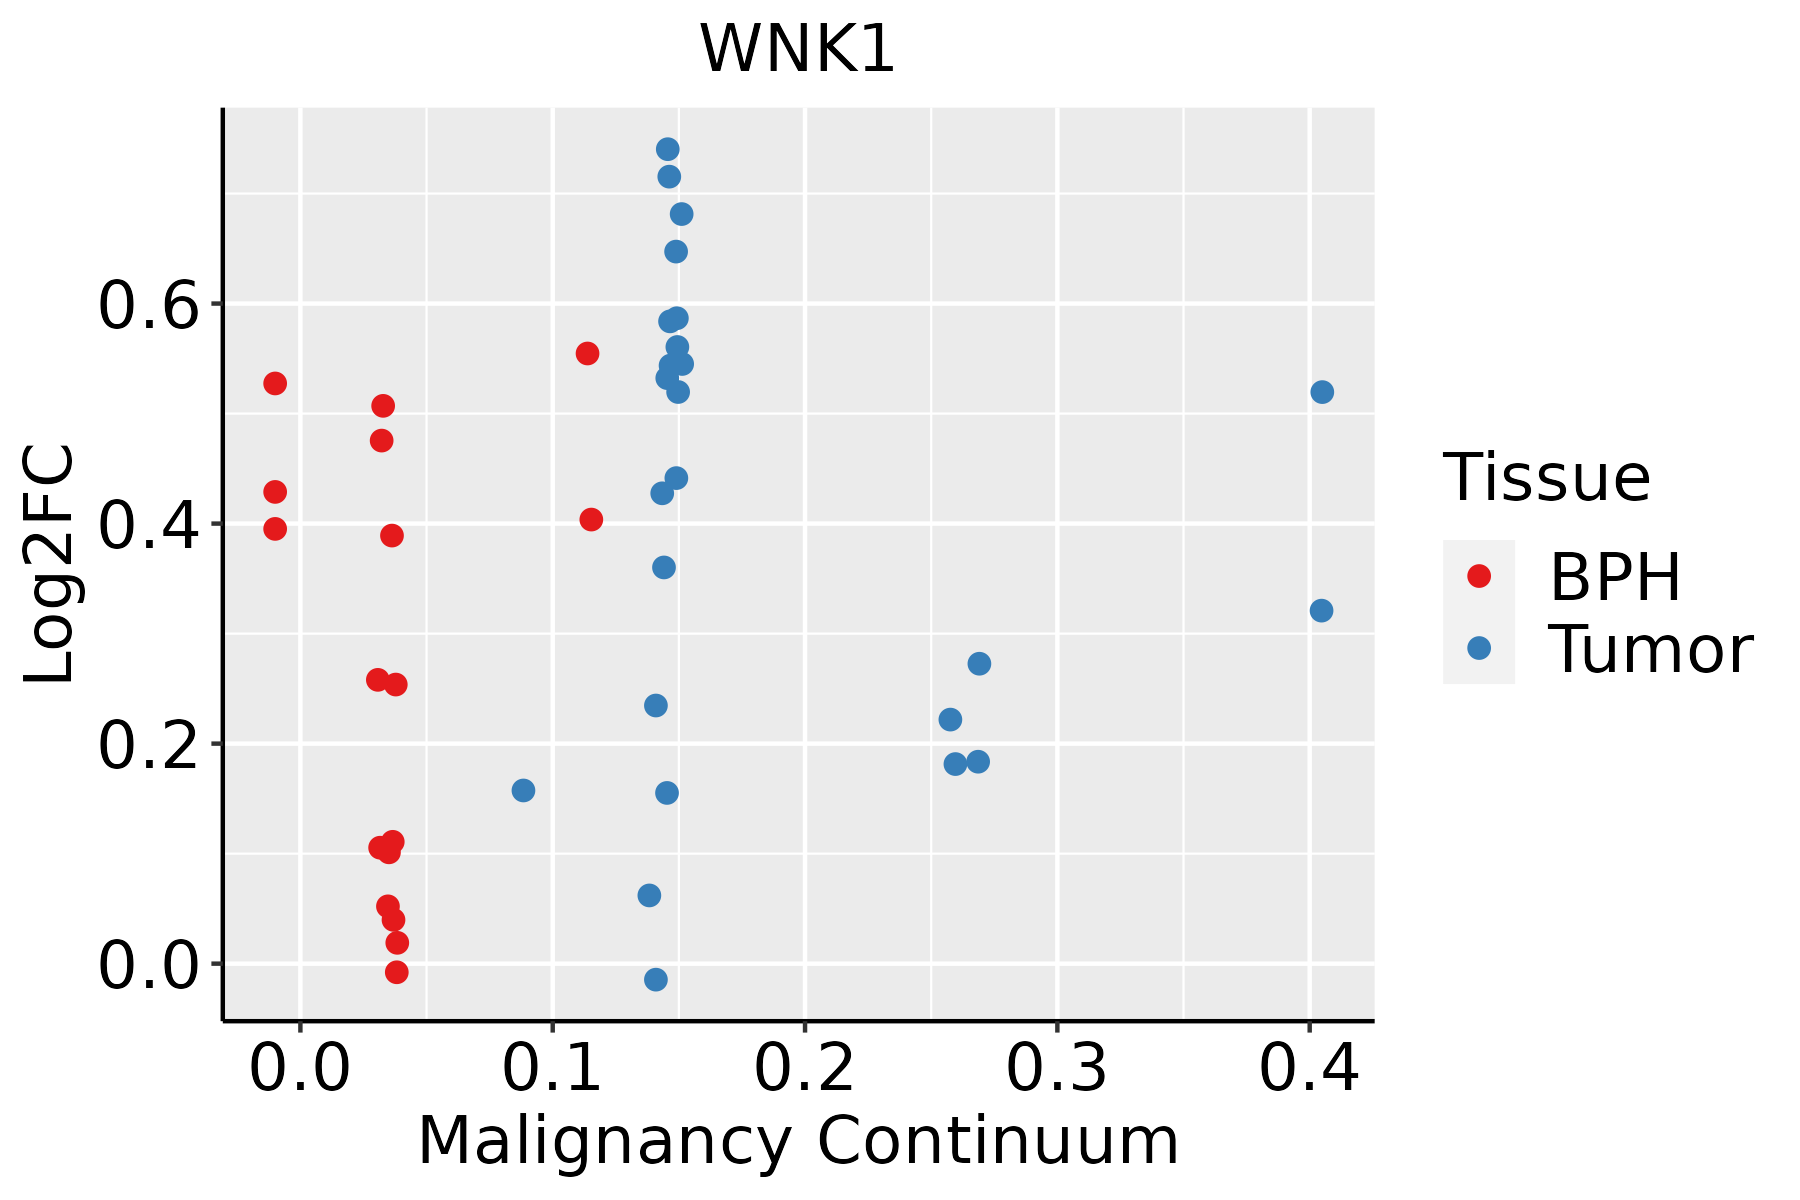 | BPH: Benign Prostatic Hyperplasia |
| Skin |  | AK: Actinic keratosis |
| cSCC: Cutaneous squamous cell carcinoma |
| SCCIS:squamous cell carcinoma in situ |
| Thyroid | 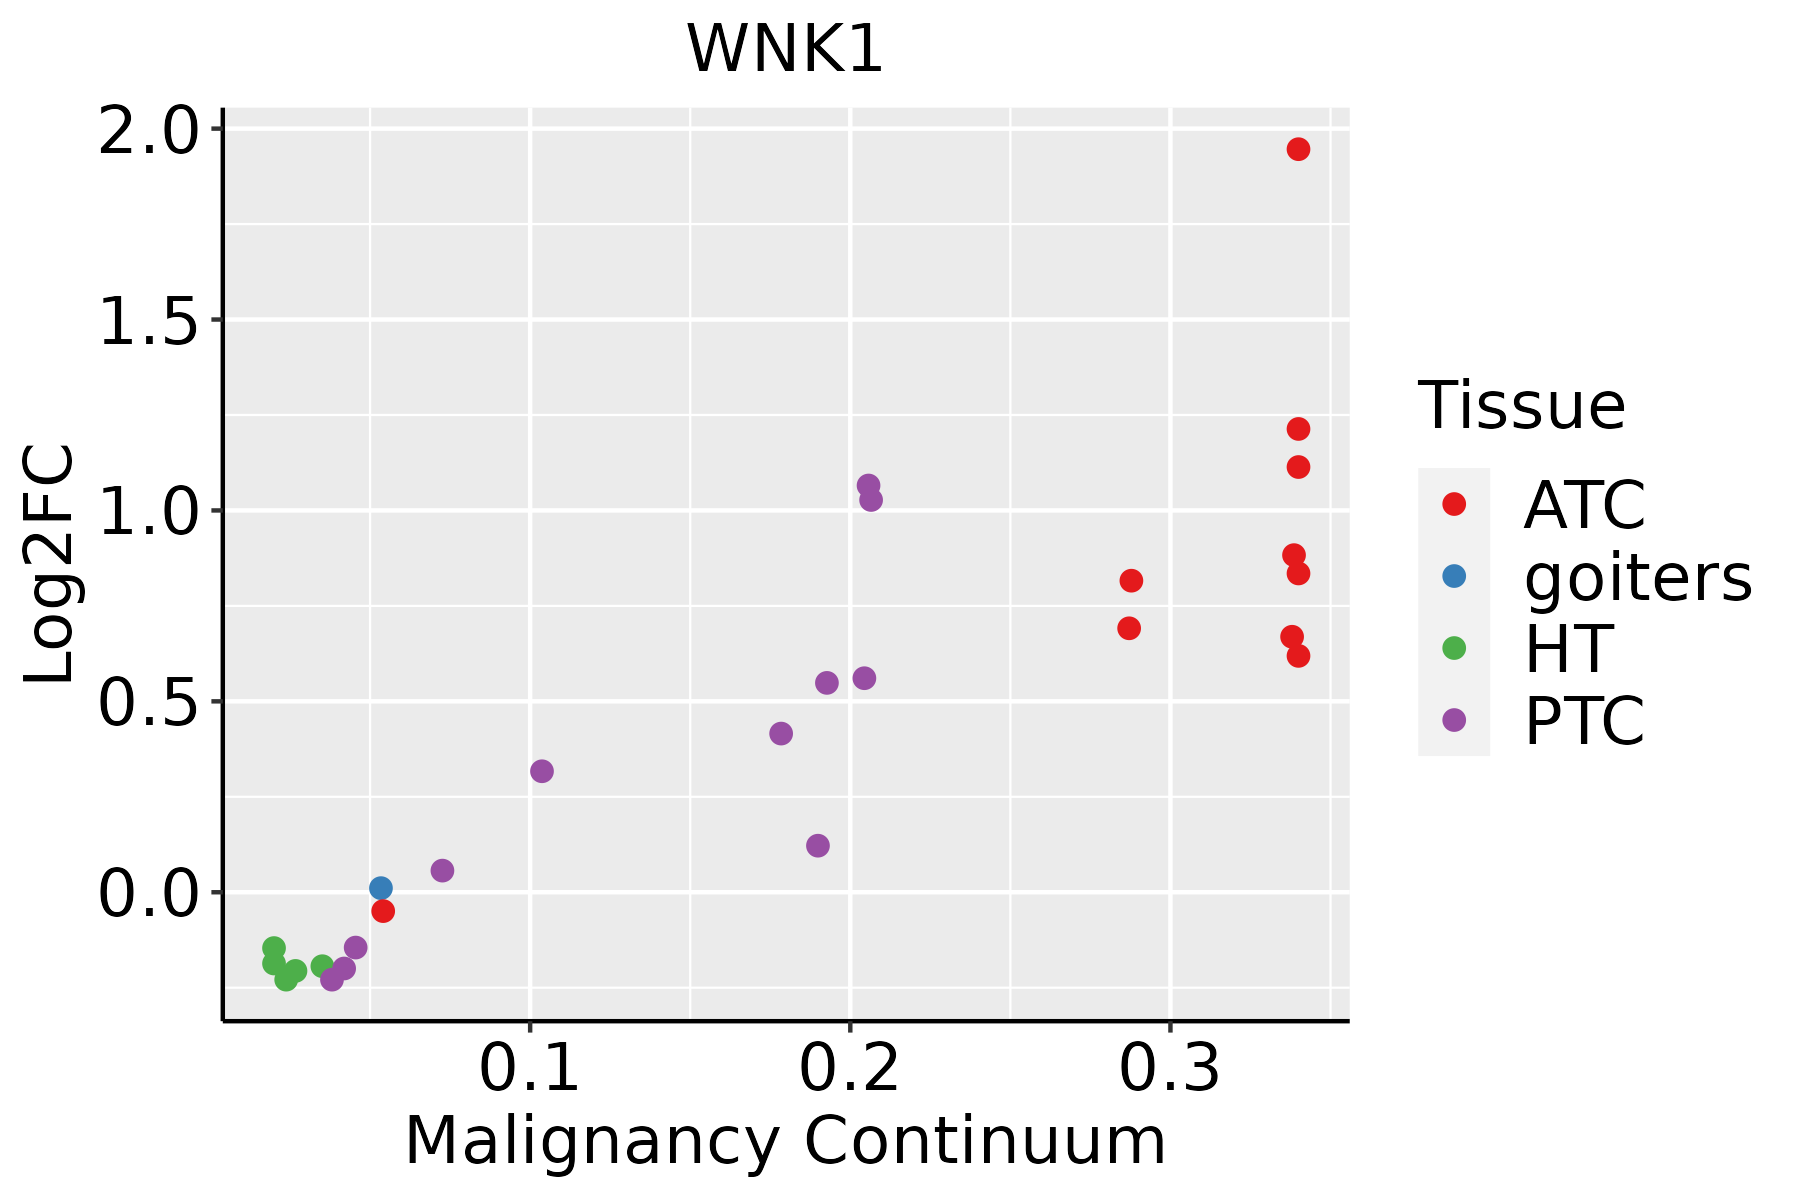 | ATC: Anaplastic thyroid cancer |
| HT: Hashimoto's thyroiditis |
| PTC: Papillary thyroid cancer |
| GO ID | Tissue | Disease Stage | Description | Gene Ratio | Bg Ratio | pvalue | p.adjust | Count |
| GO:000715922 | Cervix | N_HPV | leukocyte cell-cell adhesion | 34/534 | 371/18723 | 2.31e-09 | 7.88e-07 | 34 |
| GO:000268722 | Cervix | N_HPV | positive regulation of leukocyte migration | 19/534 | 135/18723 | 9.82e-09 | 1.72e-06 | 19 |
| GO:000268522 | Cervix | N_HPV | regulation of leukocyte migration | 23/534 | 210/18723 | 3.69e-08 | 4.31e-06 | 23 |
| GO:000276421 | Cervix | N_HPV | immune response-regulating signaling pathway | 36/534 | 468/18723 | 7.52e-08 | 7.81e-06 | 36 |
| GO:002240723 | Cervix | N_HPV | regulation of cell-cell adhesion | 35/534 | 448/18723 | 7.85e-08 | 7.94e-06 | 35 |
| GO:001922121 | Cervix | N_HPV | cytokine-mediated signaling pathway | 36/534 | 472/18723 | 9.30e-08 | 9.21e-06 | 36 |
| GO:190303722 | Cervix | N_HPV | regulation of leukocyte cell-cell adhesion | 29/534 | 336/18723 | 1.30e-07 | 1.18e-05 | 29 |
| GO:007167522 | Cervix | N_HPV | regulation of mononuclear cell migration | 16/534 | 115/18723 | 1.70e-07 | 1.43e-05 | 16 |
| GO:003059522 | Cervix | N_HPV | leukocyte chemotaxis | 23/534 | 230/18723 | 1.97e-07 | 1.60e-05 | 23 |
| GO:003210322 | Cervix | N_HPV | positive regulation of response to external stimulus | 33/534 | 427/18723 | 2.38e-07 | 1.84e-05 | 33 |
| GO:005090022 | Cervix | N_HPV | leukocyte migration | 30/534 | 369/18723 | 2.90e-07 | 2.13e-05 | 30 |
| GO:006032622 | Cervix | N_HPV | cell chemotaxis | 27/534 | 310/18723 | 2.95e-07 | 2.13e-05 | 27 |
| GO:003411321 | Cervix | N_HPV | heterotypic cell-cell adhesion | 11/534 | 61/18723 | 1.05e-06 | 5.71e-05 | 11 |
| GO:007167722 | Cervix | N_HPV | positive regulation of mononuclear cell migration | 11/534 | 65/18723 | 2.04e-06 | 9.96e-05 | 11 |
| GO:000268822 | Cervix | N_HPV | regulation of leukocyte chemotaxis | 15/534 | 122/18723 | 2.06e-06 | 9.96e-05 | 15 |
| GO:000269022 | Cervix | N_HPV | positive regulation of leukocyte chemotaxis | 13/534 | 94/18723 | 2.61e-06 | 1.17e-04 | 13 |
| GO:007167422 | Cervix | N_HPV | mononuclear cell migration | 19/534 | 196/18723 | 3.59e-06 | 1.46e-04 | 19 |
| GO:200040311 | Cervix | N_HPV | positive regulation of lymphocyte migration | 8/534 | 35/18723 | 4.96e-06 | 1.87e-04 | 8 |
| GO:001003825 | Cervix | N_HPV | response to metal ion | 27/534 | 373/18723 | 1.00e-05 | 3.46e-04 | 27 |
| GO:005092121 | Cervix | N_HPV | positive regulation of chemotaxis | 15/534 | 141/18723 | 1.24e-05 | 4.11e-04 | 15 |
| Hugo Symbol | Variant Class | Variant Classification | dbSNP RS | HGVSc | HGVSp | HGVSp Short | SWISSPROT | BIOTYPE | SIFT | PolyPhen | Tumor Sample Barcode | Tissue | Histology | Sex | Age | Stage | Therapy Types | Drugs | Outcome |
| WNK1 | SNV | Missense_Mutation | novel | c.3772T>C | p.Ser1258Pro | p.S1258P | Q9H4A3 | protein_coding | tolerated_low_confidence(0.91) | benign(0) | TCGA-A2-A0YM-01 | Breast | breast invasive carcinoma | Female | >=65 | I/II | Unknown | Unknown | SD |
| WNK1 | SNV | Missense_Mutation | rs756361196 | c.1726N>T | p.Arg576Trp | p.R576W | Q9H4A3 | protein_coding | deleterious(0) | probably_damaging(0.994) | TCGA-A7-A0CG-01 | Breast | breast invasive carcinoma | Female | >=65 | I/II | Unknown | Unknown | SD |
| WNK1 | SNV | Missense_Mutation | rs754884163 | c.2225A>C | p.His742Pro | p.H742P | Q9H4A3 | protein_coding | tolerated_low_confidence(0.23) | benign(0.062) | TCGA-A7-A4SB-01 | Breast | breast invasive carcinoma | Female | <65 | III/IV | Chemotherapy | docetaxel | CR |
| WNK1 | SNV | Missense_Mutation | | c.2534N>A | p.Arg845His | p.R845H | Q9H4A3 | protein_coding | deleterious_low_confidence(0) | probably_damaging(0.957) | TCGA-A8-A09Z-01 | Breast | breast invasive carcinoma | Female | >=65 | I/II | Unknown | Unknown | SD |
| WNK1 | SNV | Missense_Mutation | rs770856927 | c.5228N>T | p.Ser1743Leu | p.S1743L | Q9H4A3 | protein_coding | tolerated_low_confidence(0.07) | benign(0.077) | TCGA-A8-A0A7-01 | Breast | breast invasive carcinoma | Female | <65 | I/II | Unknown | Unknown | SD |
| WNK1 | SNV | Missense_Mutation | | c.1162N>C | p.Glu388Gln | p.E388Q | Q9H4A3 | protein_coding | deleterious(0) | possibly_damaging(0.691) | TCGA-AC-A23H-01 | Breast | breast invasive carcinoma | Female | >=65 | I/II | Unknown | Unknown | PD |
| WNK1 | SNV | Missense_Mutation | rs754884163 | c.2225A>C | p.His742Pro | p.H742P | Q9H4A3 | protein_coding | tolerated_low_confidence(0.23) | benign(0.062) | TCGA-AC-A3W5-01 | Breast | breast invasive carcinoma | Female | >=65 | I/II | Chemotherapy | docetaxel | CR |
| WNK1 | SNV | Missense_Mutation | novel | c.1121T>A | p.Leu374Gln | p.L374Q | Q9H4A3 | protein_coding | deleterious(0) | probably_damaging(0.995) | TCGA-AC-A6IV-01 | Breast | breast invasive carcinoma | Female | <65 | I/II | Unknown | Unknown | SD |
| WNK1 | SNV | Missense_Mutation | novel | c.6390N>C | p.Glu2130Asp | p.E2130D | Q9H4A3 | protein_coding | tolerated(0.08) | benign(0.437) | TCGA-AN-A046-01 | Breast | breast invasive carcinoma | Female | >=65 | I/II | Unknown | Unknown | SD |
| WNK1 | SNV | Missense_Mutation | novel | c.3457N>T | p.Pro1153Ser | p.P1153S | Q9H4A3 | protein_coding | deleterious_low_confidence(0) | probably_damaging(0.935) | TCGA-BH-A0B6-01 | Breast | breast invasive carcinoma | Female | <65 | I/II | Unknown | Unknown | SD |


