
|
|||||
|
 | |
| |
| |
| |
| |
| |
|
Gene: WBP2 |
Gene summary for WBP2 |
| Gene information | Species | Human | Gene symbol | WBP2 | Gene ID | 23558 |
| Gene name | WW domain binding protein 2 | |
| Gene Alias | DFNB107 | |
| Cytomap | 17q25.1 | |
| Gene Type | protein-coding | GO ID | GO:0006139 | UniProtAcc | Q969T9 |
Top |
Malignant transformation analysis |
| Identification of the aberrant gene expression in precancerous and cancerous lesions by comparing the gene expression of stem-like cells in diseased tissues with normal stem cells |
| Entrez ID | Symbol | Replicates | Species | Organ | Tissue | Adj P-value | Log2FC | Malignancy |
| 23558 | WBP2 | HTA11_2487_2000001011 | Human | Colorectum | SER | 2.04e-11 | 5.44e-01 | -0.1808 |
| 23558 | WBP2 | HTA11_347_2000001011 | Human | Colorectum | AD | 3.27e-09 | 3.33e-01 | -0.1954 |
| 23558 | WBP2 | HTA11_411_2000001011 | Human | Colorectum | SER | 5.39e-09 | 1.02e+00 | -0.2602 |
| 23558 | WBP2 | HTA11_2112_2000001011 | Human | Colorectum | SER | 3.54e-05 | 5.14e-01 | -0.2196 |
| 23558 | WBP2 | HTA11_696_2000001011 | Human | Colorectum | AD | 1.71e-09 | 3.14e-01 | -0.1464 |
| 23558 | WBP2 | HTA11_866_2000001011 | Human | Colorectum | AD | 1.76e-03 | 1.96e-01 | -0.1001 |
| 23558 | WBP2 | HTA11_1391_2000001011 | Human | Colorectum | AD | 9.49e-10 | 4.43e-01 | -0.059 |
| 23558 | WBP2 | HTA11_866_3004761011 | Human | Colorectum | AD | 4.44e-04 | 1.84e-01 | 0.096 |
| 23558 | WBP2 | HTA11_10711_2000001011 | Human | Colorectum | AD | 2.68e-04 | 2.31e-01 | 0.0338 |
| 23558 | WBP2 | HTA11_7696_3000711011 | Human | Colorectum | AD | 1.26e-06 | 1.80e-01 | 0.0674 |
| 23558 | WBP2 | HTA11_99999970781_79442 | Human | Colorectum | MSS | 1.33e-03 | 2.00e-01 | 0.294 |
| 23558 | WBP2 | HTA11_99999965104_69814 | Human | Colorectum | MSS | 2.21e-04 | 2.07e-01 | 0.281 |
| 23558 | WBP2 | HTA11_99999971662_82457 | Human | Colorectum | MSS | 5.91e-17 | 4.00e-01 | 0.3859 |
| 23558 | WBP2 | HTA11_99999974143_84620 | Human | Colorectum | MSS | 9.71e-09 | 2.90e-01 | 0.3005 |
| 23558 | WBP2 | LZE4T | Human | Esophagus | ESCC | 2.54e-20 | 3.94e-01 | 0.0811 |
| 23558 | WBP2 | LZE7T | Human | Esophagus | ESCC | 2.35e-10 | 4.88e-01 | 0.0667 |
| 23558 | WBP2 | LZE8T | Human | Esophagus | ESCC | 6.31e-09 | 1.88e-01 | 0.067 |
| 23558 | WBP2 | LZE20T | Human | Esophagus | ESCC | 1.00e-06 | 4.03e-01 | 0.0662 |
| 23558 | WBP2 | LZE22D1 | Human | Esophagus | HGIN | 7.46e-03 | 1.11e-01 | 0.0595 |
| 23558 | WBP2 | LZE22T | Human | Esophagus | ESCC | 3.52e-06 | 4.97e-01 | 0.068 |
| Page: 1 2 3 4 5 6 7 |
| Tissue | Expression Dynamics | Abbreviation |
| Colorectum (GSE201348) |  | FAP: Familial adenomatous polyposis |
| CRC: Colorectal cancer | ||
| Colorectum (HTA11) |  | AD: Adenomas |
| SER: Sessile serrated lesions | ||
| MSI-H: Microsatellite-high colorectal cancer | ||
| MSS: Microsatellite stable colorectal cancer | ||
| Esophagus |  | ESCC: Esophageal squamous cell carcinoma |
| HGIN: High-grade intraepithelial neoplasias | ||
| LGIN: Low-grade intraepithelial neoplasias | ||
| Liver | 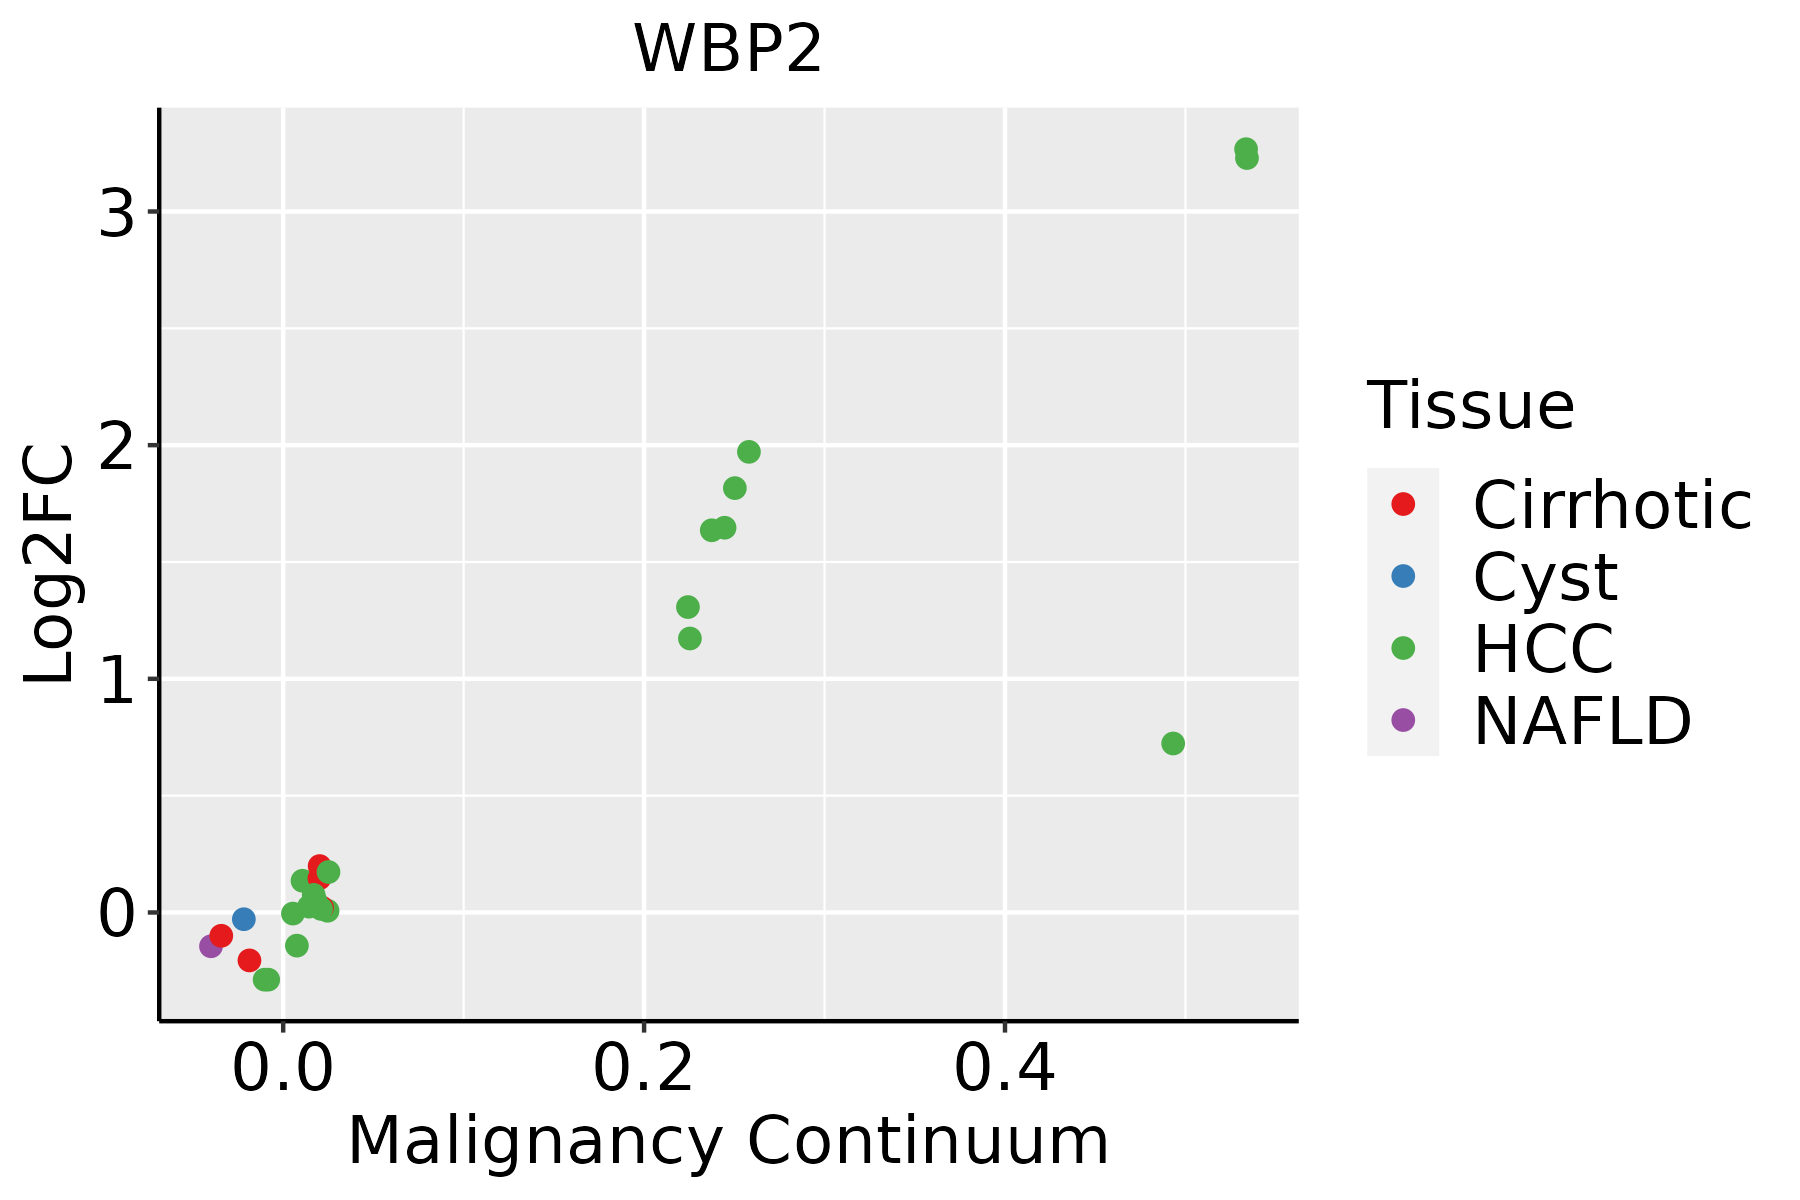 | HCC: Hepatocellular carcinoma |
| NAFLD: Non-alcoholic fatty liver disease | ||
| Oral Cavity |  | EOLP: Erosive Oral lichen planus |
| LP: leukoplakia | ||
| NEOLP: Non-erosive oral lichen planus | ||
| OSCC: Oral squamous cell carcinoma | ||
| Skin | 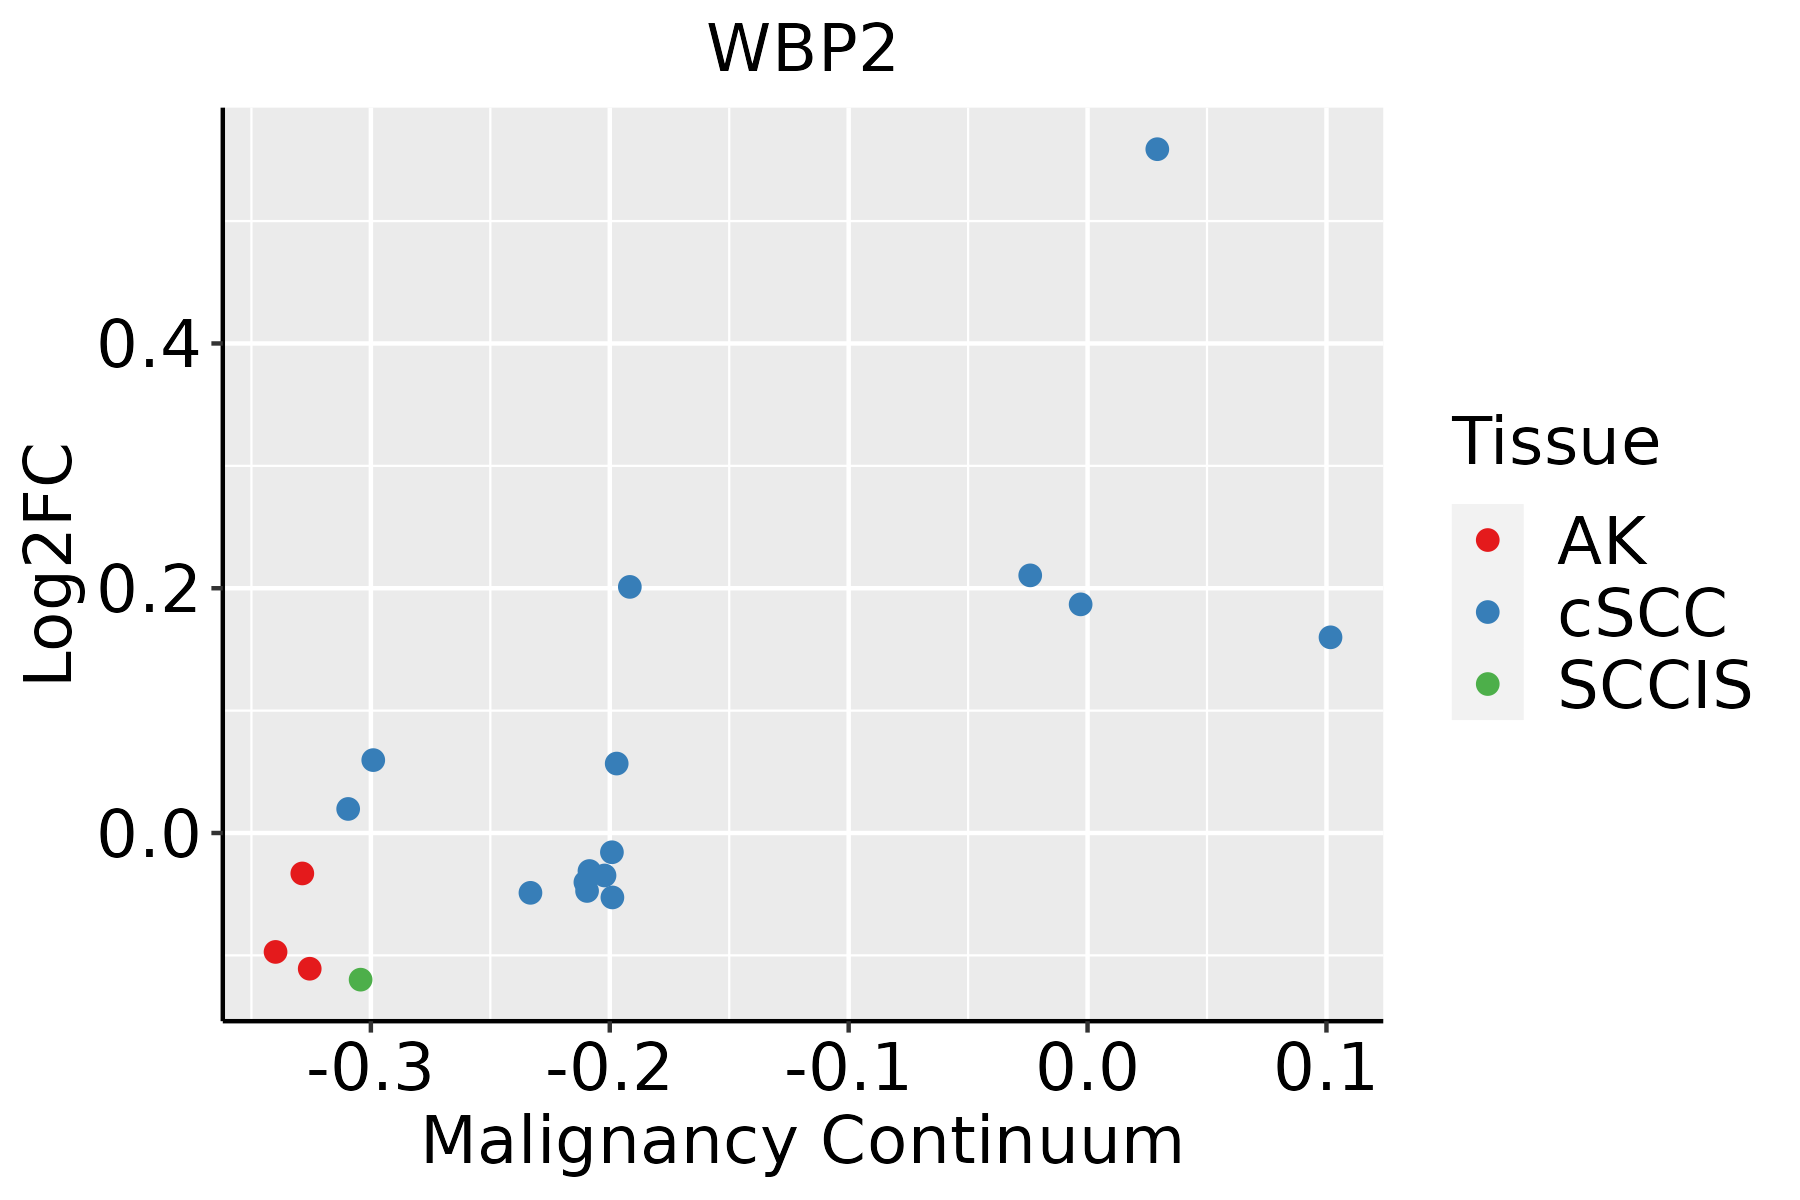 | AK: Actinic keratosis |
| cSCC: Cutaneous squamous cell carcinoma | ||
| SCCIS:squamous cell carcinoma in situ | ||
| Thyroid | 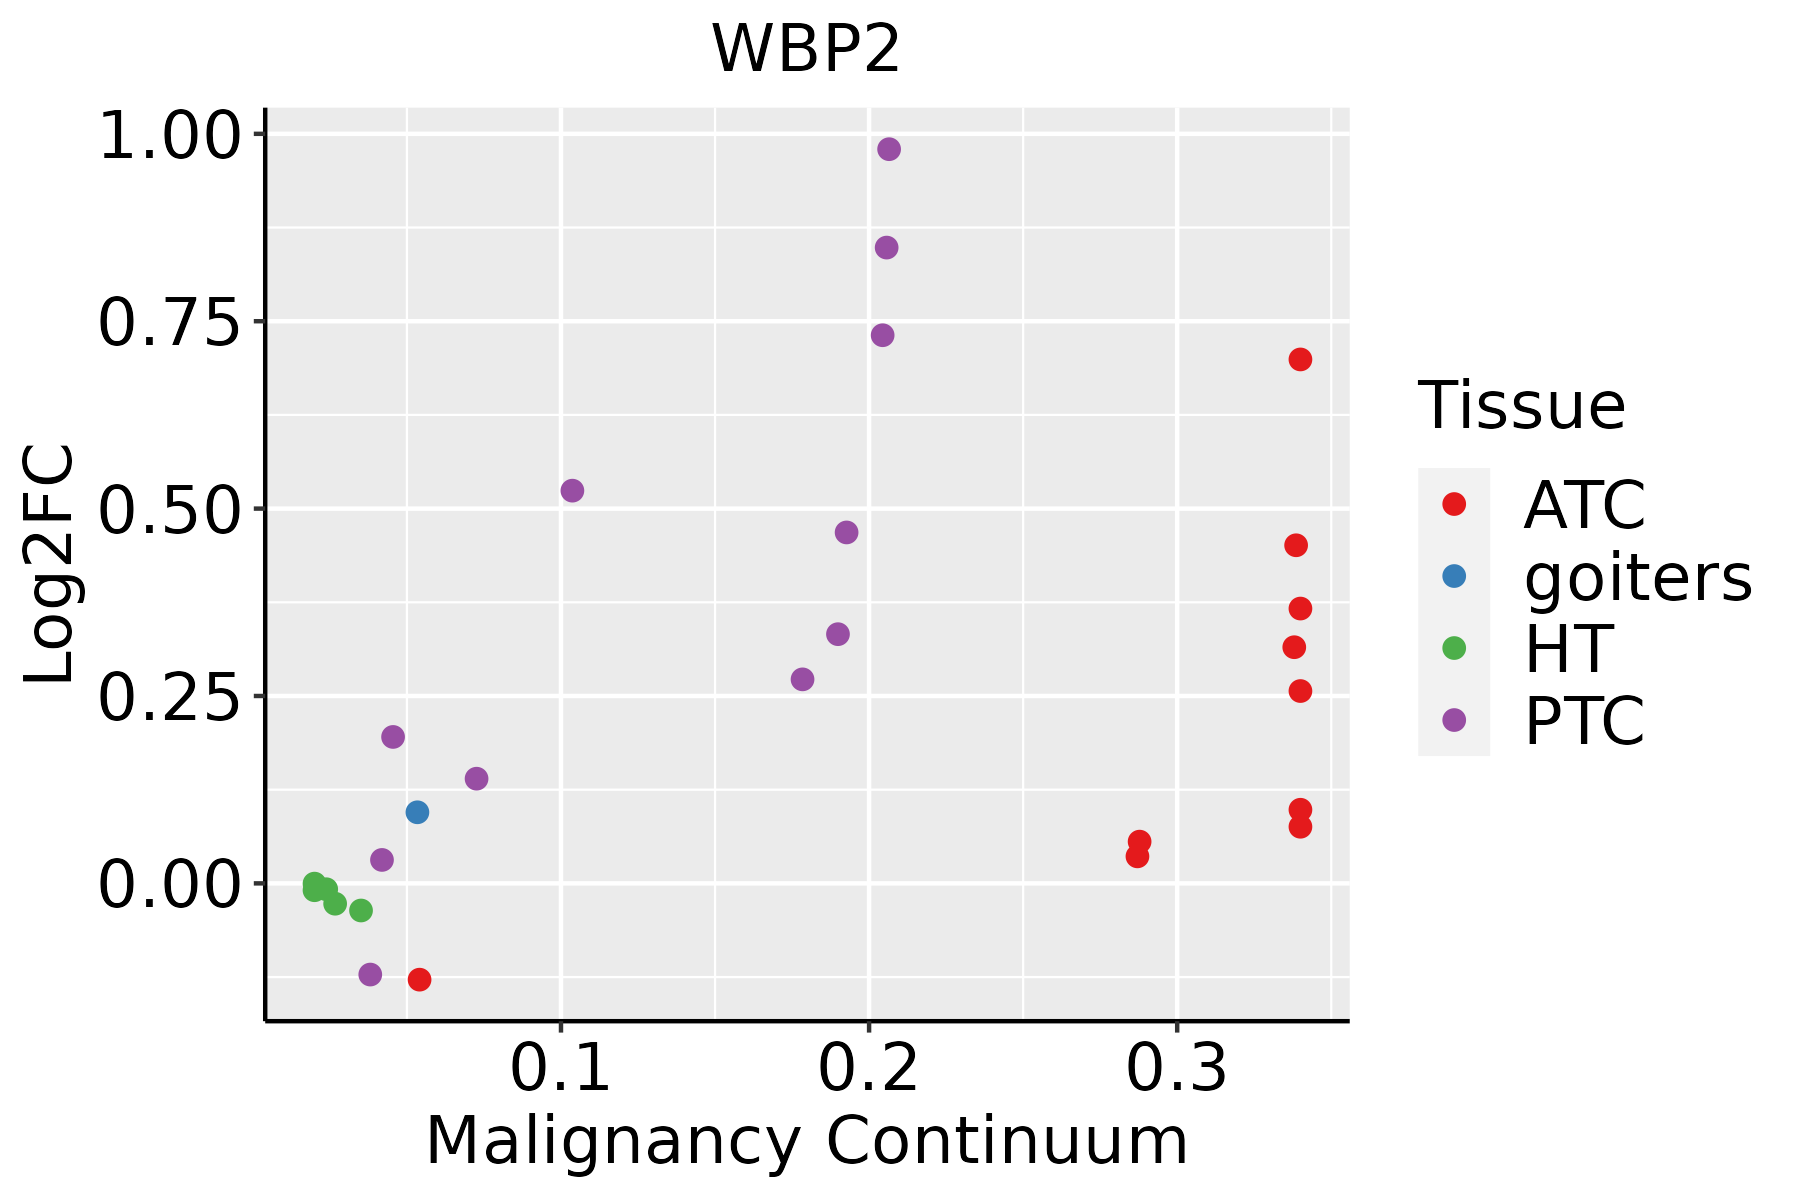 | ATC: Anaplastic thyroid cancer |
| HT: Hashimoto's thyroiditis | ||
| PTC: Papillary thyroid cancer |
| ∗log2FC in expression of this searched gene in stem-like cells from each diseased tissue sample relative to stem-like cells in normal samples in each tissue plotted against the malignancy continuum. Samples are colored based on if they are from different disease stage. |
Top |
Malignant transformation related pathway analysis |
| Find out the enriched GO biological processes and KEGG pathways involved in transition from healthy to precancer to cancer |
| Tissue | Disease Stage | Enriched GO biological Processes |
| Colorectum | AD |  |
| Colorectum | SER |  |
| Colorectum | MSS |  |
| Colorectum | MSI-H |  |
| Colorectum | FAP |  |
| ∗Top 15 enriched GO BP terms are showed in the bar plot of each disease state in each tissue. Each row represents a significant GO biological process which is colored according to the -log10(p.adjust). |
| Page: 1 2 3 4 5 6 7 8 9 |
| GO ID | Tissue | Disease Stage | Description | Gene Ratio | Bg Ratio | pvalue | p.adjust | Count |
| GO:1901654111 | Esophagus | ESCC | response to ketone | 118/8552 | 194/18723 | 1.45e-05 | 1.31e-04 | 118 |
| GO:00439662 | Esophagus | ESCC | histone H3 acetylation | 43/8552 | 61/18723 | 7.57e-05 | 5.67e-04 | 43 |
| GO:00331438 | Esophagus | ESCC | regulation of intracellular steroid hormone receptor signaling pathway | 50/8552 | 74/18723 | 1.16e-04 | 8.04e-04 | 50 |
| GO:20007564 | Esophagus | ESCC | regulation of peptidyl-lysine acetylation | 43/8552 | 63/18723 | 2.43e-04 | 1.50e-03 | 43 |
| GO:19019835 | Esophagus | ESCC | regulation of protein acetylation | 49/8552 | 77/18723 | 1.12e-03 | 5.60e-03 | 49 |
| GO:00350653 | Esophagus | ESCC | regulation of histone acetylation | 36/8552 | 54/18723 | 1.49e-03 | 7.06e-03 | 36 |
| GO:000975516 | Esophagus | ESCC | hormone-mediated signaling pathway | 106/8552 | 190/18723 | 3.13e-03 | 1.30e-02 | 106 |
| GO:003052014 | Esophagus | ESCC | intracellular estrogen receptor signaling pathway | 35/8552 | 54/18723 | 3.55e-03 | 1.45e-02 | 35 |
| GO:003257016 | Esophagus | ESCC | response to progesterone | 25/8552 | 37/18723 | 5.94e-03 | 2.19e-02 | 25 |
| GO:00436275 | Esophagus | ESCC | response to estrogen | 45/8552 | 75/18723 | 8.75e-03 | 3.08e-02 | 45 |
| GO:0045815 | Esophagus | ESCC | positive regulation of gene expression, epigenetic | 13/8552 | 17/18723 | 1.00e-02 | 3.42e-02 | 13 |
| GO:00331463 | Esophagus | ESCC | regulation of intracellular estrogen receptor signaling pathway | 23/8552 | 35/18723 | 1.34e-02 | 4.38e-02 | 23 |
| GO:004854512 | Liver | Cirrhotic | response to steroid hormone | 146/4634 | 339/18723 | 7.87e-14 | 6.76e-12 | 146 |
| GO:007138312 | Liver | Cirrhotic | cellular response to steroid hormone stimulus | 90/4634 | 204/18723 | 1.04e-09 | 4.70e-08 | 90 |
| GO:190165412 | Liver | Cirrhotic | response to ketone | 86/4634 | 194/18723 | 1.82e-09 | 7.73e-08 | 86 |
| GO:003052212 | Liver | Cirrhotic | intracellular receptor signaling pathway | 105/4634 | 265/18723 | 5.44e-08 | 1.69e-06 | 105 |
| GO:00064731 | Liver | Cirrhotic | protein acetylation | 84/4634 | 201/18723 | 7.50e-08 | 2.25e-06 | 84 |
| GO:00183941 | Liver | Cirrhotic | peptidyl-lysine acetylation | 73/4634 | 169/18723 | 1.08e-07 | 3.07e-06 | 73 |
| GO:00435431 | Liver | Cirrhotic | protein acylation | 95/4634 | 243/18723 | 4.73e-07 | 1.07e-05 | 95 |
| GO:00182051 | Liver | Cirrhotic | peptidyl-lysine modification | 134/4634 | 376/18723 | 1.29e-06 | 2.59e-05 | 134 |
| Page: 1 2 3 4 5 6 7 8 9 10 11 12 13 |
| Pathway ID | Tissue | Disease Stage | Description | Gene Ratio | Bg Ratio | pvalue | p.adjust | qvalue | Count |
| Page: 1 |
Top |
Cell-cell communication analysis |
| Identification of potential cell-cell interactions between two cell types and their ligand-receptor pairs for different disease states |
| Ligand | Receptor | LRpair | Pathway | Tissue | Disease Stage |
| Page: 1 |
Top |
Single-cell gene regulatory network inference analysis |
| Find out the significant the regulons (TFs) and the target genes of each regulon across cell types for different disease states |
| TF | Cell Type | Tissue | Disease Stage | Target Gene | RSS | Regulon Activity |
| ∗The dot plots of a searched regulon are shown for all cell subpopulations in each disease state of each tissue based on the regulon specific score inferred using pySCENIC and by calculating the average expression. |
| Page: 1 |
Top |
Somatic mutation of malignant transformation related genes |
| Annotation of somatic variants for genes involved in malignant transformation |
| Hugo Symbol | Variant Class | Variant Classification | dbSNP RS | HGVSc | HGVSp | HGVSp Short | SWISSPROT | BIOTYPE | SIFT | PolyPhen | Tumor Sample Barcode | Tissue | Histology | Sex | Age | Stage | Therapy Types | Drugs | Outcome |
| WBP2 | SNV | Missense_Mutation | c.332N>G | p.Lys111Arg | p.K111R | Q969T9 | protein_coding | deleterious(0.02) | probably_damaging(0.933) | TCGA-A8-A09E-01 | Breast | breast invasive carcinoma | Female | >=65 | III/IV | Hormone Therapy | anastrozole | SD | |
| WBP2 | SNV | Missense_Mutation | rs563500410 | c.299C>T | p.Ala100Val | p.A100V | Q969T9 | protein_coding | deleterious(0.01) | benign(0.37) | TCGA-CK-5916-01 | Colorectum | colon adenocarcinoma | Female | >=65 | I/II | Unknown | Unknown | PD |
| WBP2 | SNV | Missense_Mutation | novel | c.514N>C | p.Tyr172His | p.Y172H | Q969T9 | protein_coding | tolerated(0.14) | possibly_damaging(0.597) | TCGA-G4-6302-01 | Colorectum | colon adenocarcinoma | Female | >=65 | I/II | Unknown | Unknown | SD |
| WBP2 | SNV | Missense_Mutation | rs367581512 | c.682N>A | p.Ala228Thr | p.A228T | Q969T9 | protein_coding | tolerated(0.1) | probably_damaging(0.995) | TCGA-NH-A5IV-01 | Colorectum | colon adenocarcinoma | Female | >=65 | I/II | Unknown | Unknown | SD |
| WBP2 | SNV | Missense_Mutation | c.500N>A | p.Pro167His | p.P167H | Q969T9 | protein_coding | deleterious(0) | probably_damaging(0.954) | TCGA-EI-6882-01 | Colorectum | rectum adenocarcinoma | Male | <65 | I/II | Unknown | Unknown | SD | |
| WBP2 | SNV | Missense_Mutation | rs771265316 | c.256N>A | p.Val86Ile | p.V86I | Q969T9 | protein_coding | tolerated(0.05) | probably_damaging(0.979) | TCGA-A5-A0G1-01 | Endometrium | uterine corpus endometrioid carcinoma | Female | >=65 | I/II | Unknown | Unknown | SD |
| WBP2 | SNV | Missense_Mutation | rs760988068 | c.293N>T | p.Ala98Val | p.A98V | Q969T9 | protein_coding | deleterious(0) | possibly_damaging(0.883) | TCGA-AP-A051-01 | Endometrium | uterine corpus endometrioid carcinoma | Female | >=65 | I/II | Unknown | Unknown | SD |
| WBP2 | SNV | Missense_Mutation | rs563500410 | c.299N>T | p.Ala100Val | p.A100V | Q969T9 | protein_coding | deleterious(0.01) | benign(0.37) | TCGA-D1-A177-01 | Endometrium | uterine corpus endometrioid carcinoma | Female | >=65 | I/II | Unknown | Unknown | PD |
| WBP2 | SNV | Missense_Mutation | novel | c.389N>T | p.Ala130Val | p.A130V | Q969T9 | protein_coding | deleterious(0) | possibly_damaging(0.61) | TCGA-DF-A2KN-01 | Endometrium | uterine corpus endometrioid carcinoma | Female | Unknown | I/II | Unknown | Unknown | SD |
| WBP2 | SNV | Missense_Mutation | novel | c.175N>G | p.Phe59Val | p.F59V | Q969T9 | protein_coding | deleterious(0) | probably_damaging(0.998) | TCGA-DI-A1NO-01 | Endometrium | uterine corpus endometrioid carcinoma | Female | >=65 | III/IV | Unknown | Unknown | PD |
| Page: 1 2 |
Top |
Related drugs of malignant transformation related genes |
| Identification of chemicals and drugs interact with genes involved in malignant transfromation |
| (DGIdb 4.0) |
| Entrez ID | Symbol | Category | Interaction Types | Drug Claim Name | Drug Name | PMIDs |
| Page: 1 |

Copyright 2023-Present -The University of Texas Health Science Center at Houston |