
|
|||||
|
 | |
| |
| |
| |
| |
| |
|
Gene: UQCRFS1 |
Gene summary for UQCRFS1 |
| Gene information | Species | Human | Gene symbol | UQCRFS1 | Gene ID | 7386 |
| Gene name | ubiquinol-cytochrome c reductase, Rieske iron-sulfur polypeptide 1 | |
| Gene Alias | MC3DN10 | |
| Cytomap | 19q12 | |
| Gene Type | protein-coding | GO ID | GO:0006091 | UniProtAcc | P47985 |
Top |
Malignant transformation analysis |
| Identification of the aberrant gene expression in precancerous and cancerous lesions by comparing the gene expression of stem-like cells in diseased tissues with normal stem cells |
| Entrez ID | Symbol | Replicates | Species | Organ | Tissue | Adj P-value | Log2FC | Malignancy |
| 7386 | UQCRFS1 | HTA11_2487_2000001011 | Human | Colorectum | SER | 1.56e-03 | 2.84e-01 | -0.1808 |
| 7386 | UQCRFS1 | HTA11_1938_2000001011 | Human | Colorectum | AD | 1.60e-02 | 3.03e-01 | -0.0811 |
| 7386 | UQCRFS1 | HTA11_78_2000001011 | Human | Colorectum | AD | 1.08e-06 | 3.67e-01 | -0.1088 |
| 7386 | UQCRFS1 | HTA11_347_2000001011 | Human | Colorectum | AD | 6.67e-30 | 7.47e-01 | -0.1954 |
| 7386 | UQCRFS1 | HTA11_2112_2000001011 | Human | Colorectum | SER | 2.59e-02 | 4.91e-01 | -0.2196 |
| 7386 | UQCRFS1 | HTA11_3361_2000001011 | Human | Colorectum | AD | 7.62e-03 | 2.71e-01 | -0.1207 |
| 7386 | UQCRFS1 | HTA11_83_2000001011 | Human | Colorectum | SER | 4.41e-08 | 5.38e-01 | -0.1526 |
| 7386 | UQCRFS1 | HTA11_696_2000001011 | Human | Colorectum | AD | 4.54e-15 | 4.62e-01 | -0.1464 |
| 7386 | UQCRFS1 | HTA11_866_2000001011 | Human | Colorectum | AD | 2.88e-05 | 2.83e-01 | -0.1001 |
| 7386 | UQCRFS1 | HTA11_1391_2000001011 | Human | Colorectum | AD | 3.64e-13 | 5.88e-01 | -0.059 |
| 7386 | UQCRFS1 | HTA11_2992_2000001011 | Human | Colorectum | SER | 3.02e-04 | 5.23e-01 | -0.1706 |
| 7386 | UQCRFS1 | HTA11_546_2000001011 | Human | Colorectum | AD | 5.57e-07 | 4.00e-01 | -0.0842 |
| 7386 | UQCRFS1 | HTA11_7862_2000001011 | Human | Colorectum | AD | 1.37e-04 | 3.94e-01 | -0.0179 |
| 7386 | UQCRFS1 | HTA11_866_3004761011 | Human | Colorectum | AD | 1.32e-07 | 3.72e-01 | 0.096 |
| 7386 | UQCRFS1 | HTA11_4255_2000001011 | Human | Colorectum | SER | 3.68e-04 | 6.18e-01 | 0.0446 |
| 7386 | UQCRFS1 | HTA11_7663_2000001011 | Human | Colorectum | SER | 1.86e-04 | 6.80e-01 | 0.0131 |
| 7386 | UQCRFS1 | HTA11_10623_2000001011 | Human | Colorectum | AD | 1.19e-11 | 6.00e-01 | -0.0177 |
| 7386 | UQCRFS1 | HTA11_6801_2000001011 | Human | Colorectum | SER | 6.81e-18 | 1.32e+00 | 0.0171 |
| 7386 | UQCRFS1 | HTA11_10711_2000001011 | Human | Colorectum | AD | 1.18e-04 | 3.42e-01 | 0.0338 |
| 7386 | UQCRFS1 | HTA11_7696_3000711011 | Human | Colorectum | AD | 2.67e-21 | 6.46e-01 | 0.0674 |
| Page: 1 2 3 4 5 6 7 8 9 10 |
| Tissue | Expression Dynamics | Abbreviation |
| Colorectum (GSE201348) |  | FAP: Familial adenomatous polyposis |
| CRC: Colorectal cancer | ||
| Colorectum (HTA11) |  | AD: Adenomas |
| SER: Sessile serrated lesions | ||
| MSI-H: Microsatellite-high colorectal cancer | ||
| MSS: Microsatellite stable colorectal cancer | ||
| Esophagus | 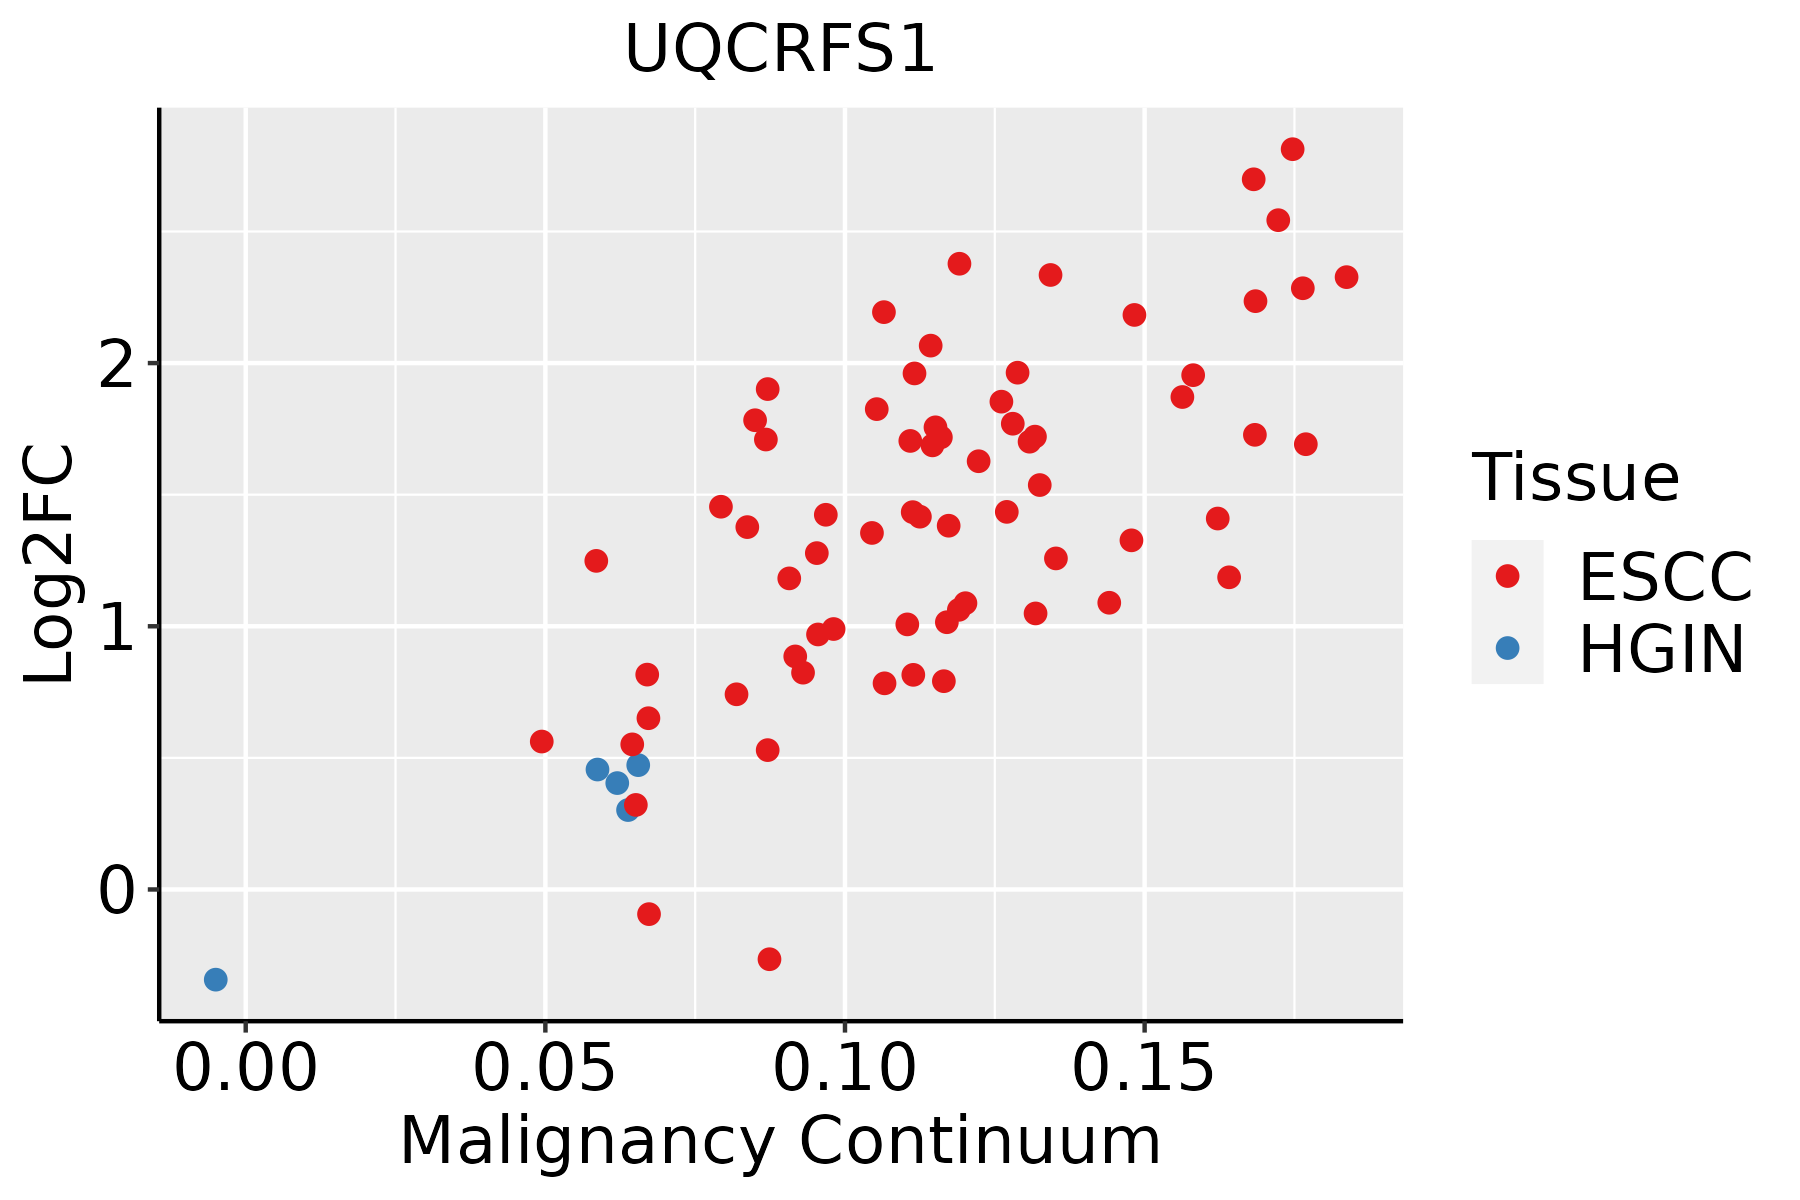 | ESCC: Esophageal squamous cell carcinoma |
| HGIN: High-grade intraepithelial neoplasias | ||
| LGIN: Low-grade intraepithelial neoplasias | ||
| Liver |  | HCC: Hepatocellular carcinoma |
| NAFLD: Non-alcoholic fatty liver disease | ||
| Oral Cavity |  | EOLP: Erosive Oral lichen planus |
| LP: leukoplakia | ||
| NEOLP: Non-erosive oral lichen planus | ||
| OSCC: Oral squamous cell carcinoma | ||
| Prostate |  | BPH: Benign Prostatic Hyperplasia |
| Skin | 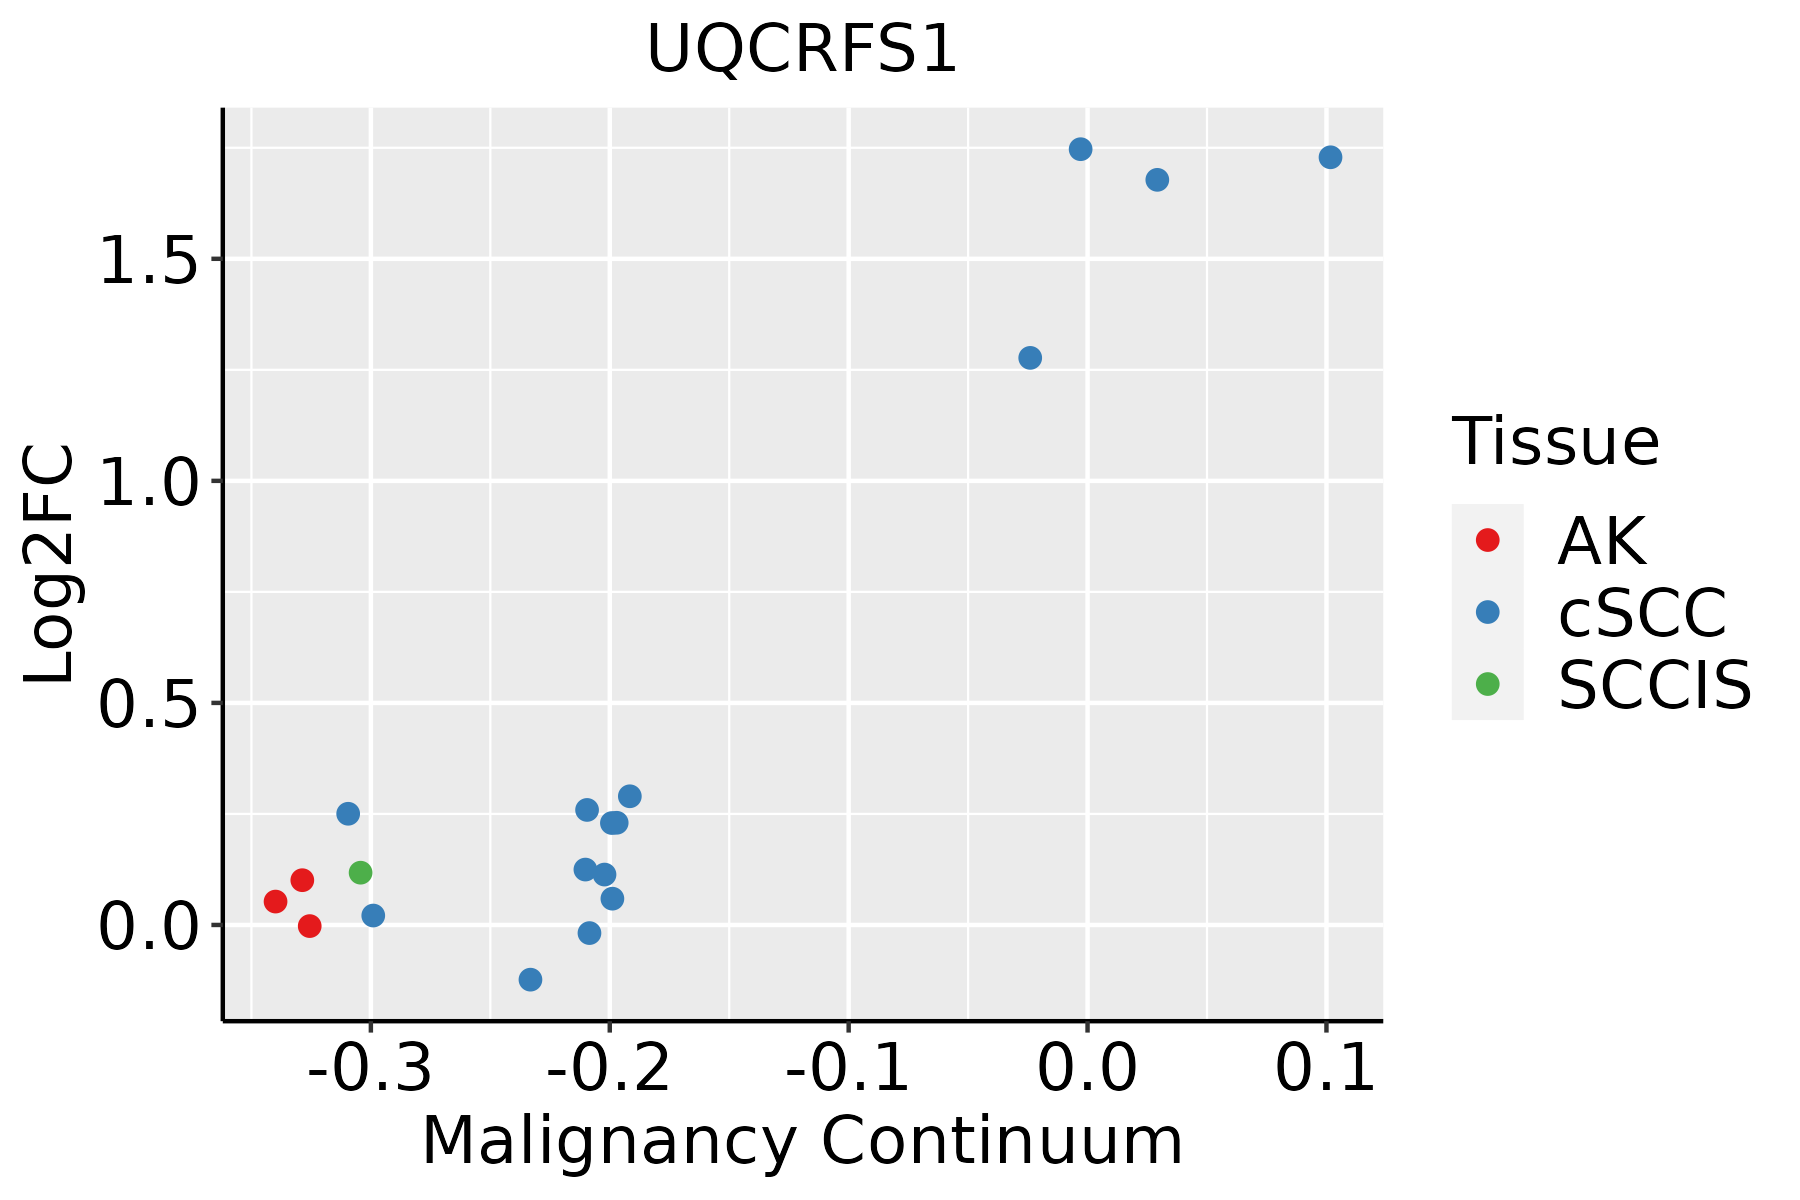 | AK: Actinic keratosis |
| cSCC: Cutaneous squamous cell carcinoma | ||
| SCCIS:squamous cell carcinoma in situ | ||
| Thyroid | 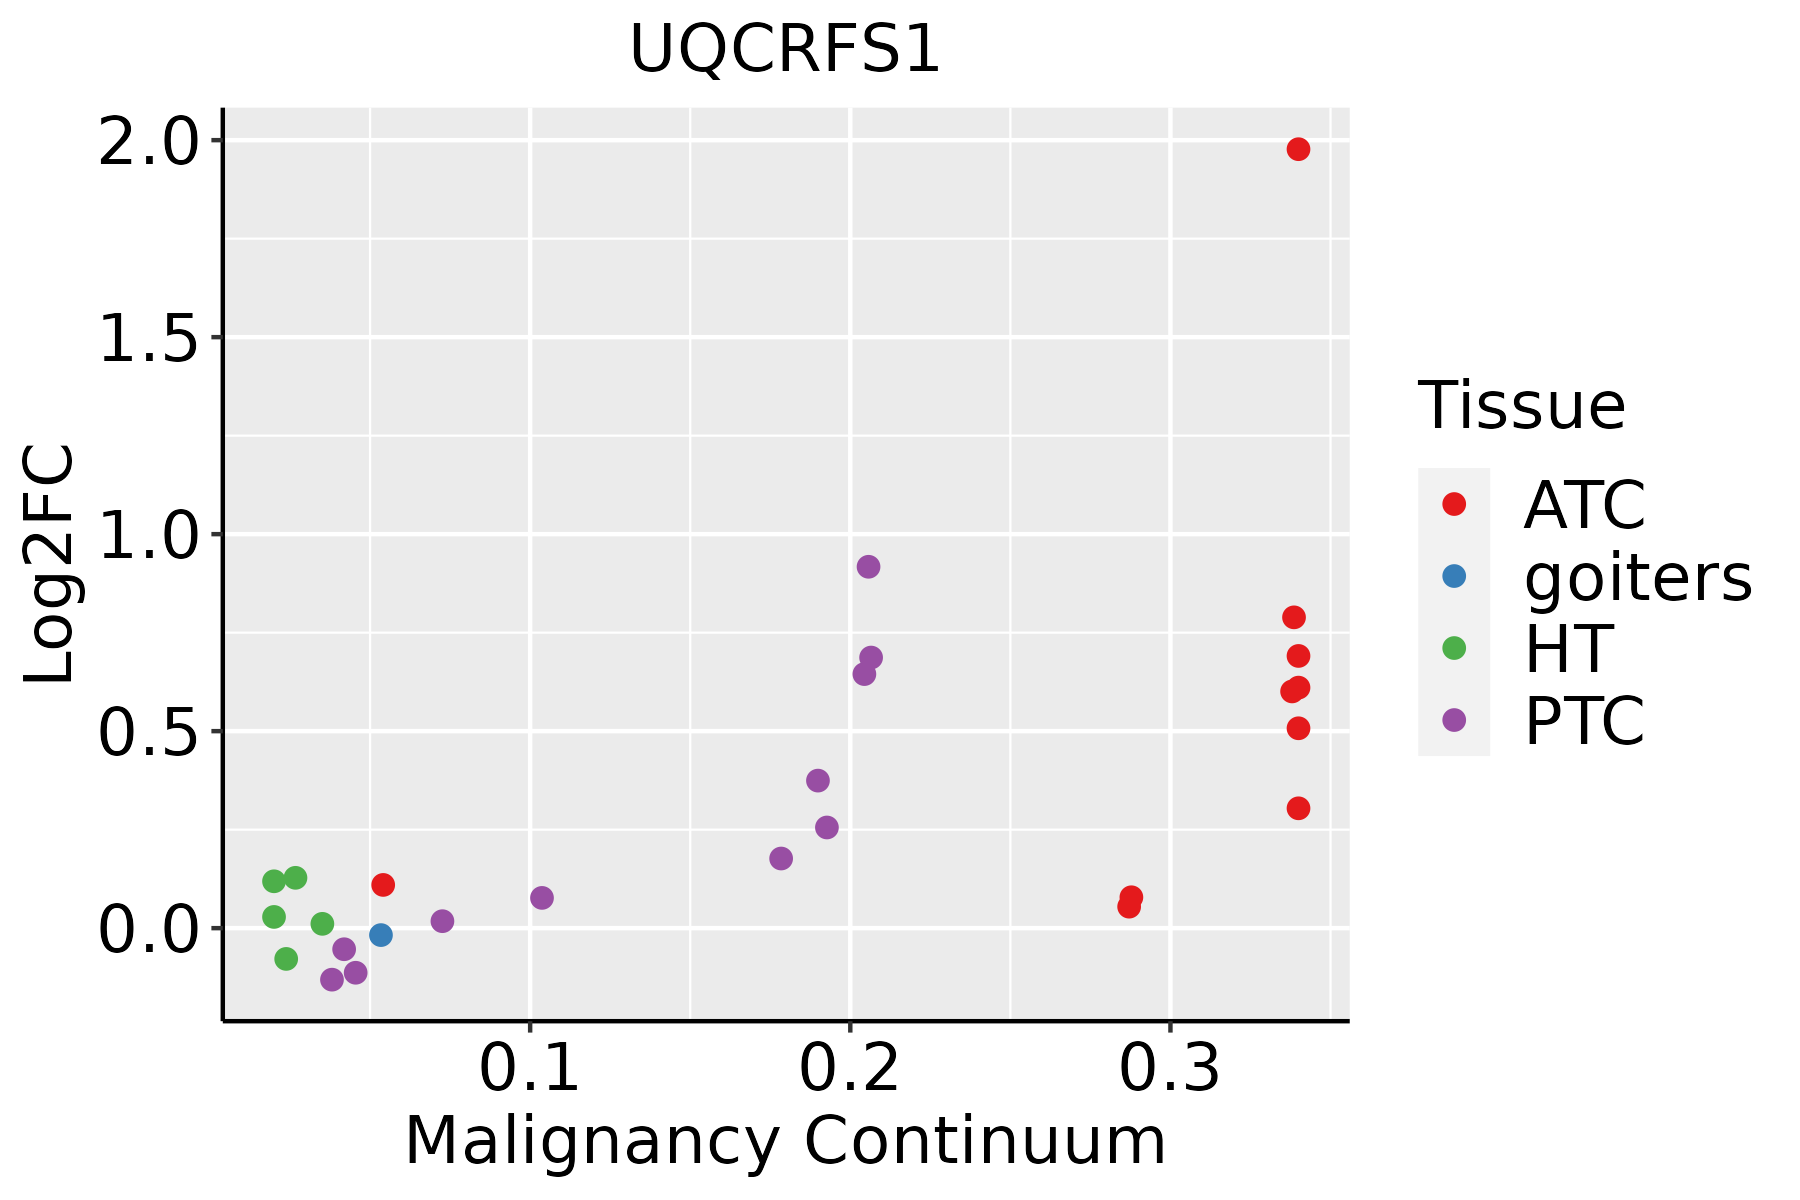 | ATC: Anaplastic thyroid cancer |
| HT: Hashimoto's thyroiditis | ||
| PTC: Papillary thyroid cancer |
| ∗log2FC in expression of this searched gene in stem-like cells from each diseased tissue sample relative to stem-like cells in normal samples in each tissue plotted against the malignancy continuum. Samples are colored based on if they are from different disease stage. |
Top |
Malignant transformation related pathway analysis |
| Find out the enriched GO biological processes and KEGG pathways involved in transition from healthy to precancer to cancer |
| Tissue | Disease Stage | Enriched GO biological Processes |
| Colorectum | AD |  |
| Colorectum | SER |  |
| Colorectum | MSS |  |
| Colorectum | MSI-H |  |
| Colorectum | FAP |  |
| ∗Top 15 enriched GO BP terms are showed in the bar plot of each disease state in each tissue. Each row represents a significant GO biological process which is colored according to the -log10(p.adjust). |
| Page: 1 2 3 4 5 6 7 8 9 |
| GO ID | Tissue | Disease Stage | Description | Gene Ratio | Bg Ratio | pvalue | p.adjust | Count |
| GO:002290022 | Liver | HCC | electron transport chain | 134/7958 | 175/18723 | 3.32e-20 | 4.68e-18 | 134 |
| GO:003310812 | Liver | HCC | mitochondrial respiratory chain complex assembly | 80/7958 | 93/18723 | 3.47e-18 | 4.15e-16 | 80 |
| GO:002290412 | Liver | HCC | respiratory electron transport chain | 89/7958 | 114/18723 | 8.68e-15 | 5.73e-13 | 89 |
| GO:00170041 | Liver | HCC | cytochrome complex assembly | 30/7958 | 36/18723 | 5.69e-07 | 9.03e-06 | 30 |
| GO:19026007 | Liver | HCC | proton transmembrane transport | 87/7958 | 157/18723 | 7.27e-04 | 4.42e-03 | 87 |
| GO:002290018 | Oral cavity | OSCC | electron transport chain | 126/7305 | 175/18723 | 6.65e-19 | 8.42e-17 | 126 |
| GO:000609118 | Oral cavity | OSCC | generation of precursor metabolites and energy | 286/7305 | 490/18723 | 1.45e-18 | 1.71e-16 | 286 |
| GO:004533318 | Oral cavity | OSCC | cellular respiration | 153/7305 | 230/18723 | 2.07e-17 | 1.87e-15 | 153 |
| GO:003310818 | Oral cavity | OSCC | mitochondrial respiratory chain complex assembly | 75/7305 | 93/18723 | 2.17e-16 | 1.68e-14 | 75 |
| GO:002290418 | Oral cavity | OSCC | respiratory electron transport chain | 86/7305 | 114/18723 | 2.43e-15 | 1.63e-13 | 86 |
| GO:001598018 | Oral cavity | OSCC | energy derivation by oxidation of organic compounds | 190/7305 | 318/18723 | 4.10e-14 | 2.26e-12 | 190 |
| GO:00170043 | Oral cavity | OSCC | cytochrome complex assembly | 31/7305 | 36/18723 | 7.28e-09 | 1.53e-07 | 31 |
| GO:002290019 | Oral cavity | LP | electron transport chain | 108/4623 | 175/18723 | 2.21e-25 | 9.90e-23 | 108 |
| GO:004533319 | Oral cavity | LP | cellular respiration | 124/4623 | 230/18723 | 1.35e-21 | 3.38e-19 | 124 |
| GO:000609119 | Oral cavity | LP | generation of precursor metabolites and energy | 214/4623 | 490/18723 | 1.12e-20 | 2.60e-18 | 214 |
| GO:002290419 | Oral cavity | LP | respiratory electron transport chain | 75/4623 | 114/18723 | 1.92e-20 | 4.14e-18 | 75 |
| GO:003310819 | Oral cavity | LP | mitochondrial respiratory chain complex assembly | 63/4623 | 93/18723 | 2.24e-18 | 4.13e-16 | 63 |
| GO:001598019 | Oral cavity | LP | energy derivation by oxidation of organic compounds | 145/4623 | 318/18723 | 2.44e-16 | 3.64e-14 | 145 |
| GO:001700412 | Oral cavity | LP | cytochrome complex assembly | 25/4623 | 36/18723 | 1.93e-08 | 7.11e-07 | 25 |
| GO:000609116 | Prostate | BPH | generation of precursor metabolites and energy | 161/3107 | 490/18723 | 3.05e-19 | 1.45e-16 | 161 |
| Page: 1 2 3 4 5 6 |
| Pathway ID | Tissue | Disease Stage | Description | Gene Ratio | Bg Ratio | pvalue | p.adjust | qvalue | Count |
| hsa05012 | Colorectum | AD | Parkinson disease | 147/2092 | 266/8465 | 2.53e-27 | 8.48e-25 | 5.41e-25 | 147 |
| hsa05208 | Colorectum | AD | Chemical carcinogenesis - reactive oxygen species | 126/2092 | 223/8465 | 1.01e-24 | 1.68e-22 | 1.07e-22 | 126 |
| hsa00190 | Colorectum | AD | Oxidative phosphorylation | 86/2092 | 134/8465 | 2.47e-22 | 2.76e-20 | 1.76e-20 | 86 |
| hsa05415 | Colorectum | AD | Diabetic cardiomyopathy | 114/2092 | 203/8465 | 3.65e-22 | 3.06e-20 | 1.95e-20 | 114 |
| hsa05010 | Colorectum | AD | Alzheimer disease | 174/2092 | 384/8465 | 1.82e-19 | 9.26e-18 | 5.91e-18 | 174 |
| hsa05016 | Colorectum | AD | Huntington disease | 147/2092 | 306/8465 | 1.93e-19 | 9.26e-18 | 5.91e-18 | 147 |
| hsa04714 | Colorectum | AD | Thermogenesis | 120/2092 | 232/8465 | 2.76e-19 | 1.16e-17 | 7.37e-18 | 120 |
| hsa04932 | Colorectum | AD | Non-alcoholic fatty liver disease | 90/2092 | 155/8465 | 4.83e-19 | 1.80e-17 | 1.15e-17 | 90 |
| hsa05020 | Colorectum | AD | Prion disease | 133/2092 | 273/8465 | 2.47e-18 | 8.29e-17 | 5.29e-17 | 133 |
| hsa05014 | Colorectum | AD | Amyotrophic lateral sclerosis | 164/2092 | 364/8465 | 4.28e-18 | 1.27e-16 | 8.09e-17 | 164 |
| hsa05022 | Colorectum | AD | Pathways of neurodegeneration - multiple diseases | 201/2092 | 476/8465 | 4.54e-18 | 1.27e-16 | 8.09e-17 | 201 |
| hsa04260 | Colorectum | AD | Cardiac muscle contraction | 32/2092 | 87/8465 | 7.92e-03 | 3.13e-02 | 2.00e-02 | 32 |
| hsa050121 | Colorectum | AD | Parkinson disease | 147/2092 | 266/8465 | 2.53e-27 | 8.48e-25 | 5.41e-25 | 147 |
| hsa052081 | Colorectum | AD | Chemical carcinogenesis - reactive oxygen species | 126/2092 | 223/8465 | 1.01e-24 | 1.68e-22 | 1.07e-22 | 126 |
| hsa001901 | Colorectum | AD | Oxidative phosphorylation | 86/2092 | 134/8465 | 2.47e-22 | 2.76e-20 | 1.76e-20 | 86 |
| hsa054151 | Colorectum | AD | Diabetic cardiomyopathy | 114/2092 | 203/8465 | 3.65e-22 | 3.06e-20 | 1.95e-20 | 114 |
| hsa050101 | Colorectum | AD | Alzheimer disease | 174/2092 | 384/8465 | 1.82e-19 | 9.26e-18 | 5.91e-18 | 174 |
| hsa050161 | Colorectum | AD | Huntington disease | 147/2092 | 306/8465 | 1.93e-19 | 9.26e-18 | 5.91e-18 | 147 |
| hsa047141 | Colorectum | AD | Thermogenesis | 120/2092 | 232/8465 | 2.76e-19 | 1.16e-17 | 7.37e-18 | 120 |
| hsa049321 | Colorectum | AD | Non-alcoholic fatty liver disease | 90/2092 | 155/8465 | 4.83e-19 | 1.80e-17 | 1.15e-17 | 90 |
| Page: 1 2 3 4 5 6 7 8 9 10 11 12 13 14 |
Top |
Cell-cell communication analysis |
| Identification of potential cell-cell interactions between two cell types and their ligand-receptor pairs for different disease states |
| Ligand | Receptor | LRpair | Pathway | Tissue | Disease Stage |
| Page: 1 |
Top |
Single-cell gene regulatory network inference analysis |
| Find out the significant the regulons (TFs) and the target genes of each regulon across cell types for different disease states |
| TF | Cell Type | Tissue | Disease Stage | Target Gene | RSS | Regulon Activity |
| ∗The dot plots of a searched regulon are shown for all cell subpopulations in each disease state of each tissue based on the regulon specific score inferred using pySCENIC and by calculating the average expression. |
| Page: 1 |
Top |
Somatic mutation of malignant transformation related genes |
| Annotation of somatic variants for genes involved in malignant transformation |
| Hugo Symbol | Variant Class | Variant Classification | dbSNP RS | HGVSc | HGVSp | HGVSp Short | SWISSPROT | BIOTYPE | SIFT | PolyPhen | Tumor Sample Barcode | Tissue | Histology | Sex | Age | Stage | Therapy Types | Drugs | Outcome |
| UQCRFS1 | SNV | Missense_Mutation | novel | c.247N>G | p.Ile83Val | p.I83V | P47985 | protein_coding | tolerated(0.45) | benign(0.009) | TCGA-A7-A4SE-01 | Breast | breast invasive carcinoma | Female | <65 | I/II | Chemotherapy | adriamycin | CR |
| UQCRFS1 | SNV | Missense_Mutation | novel | c.536N>T | p.Arg179Ile | p.R179I | P47985 | protein_coding | deleterious(0) | probably_damaging(1) | TCGA-AN-A046-01 | Breast | breast invasive carcinoma | Female | >=65 | I/II | Unknown | Unknown | SD |
| UQCRFS1 | insertion | Nonsense_Mutation | novel | c.643_644insTGATGACACTTTGA | p.Gly215ValfsTer5 | p.G215Vfs*5 | P47985 | protein_coding | TCGA-BH-A0EE-01 | Breast | breast invasive carcinoma | Female | >=65 | I/II | Chemotherapy | docetaxel | SD | ||
| UQCRFS1 | SNV | Missense_Mutation | novel | c.247N>G | p.Ile83Val | p.I83V | P47985 | protein_coding | tolerated(0.45) | benign(0.009) | TCGA-EA-A1QS-01 | Cervix | cervical & endocervical cancer | Female | <65 | I/II | Unknown | Unknown | SD |
| UQCRFS1 | SNV | Missense_Mutation | novel | c.324G>T | p.Glu108Asp | p.E108D | P47985 | protein_coding | tolerated(0.74) | benign(0) | TCGA-VS-A9UL-01 | Cervix | cervical & endocervical cancer | Female | >=65 | III/IV | Unknown | Unknown | PD |
| UQCRFS1 | SNV | Missense_Mutation | rs201777347 | c.530N>A | p.Arg177His | p.R177H | P47985 | protein_coding | deleterious(0.02) | probably_damaging(0.999) | TCGA-A6-3809-01 | Colorectum | colon adenocarcinoma | Female | >=65 | I/II | Unknown | Unknown | SD |
| UQCRFS1 | SNV | Missense_Mutation | c.815T>C | p.Ile272Thr | p.I272T | P47985 | protein_coding | deleterious(0) | benign(0.022) | TCGA-AA-A010-01 | Colorectum | colon adenocarcinoma | Female | <65 | I/II | Chemotherapy | folinic | CR | |
| UQCRFS1 | SNV | Missense_Mutation | c.457N>A | p.Glu153Lys | p.E153K | P47985 | protein_coding | deleterious(0) | possibly_damaging(0.833) | TCGA-AZ-4315-01 | Colorectum | colon adenocarcinoma | Male | <65 | I/II | Unknown | Unknown | SD | |
| UQCRFS1 | SNV | Missense_Mutation | novel | c.247N>G | p.Ile83Val | p.I83V | P47985 | protein_coding | tolerated(0.45) | benign(0.009) | TCGA-G4-6302-01 | Colorectum | colon adenocarcinoma | Female | >=65 | I/II | Unknown | Unknown | SD |
| UQCRFS1 | SNV | Missense_Mutation | novel | c.805N>A | p.Asp269Asn | p.D269N | P47985 | protein_coding | tolerated(0.33) | benign(0.001) | TCGA-AG-A002-01 | Colorectum | rectum adenocarcinoma | Male | <65 | I/II | Unknown | Unknown | SD |
| Page: 1 2 3 4 |
Top |
Related drugs of malignant transformation related genes |
| Identification of chemicals and drugs interact with genes involved in malignant transfromation |
| (DGIdb 4.0) |
| Entrez ID | Symbol | Category | Interaction Types | Drug Claim Name | Drug Name | PMIDs |
| Page: 1 |

Copyright 2023-Present -The University of Texas Health Science Center at Houston |