
|
|||||
|
 | |
| |
| |
| |
| |
| |
|
Gene: UGP2 |
Gene summary for UGP2 |
| Gene information | Species | Human | Gene symbol | UGP2 | Gene ID | 7360 |
| Gene name | UDP-glucose pyrophosphorylase 2 | |
| Gene Alias | DEE83 | |
| Cytomap | 2p15 | |
| Gene Type | protein-coding | GO ID | GO:0000271 | UniProtAcc | A0A140VKE1 |
Top |
Malignant transformation analysis |
| Identification of the aberrant gene expression in precancerous and cancerous lesions by comparing the gene expression of stem-like cells in diseased tissues with normal stem cells |
| Entrez ID | Symbol | Replicates | Species | Organ | Tissue | Adj P-value | Log2FC | Malignancy |
| 7360 | UGP2 | HTA11_3410_2000001011 | Human | Colorectum | AD | 1.34e-12 | -5.89e-01 | 0.0155 |
| 7360 | UGP2 | HTA11_347_2000001011 | Human | Colorectum | AD | 3.86e-06 | 4.22e-01 | -0.1954 |
| 7360 | UGP2 | HTA11_866_3004761011 | Human | Colorectum | AD | 7.44e-08 | -5.47e-01 | 0.096 |
| 7360 | UGP2 | HTA11_10711_2000001011 | Human | Colorectum | AD | 7.13e-04 | -5.20e-01 | 0.0338 |
| 7360 | UGP2 | HTA11_7696_3000711011 | Human | Colorectum | AD | 4.84e-11 | -4.89e-01 | 0.0674 |
| 7360 | UGP2 | HTA11_99999970781_79442 | Human | Colorectum | MSS | 9.02e-05 | -4.08e-01 | 0.294 |
| 7360 | UGP2 | HTA11_99999971662_82457 | Human | Colorectum | MSS | 7.14e-11 | -4.95e-01 | 0.3859 |
| 7360 | UGP2 | HTA11_99999973899_84307 | Human | Colorectum | MSS | 4.00e-05 | -6.33e-01 | 0.2585 |
| 7360 | UGP2 | HTA11_99999974143_84620 | Human | Colorectum | MSS | 1.59e-12 | -5.23e-01 | 0.3005 |
| 7360 | UGP2 | F007 | Human | Colorectum | FAP | 1.62e-05 | -4.60e-01 | 0.1176 |
| 7360 | UGP2 | A002-C-010 | Human | Colorectum | FAP | 9.59e-10 | -3.83e-01 | 0.242 |
| 7360 | UGP2 | A001-C-207 | Human | Colorectum | FAP | 6.65e-07 | -3.88e-01 | 0.1278 |
| 7360 | UGP2 | A015-C-203 | Human | Colorectum | FAP | 5.52e-26 | -5.32e-01 | -0.1294 |
| 7360 | UGP2 | A015-C-204 | Human | Colorectum | FAP | 1.59e-05 | -3.39e-01 | -0.0228 |
| 7360 | UGP2 | A014-C-040 | Human | Colorectum | FAP | 2.93e-02 | -4.08e-01 | -0.1184 |
| 7360 | UGP2 | A002-C-201 | Human | Colorectum | FAP | 3.08e-15 | -4.78e-01 | 0.0324 |
| 7360 | UGP2 | A002-C-203 | Human | Colorectum | FAP | 3.82e-06 | -3.72e-01 | 0.2786 |
| 7360 | UGP2 | A001-C-119 | Human | Colorectum | FAP | 1.35e-10 | -5.56e-01 | -0.1557 |
| 7360 | UGP2 | A001-C-108 | Human | Colorectum | FAP | 8.68e-18 | -4.67e-01 | -0.0272 |
| 7360 | UGP2 | A002-C-205 | Human | Colorectum | FAP | 8.35e-22 | -5.81e-01 | -0.1236 |
| Page: 1 2 3 4 5 6 7 8 9 |
| Tissue | Expression Dynamics | Abbreviation |
| Colorectum (GSE201348) | 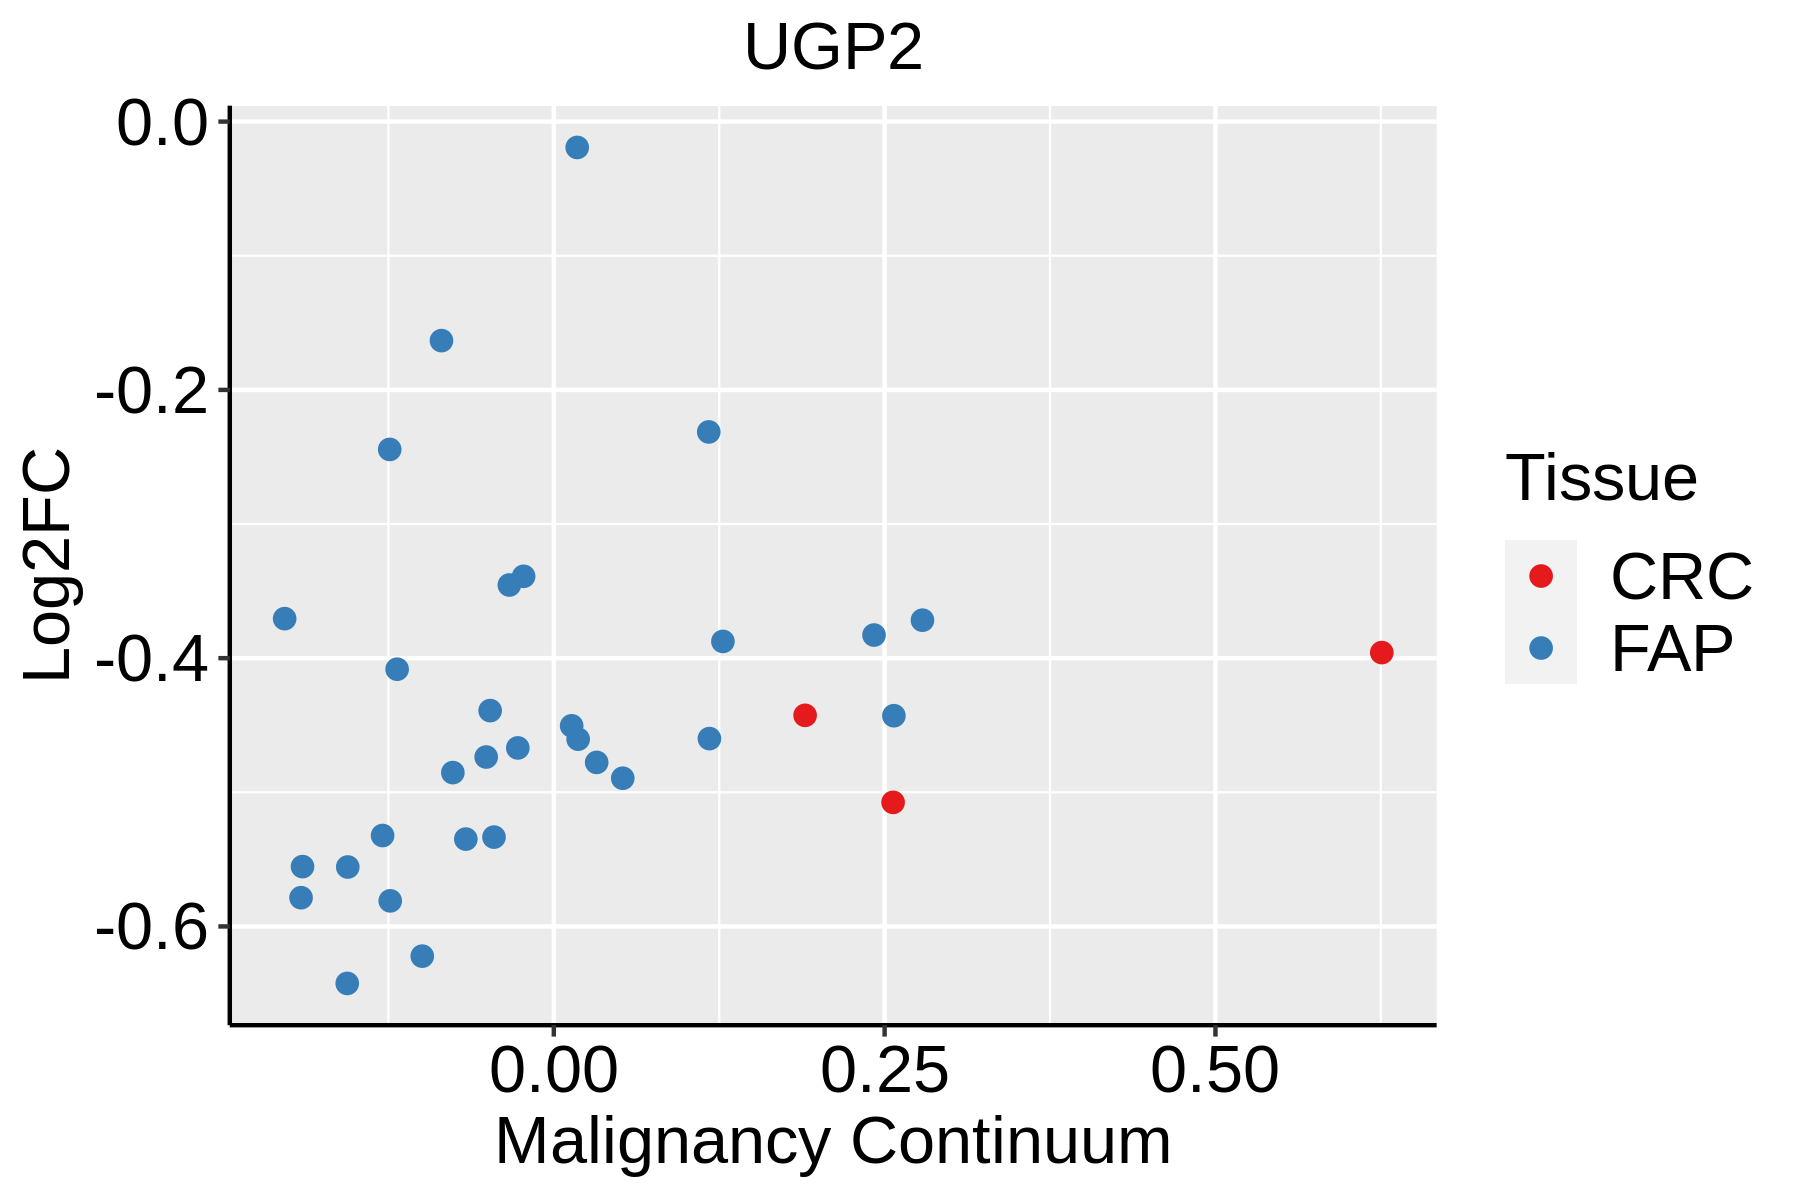 | FAP: Familial adenomatous polyposis |
| CRC: Colorectal cancer | ||
| Colorectum (HTA11) |  | AD: Adenomas |
| SER: Sessile serrated lesions | ||
| MSI-H: Microsatellite-high colorectal cancer | ||
| MSS: Microsatellite stable colorectal cancer | ||
| Esophagus | 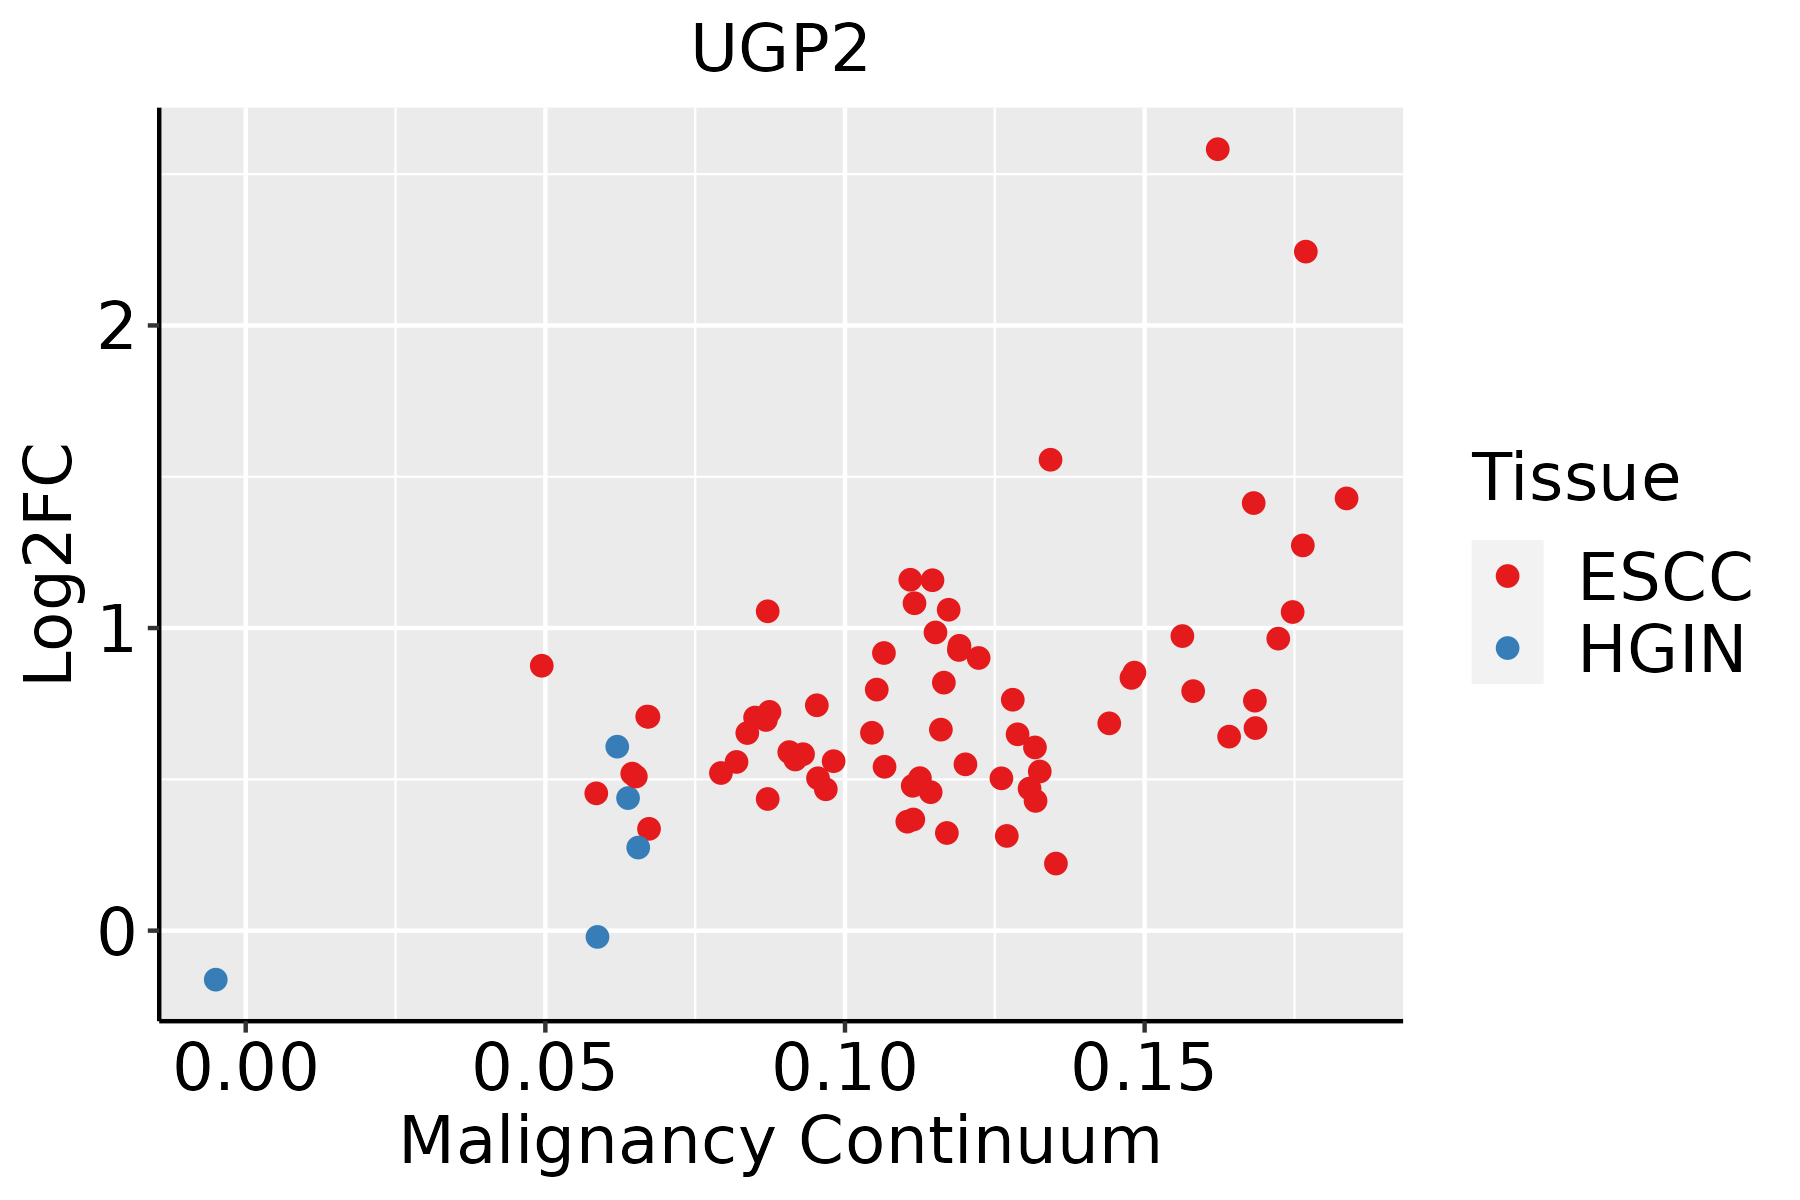 | ESCC: Esophageal squamous cell carcinoma |
| HGIN: High-grade intraepithelial neoplasias | ||
| LGIN: Low-grade intraepithelial neoplasias | ||
| Liver | 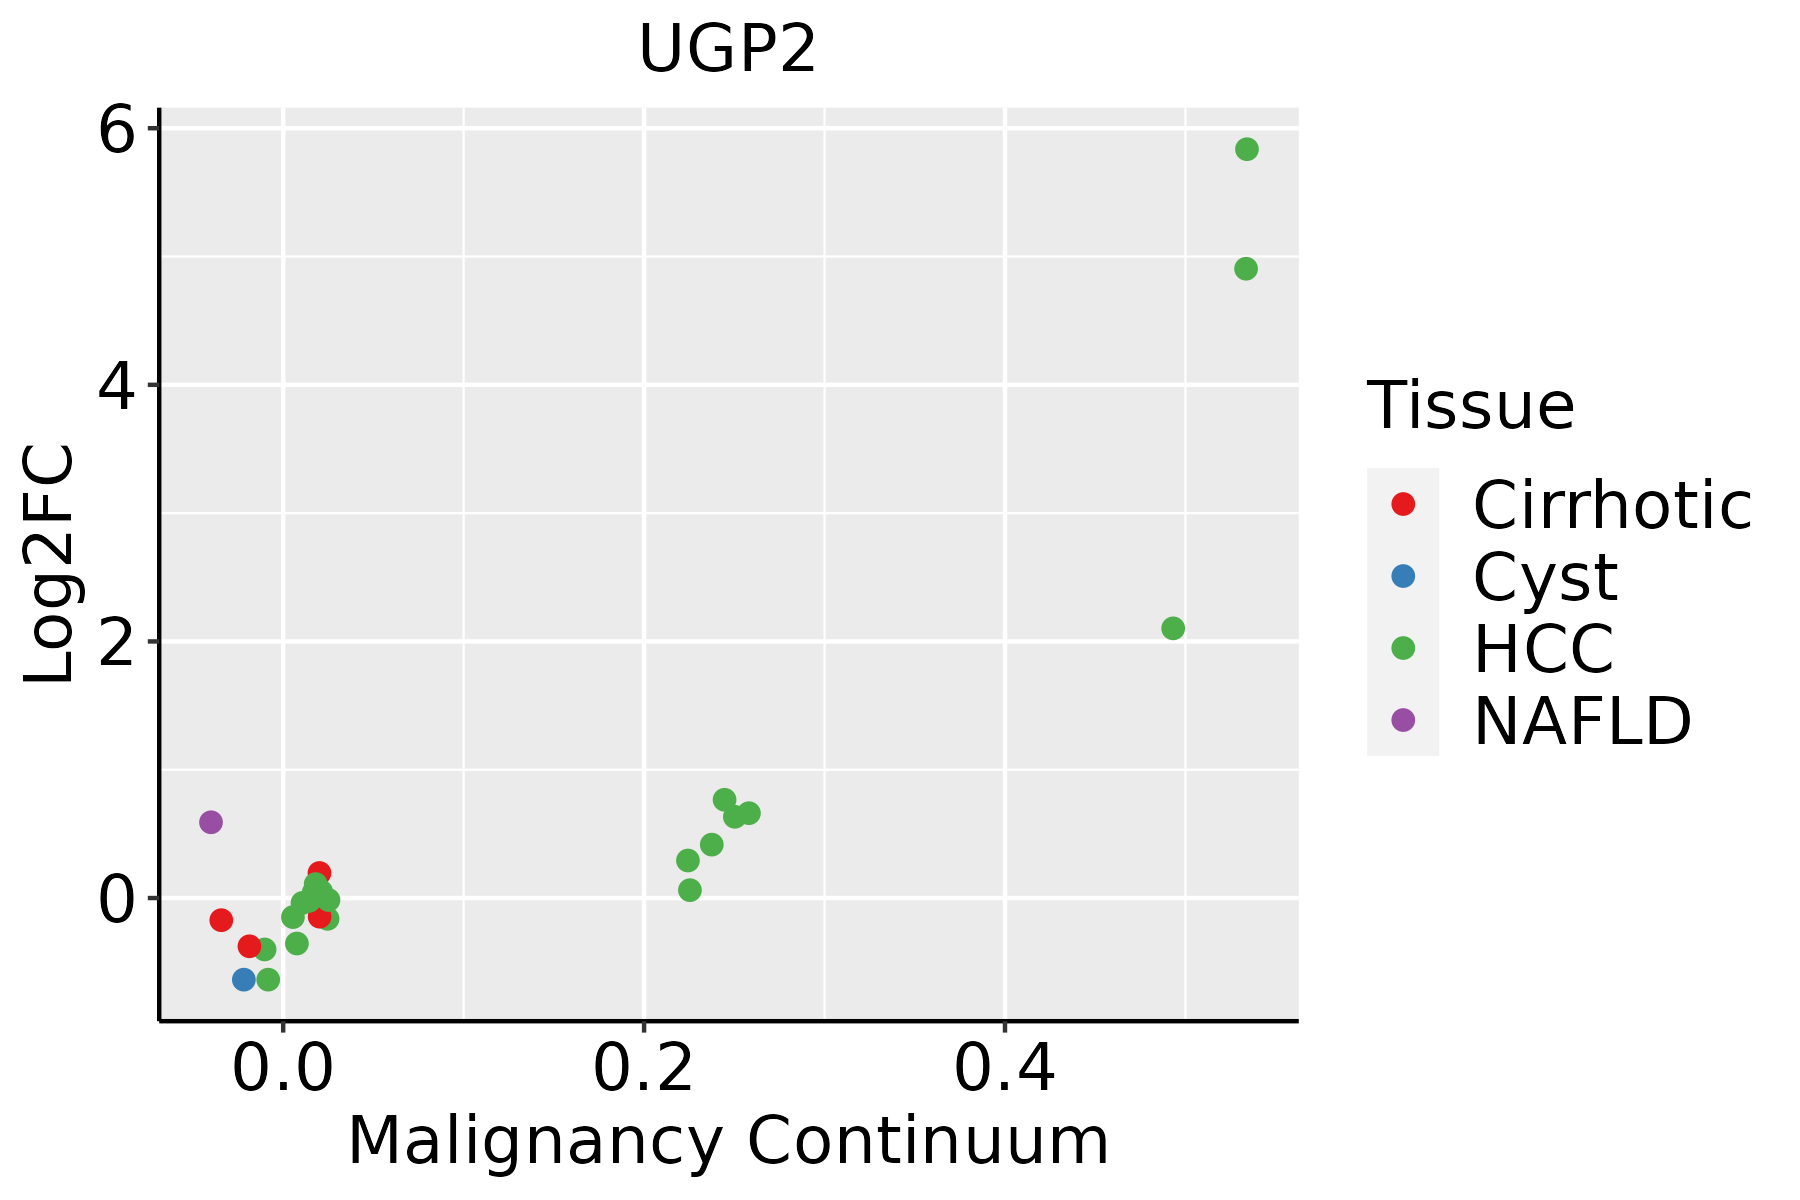 | HCC: Hepatocellular carcinoma |
| NAFLD: Non-alcoholic fatty liver disease | ||
| Oral Cavity |  | EOLP: Erosive Oral lichen planus |
| LP: leukoplakia | ||
| NEOLP: Non-erosive oral lichen planus | ||
| OSCC: Oral squamous cell carcinoma | ||
| Skin | 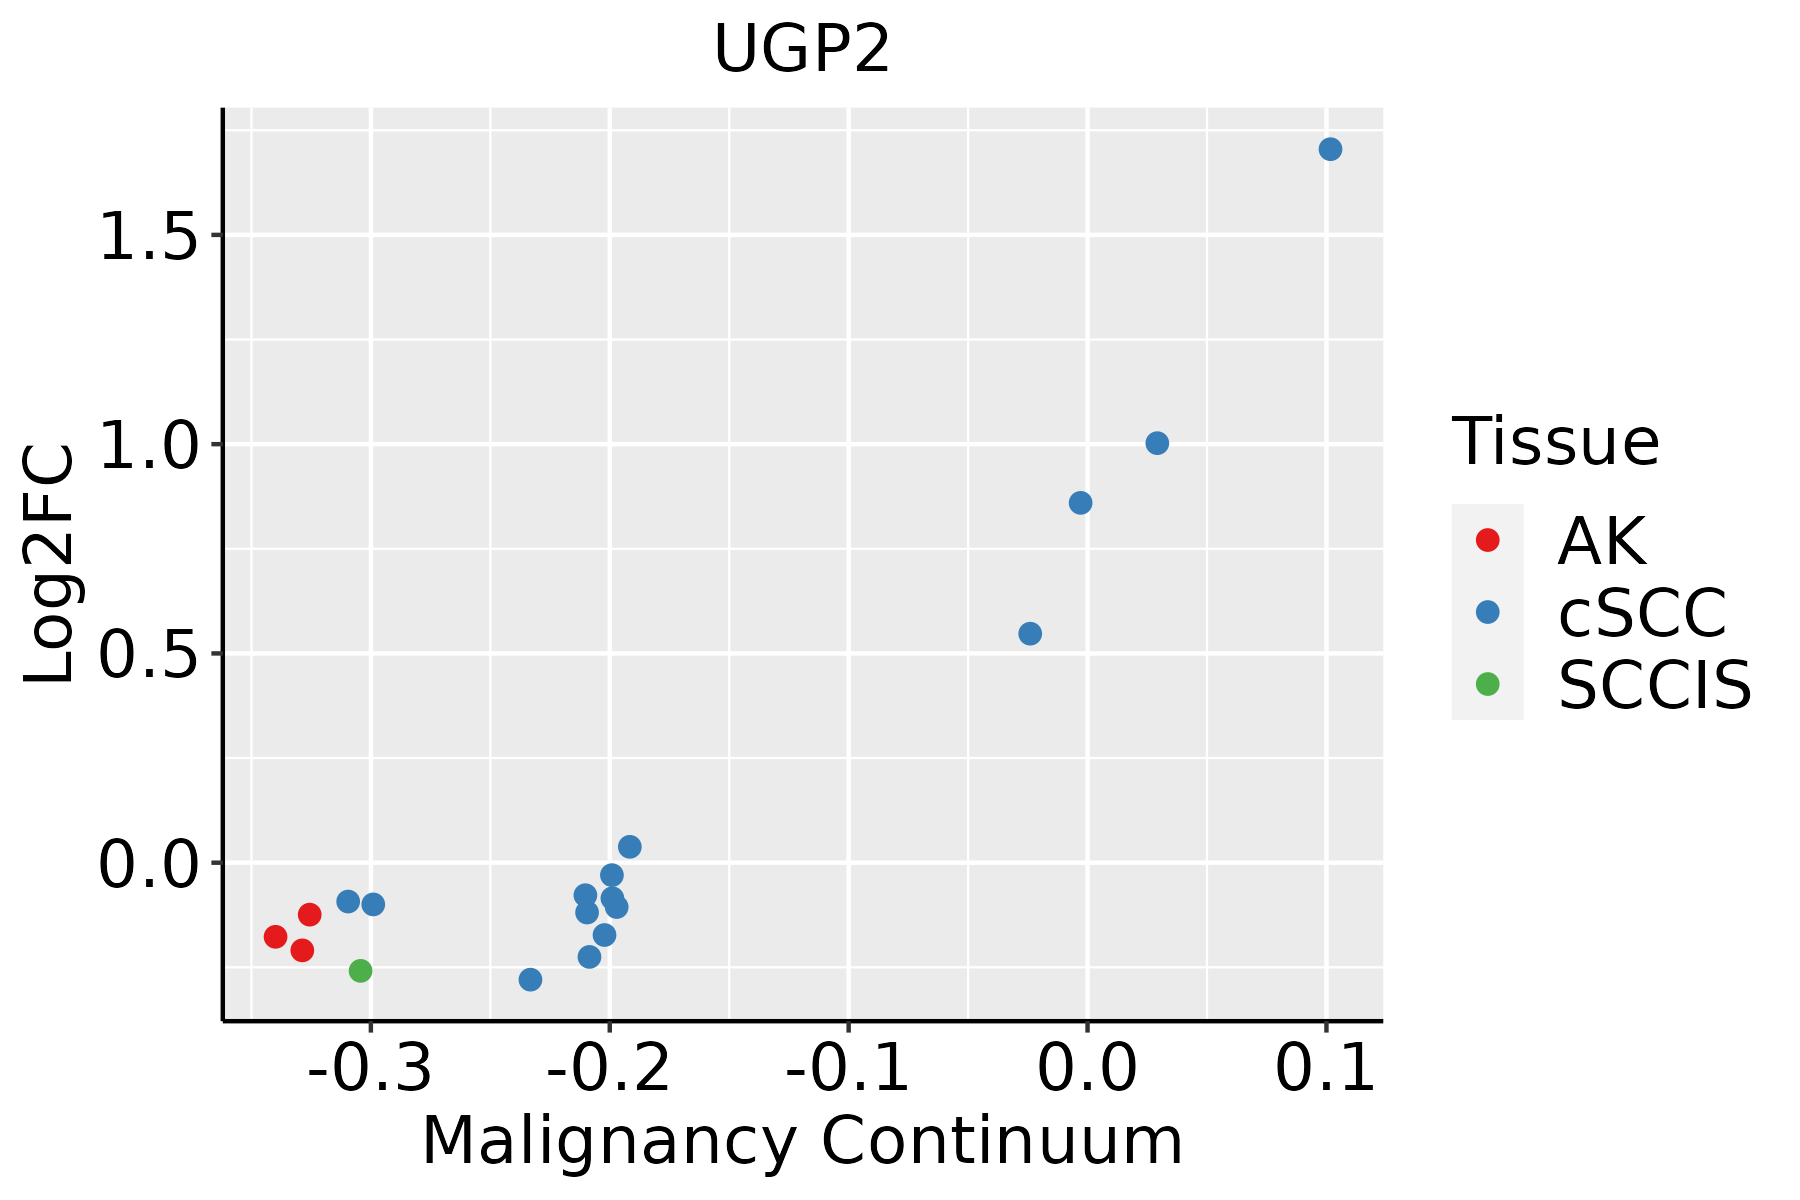 | AK: Actinic keratosis |
| cSCC: Cutaneous squamous cell carcinoma | ||
| SCCIS:squamous cell carcinoma in situ | ||
| Thyroid | 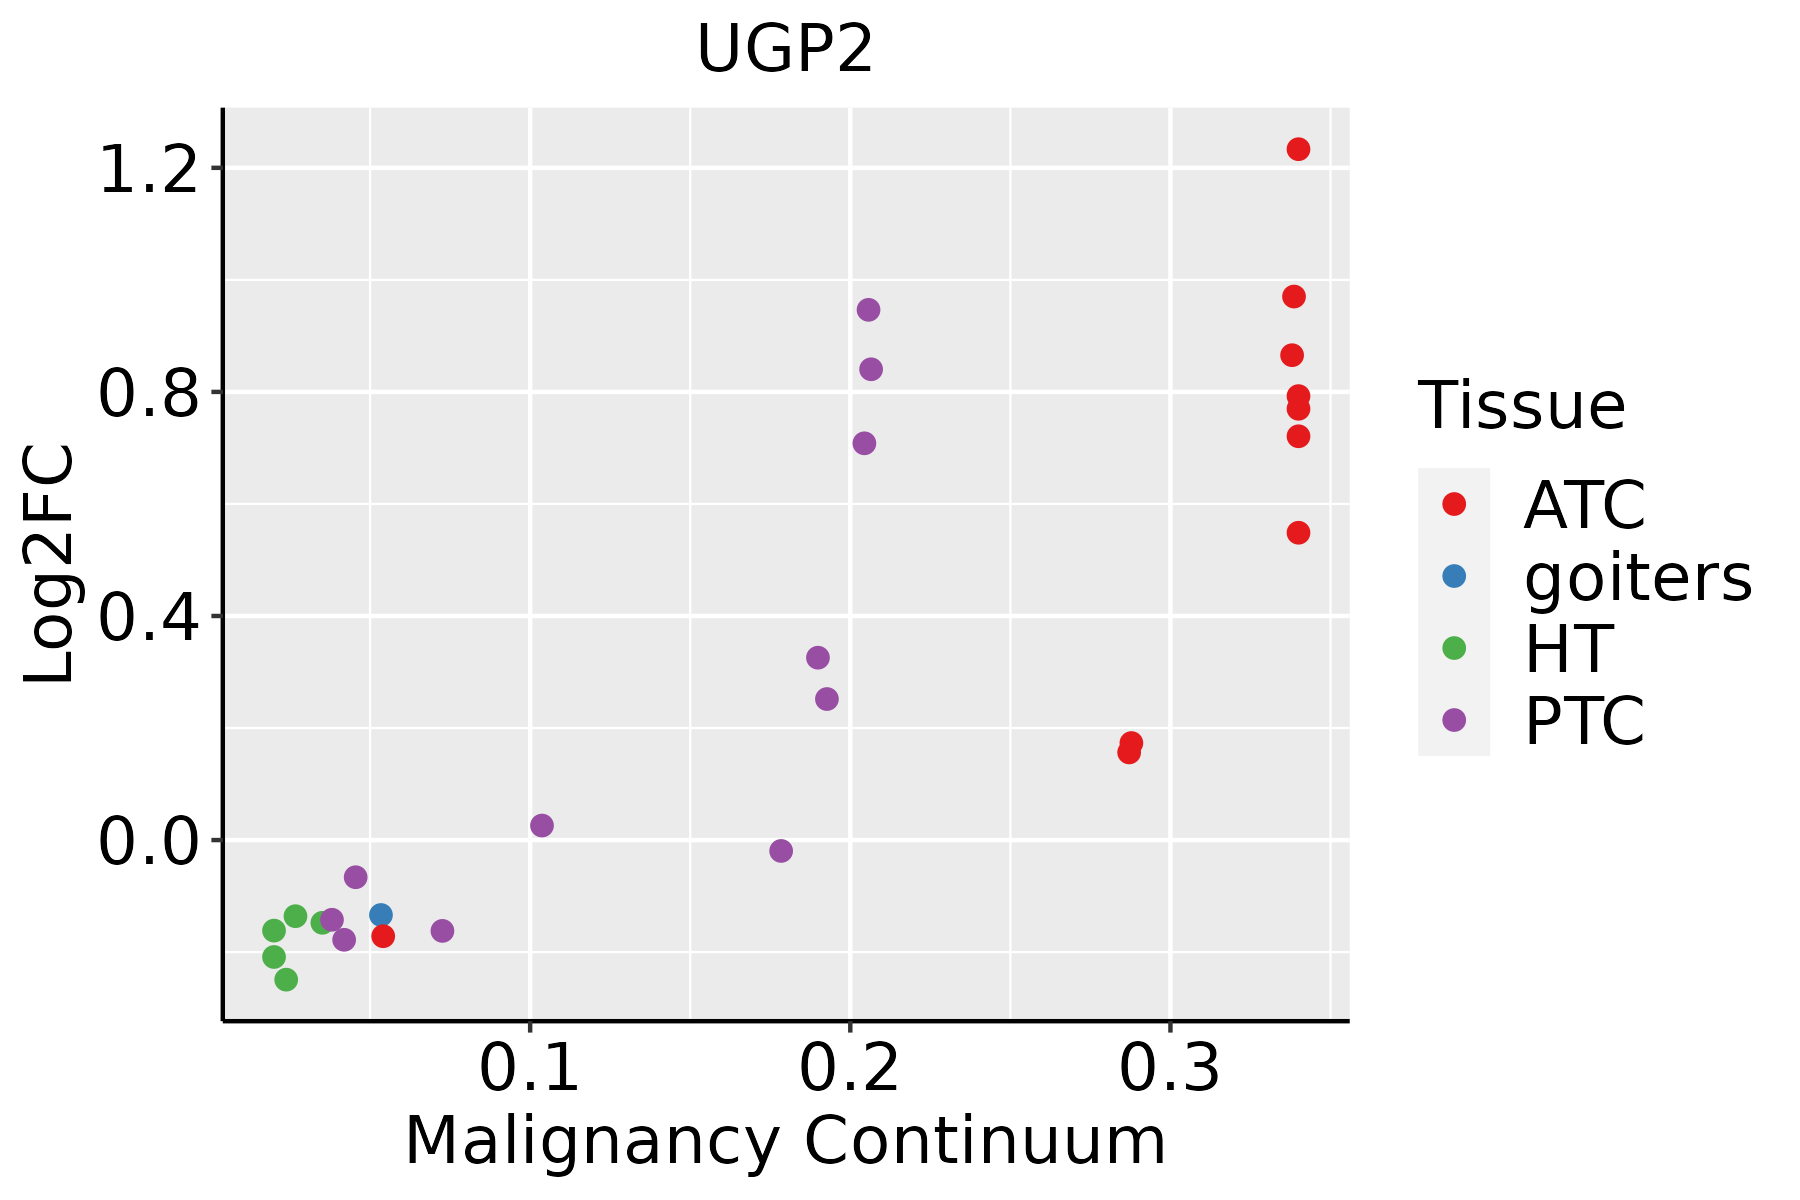 | ATC: Anaplastic thyroid cancer |
| HT: Hashimoto's thyroiditis | ||
| PTC: Papillary thyroid cancer |
| ∗log2FC in expression of this searched gene in stem-like cells from each diseased tissue sample relative to stem-like cells in normal samples in each tissue plotted against the malignancy continuum. Samples are colored based on if they are from different disease stage. |
Top |
Malignant transformation related pathway analysis |
| Find out the enriched GO biological processes and KEGG pathways involved in transition from healthy to precancer to cancer |
| Tissue | Disease Stage | Enriched GO biological Processes |
| Colorectum | AD |  |
| Colorectum | SER |  |
| Colorectum | MSS |  |
| Colorectum | MSI-H |  |
| Colorectum | FAP |  |
| ∗Top 15 enriched GO BP terms are showed in the bar plot of each disease state in each tissue. Each row represents a significant GO biological process which is colored according to the -log10(p.adjust). |
| Page: 1 2 3 4 5 6 7 8 9 |
| GO ID | Tissue | Disease Stage | Description | Gene Ratio | Bg Ratio | pvalue | p.adjust | Count |
| GO:00442641 | Liver | HCC | cellular polysaccharide metabolic process | 52/7958 | 96/18723 | 1.38e-02 | 4.91e-02 | 52 |
| GO:001598032 | Liver | Cyst | energy derivation by oxidation of organic compounds | 33/496 | 318/18723 | 2.36e-11 | 6.71e-09 | 33 |
| GO:000609132 | Liver | Cyst | generation of precursor metabolites and energy | 40/496 | 490/18723 | 3.01e-10 | 6.43e-08 | 40 |
| GO:000838020 | Oral cavity | OSCC | RNA splicing | 308/7305 | 434/18723 | 2.43e-42 | 7.70e-39 | 308 |
| GO:000609118 | Oral cavity | OSCC | generation of precursor metabolites and energy | 286/7305 | 490/18723 | 1.45e-18 | 1.71e-16 | 286 |
| GO:001598018 | Oral cavity | OSCC | energy derivation by oxidation of organic compounds | 190/7305 | 318/18723 | 4.10e-14 | 2.26e-12 | 190 |
| GO:00092255 | Oral cavity | OSCC | nucleotide-sugar metabolic process | 26/7305 | 36/18723 | 5.44e-05 | 4.51e-04 | 26 |
| GO:00160513 | Oral cavity | OSCC | carbohydrate biosynthetic process | 97/7305 | 202/18723 | 5.50e-03 | 2.13e-02 | 97 |
| GO:00442625 | Oral cavity | OSCC | cellular carbohydrate metabolic process | 130/7305 | 283/18723 | 9.98e-03 | 3.49e-02 | 130 |
| GO:000609119 | Oral cavity | LP | generation of precursor metabolites and energy | 214/4623 | 490/18723 | 1.12e-20 | 2.60e-18 | 214 |
| GO:001598019 | Oral cavity | LP | energy derivation by oxidation of organic compounds | 145/4623 | 318/18723 | 2.44e-16 | 3.64e-14 | 145 |
| GO:000838025 | Oral cavity | EOLP | RNA splicing | 115/2218 | 434/18723 | 2.24e-17 | 3.04e-14 | 115 |
| GO:0006091111 | Skin | cSCC | generation of precursor metabolites and energy | 224/4864 | 490/18723 | 1.13e-21 | 2.21e-19 | 224 |
| GO:001598026 | Skin | cSCC | energy derivation by oxidation of organic compounds | 154/4864 | 318/18723 | 4.19e-18 | 5.15e-16 | 154 |
| GO:0008380113 | Thyroid | PTC | RNA splicing | 273/5968 | 434/18723 | 4.44e-41 | 1.40e-37 | 273 |
| GO:0006091112 | Thyroid | PTC | generation of precursor metabolites and energy | 252/5968 | 490/18723 | 8.24e-20 | 1.13e-17 | 252 |
| GO:0015980111 | Thyroid | PTC | energy derivation by oxidation of organic compounds | 176/5968 | 318/18723 | 2.67e-18 | 2.90e-16 | 176 |
| GO:00092257 | Thyroid | PTC | nucleotide-sugar metabolic process | 23/5968 | 36/18723 | 7.78e-05 | 6.66e-04 | 23 |
| GO:000838034 | Thyroid | ATC | RNA splicing | 270/6293 | 434/18723 | 7.50e-35 | 1.19e-31 | 270 |
| GO:000609134 | Thyroid | ATC | generation of precursor metabolites and energy | 256/6293 | 490/18723 | 6.55e-18 | 7.69e-16 | 256 |
| Page: 1 2 3 4 5 |
| Pathway ID | Tissue | Disease Stage | Description | Gene Ratio | Bg Ratio | pvalue | p.adjust | qvalue | Count |
| hsa00052 | Colorectum | FAP | Galactose metabolism | 12/1404 | 32/8465 | 3.61e-03 | 1.53e-02 | 9.29e-03 | 12 |
| hsa01250 | Colorectum | FAP | Biosynthesis of nucleotide sugars | 13/1404 | 37/8465 | 4.79e-03 | 1.91e-02 | 1.16e-02 | 13 |
| hsa000521 | Colorectum | FAP | Galactose metabolism | 12/1404 | 32/8465 | 3.61e-03 | 1.53e-02 | 9.29e-03 | 12 |
| hsa012501 | Colorectum | FAP | Biosynthesis of nucleotide sugars | 13/1404 | 37/8465 | 4.79e-03 | 1.91e-02 | 1.16e-02 | 13 |
| hsa012502 | Colorectum | CRC | Biosynthesis of nucleotide sugars | 12/1091 | 37/8465 | 1.66e-03 | 1.20e-02 | 8.16e-03 | 12 |
| hsa012503 | Colorectum | CRC | Biosynthesis of nucleotide sugars | 12/1091 | 37/8465 | 1.66e-03 | 1.20e-02 | 8.16e-03 | 12 |
| hsa012405 | Esophagus | ESCC | Biosynthesis of cofactors | 97/4205 | 153/8465 | 3.88e-04 | 1.35e-03 | 6.94e-04 | 97 |
| hsa012505 | Esophagus | ESCC | Biosynthesis of nucleotide sugars | 28/4205 | 37/8465 | 1.10e-03 | 3.42e-03 | 1.75e-03 | 28 |
| hsa005202 | Esophagus | ESCC | Amino sugar and nucleotide sugar metabolism | 35/4205 | 49/8465 | 1.60e-03 | 4.88e-03 | 2.50e-03 | 35 |
| hsa0124012 | Esophagus | ESCC | Biosynthesis of cofactors | 97/4205 | 153/8465 | 3.88e-04 | 1.35e-03 | 6.94e-04 | 97 |
| hsa0125012 | Esophagus | ESCC | Biosynthesis of nucleotide sugars | 28/4205 | 37/8465 | 1.10e-03 | 3.42e-03 | 1.75e-03 | 28 |
| hsa0052011 | Esophagus | ESCC | Amino sugar and nucleotide sugar metabolism | 35/4205 | 49/8465 | 1.60e-03 | 4.88e-03 | 2.50e-03 | 35 |
| hsa01240 | Liver | Cirrhotic | Biosynthesis of cofactors | 66/2530 | 153/8465 | 3.11e-04 | 1.99e-03 | 1.23e-03 | 66 |
| hsa012401 | Liver | Cirrhotic | Biosynthesis of cofactors | 66/2530 | 153/8465 | 3.11e-04 | 1.99e-03 | 1.23e-03 | 66 |
| hsa012402 | Liver | HCC | Biosynthesis of cofactors | 103/4020 | 153/8465 | 4.67e-07 | 5.05e-06 | 2.81e-06 | 103 |
| hsa012403 | Liver | HCC | Biosynthesis of cofactors | 103/4020 | 153/8465 | 4.67e-07 | 5.05e-06 | 2.81e-06 | 103 |
| hsa00520 | Oral cavity | OSCC | Amino sugar and nucleotide sugar metabolism | 34/3704 | 49/8465 | 2.48e-04 | 8.08e-04 | 4.11e-04 | 34 |
| hsa012404 | Oral cavity | OSCC | Biosynthesis of cofactors | 88/3704 | 153/8465 | 3.84e-04 | 1.20e-03 | 6.12e-04 | 88 |
| hsa012504 | Oral cavity | OSCC | Biosynthesis of nucleotide sugars | 25/3704 | 37/8465 | 2.93e-03 | 7.49e-03 | 3.81e-03 | 25 |
| hsa005201 | Oral cavity | OSCC | Amino sugar and nucleotide sugar metabolism | 34/3704 | 49/8465 | 2.48e-04 | 8.08e-04 | 4.11e-04 | 34 |
| Page: 1 2 |
Top |
Cell-cell communication analysis |
| Identification of potential cell-cell interactions between two cell types and their ligand-receptor pairs for different disease states |
| Ligand | Receptor | LRpair | Pathway | Tissue | Disease Stage |
| Page: 1 |
Top |
Single-cell gene regulatory network inference analysis |
| Find out the significant the regulons (TFs) and the target genes of each regulon across cell types for different disease states |
| TF | Cell Type | Tissue | Disease Stage | Target Gene | RSS | Regulon Activity |
| UGP2 | MAIT | Liver | Cirrhotic | LILRA2,CD36,NUPR1, etc. | 1.43e-02 |  |
| UGP2 | CD8TN | Liver | HCC | LILRA2,CD36,NUPR1, etc. | 0.00e+00 |  |
| UGP2 | CD8TCM | Liver | Healthy | LILRA2,CD36,NUPR1, etc. | 6.94e-03 |  |
| UGP2 | MAIT | Liver | Healthy | LILRA2,CD36,NUPR1, etc. | 8.23e-03 | |
| UGP2 | MON | Liver | Healthy | LILRA2,CD36,NUPR1, etc. | 8.74e-03 | |
| UGP2 | BN | Liver | NAFLD | LILRA2,CD36,NUPR1, etc. | 6.85e-02 |  |
| ∗The dot plots of a searched regulon are shown for all cell subpopulations in each disease state of each tissue based on the regulon specific score inferred using pySCENIC and by calculating the average expression. |
| Page: 1 |
Top |
Somatic mutation of malignant transformation related genes |
| Annotation of somatic variants for genes involved in malignant transformation |
| Hugo Symbol | Variant Class | Variant Classification | dbSNP RS | HGVSc | HGVSp | HGVSp Short | SWISSPROT | BIOTYPE | SIFT | PolyPhen | Tumor Sample Barcode | Tissue | Histology | Sex | Age | Stage | Therapy Types | Drugs | Outcome |
| UGP2 | SNV | Missense_Mutation | c.925N>G | p.Gln309Glu | p.Q309E | Q16851 | protein_coding | deleterious(0) | possibly_damaging(0.746) | TCGA-AC-A23H-01 | Breast | breast invasive carcinoma | Female | >=65 | I/II | Unknown | Unknown | PD | |
| UGP2 | SNV | Missense_Mutation | c.1387N>T | p.Asp463Tyr | p.D463Y | Q16851 | protein_coding | deleterious(0) | probably_damaging(0.998) | TCGA-AR-A24U-01 | Breast | breast invasive carcinoma | Female | <65 | I/II | Chemotherapy | doxorubicin | SD | |
| UGP2 | SNV | Missense_Mutation | c.1177C>A | p.Leu393Met | p.L393M | Q16851 | protein_coding | deleterious(0) | probably_damaging(0.999) | TCGA-BH-A0H5-01 | Breast | breast invasive carcinoma | Female | <65 | I/II | Chemotherapy | cytoxan | CR | |
| UGP2 | SNV | Missense_Mutation | c.170N>A | p.Gly57Glu | p.G57E | Q16851 | protein_coding | tolerated(0.12) | possibly_damaging(0.865) | TCGA-C8-A26Y-01 | Breast | breast invasive carcinoma | Female | >=65 | I/II | Unknown | Unknown | SD | |
| UGP2 | insertion | Frame_Shift_Ins | novel | c.493_494insA | p.Phe165TyrfsTer2 | p.F165Yfs*2 | Q16851 | protein_coding | TCGA-A8-A0A4-01 | Breast | breast invasive carcinoma | Female | >=65 | I/II | Hormone Therapy | tamoxiphen | CR | ||
| UGP2 | insertion | Frame_Shift_Ins | novel | c.495_496insTTTTCCATCTCCTTATCCTATTGCCTAGTATGGTGCTGGC | p.Asn166PhefsTer17 | p.N166Ffs*17 | Q16851 | protein_coding | TCGA-A8-A0A4-01 | Breast | breast invasive carcinoma | Female | >=65 | I/II | Hormone Therapy | tamoxiphen | CR | ||
| UGP2 | SNV | Missense_Mutation | c.301N>C | p.Ile101Leu | p.I101L | Q16851 | protein_coding | tolerated(0.46) | benign(0.013) | TCGA-AA-3679-01 | Colorectum | colon adenocarcinoma | Male | <65 | III/IV | Chemotherapy | folinic | SD | |
| UGP2 | SNV | Missense_Mutation | c.859N>T | p.Arg287Cys | p.R287C | Q16851 | protein_coding | deleterious(0) | probably_damaging(0.998) | TCGA-AA-3852-01 | Colorectum | colon adenocarcinoma | Male | >=65 | I/II | Unknown | Unknown | PD | |
| UGP2 | SNV | Missense_Mutation | novel | c.73C>T | p.Arg25Trp | p.R25W | Q16851 | protein_coding | tolerated(0.06) | possibly_damaging(0.895) | TCGA-AA-3984-01 | Colorectum | colon adenocarcinoma | Female | <65 | I/II | Unknown | Unknown | SD |
| UGP2 | SNV | Missense_Mutation | c.770C>T | p.Ala257Val | p.A257V | Q16851 | protein_coding | deleterious(0) | probably_damaging(0.999) | TCGA-AA-A00N-01 | Colorectum | colon adenocarcinoma | Male | >=65 | I/II | Unknown | Unknown | PD |
| Page: 1 2 3 4 5 6 7 |
Top |
Related drugs of malignant transformation related genes |
| Identification of chemicals and drugs interact with genes involved in malignant transfromation |
| (DGIdb 4.0) |
| Entrez ID | Symbol | Category | Interaction Types | Drug Claim Name | Drug Name | PMIDs |
| Page: 1 |

Copyright 2023-Present -The University of Texas Health Science Center at Houston |