
|
|||||
|
 | |
| |
| |
| |
| |
| |
|
Gene: TTLL12 |
Gene summary for TTLL12 |
| Gene information | Species | Human | Gene symbol | TTLL12 | Gene ID | 23170 |
| Gene name | tubulin tyrosine ligase like 12 | |
| Gene Alias | dJ526I14.2 | |
| Cytomap | 22q13.2 | |
| Gene Type | protein-coding | GO ID | GO:0000278 | UniProtAcc | A0A024R4U3 |
Top |
Malignant transformation analysis |
| Identification of the aberrant gene expression in precancerous and cancerous lesions by comparing the gene expression of stem-like cells in diseased tissues with normal stem cells |
| Entrez ID | Symbol | Replicates | Species | Organ | Tissue | Adj P-value | Log2FC | Malignancy |
| 23170 | TTLL12 | HTA11_3410_2000001011 | Human | Colorectum | AD | 4.53e-03 | 1.61e-01 | 0.0155 |
| 23170 | TTLL12 | HTA11_2487_2000001011 | Human | Colorectum | SER | 5.11e-07 | 4.13e-01 | -0.1808 |
| 23170 | TTLL12 | HTA11_1938_2000001011 | Human | Colorectum | AD | 2.13e-17 | 6.91e-01 | -0.0811 |
| 23170 | TTLL12 | HTA11_78_2000001011 | Human | Colorectum | AD | 3.36e-05 | 3.56e-01 | -0.1088 |
| 23170 | TTLL12 | HTA11_347_2000001011 | Human | Colorectum | AD | 1.37e-24 | 6.32e-01 | -0.1954 |
| 23170 | TTLL12 | HTA11_411_2000001011 | Human | Colorectum | SER | 5.29e-05 | 8.59e-01 | -0.2602 |
| 23170 | TTLL12 | HTA11_2112_2000001011 | Human | Colorectum | SER | 1.12e-06 | 6.33e-01 | -0.2196 |
| 23170 | TTLL12 | HTA11_3361_2000001011 | Human | Colorectum | AD | 1.61e-09 | 5.70e-01 | -0.1207 |
| 23170 | TTLL12 | HTA11_83_2000001011 | Human | Colorectum | SER | 2.44e-17 | 8.03e-01 | -0.1526 |
| 23170 | TTLL12 | HTA11_696_2000001011 | Human | Colorectum | AD | 6.57e-15 | 5.66e-01 | -0.1464 |
| 23170 | TTLL12 | HTA11_866_2000001011 | Human | Colorectum | AD | 2.29e-09 | 3.93e-01 | -0.1001 |
| 23170 | TTLL12 | HTA11_1391_2000001011 | Human | Colorectum | AD | 3.65e-19 | 7.31e-01 | -0.059 |
| 23170 | TTLL12 | HTA11_2992_2000001011 | Human | Colorectum | SER | 5.61e-06 | 6.41e-01 | -0.1706 |
| 23170 | TTLL12 | HTA11_5212_2000001011 | Human | Colorectum | AD | 3.58e-04 | 5.27e-01 | -0.2061 |
| 23170 | TTLL12 | HTA11_546_2000001011 | Human | Colorectum | AD | 6.44e-08 | 5.63e-01 | -0.0842 |
| 23170 | TTLL12 | HTA11_866_3004761011 | Human | Colorectum | AD | 9.12e-13 | 4.04e-01 | 0.096 |
| 23170 | TTLL12 | HTA11_9408_2000001011 | Human | Colorectum | AD | 1.73e-02 | 3.86e-01 | 0.0451 |
| 23170 | TTLL12 | HTA11_6801_2000001011 | Human | Colorectum | SER | 3.78e-04 | 6.82e-01 | 0.0171 |
| 23170 | TTLL12 | HTA11_7696_3000711011 | Human | Colorectum | AD | 5.36e-19 | 4.90e-01 | 0.0674 |
| 23170 | TTLL12 | HTA11_7469_2000001011 | Human | Colorectum | AD | 6.40e-06 | 8.32e-01 | -0.0124 |
| Page: 1 2 3 4 5 6 |
| Tissue | Expression Dynamics | Abbreviation |
| Colorectum (GSE201348) |  | FAP: Familial adenomatous polyposis |
| CRC: Colorectal cancer | ||
| Colorectum (HTA11) |  | AD: Adenomas |
| SER: Sessile serrated lesions | ||
| MSI-H: Microsatellite-high colorectal cancer | ||
| MSS: Microsatellite stable colorectal cancer | ||
| Esophagus | 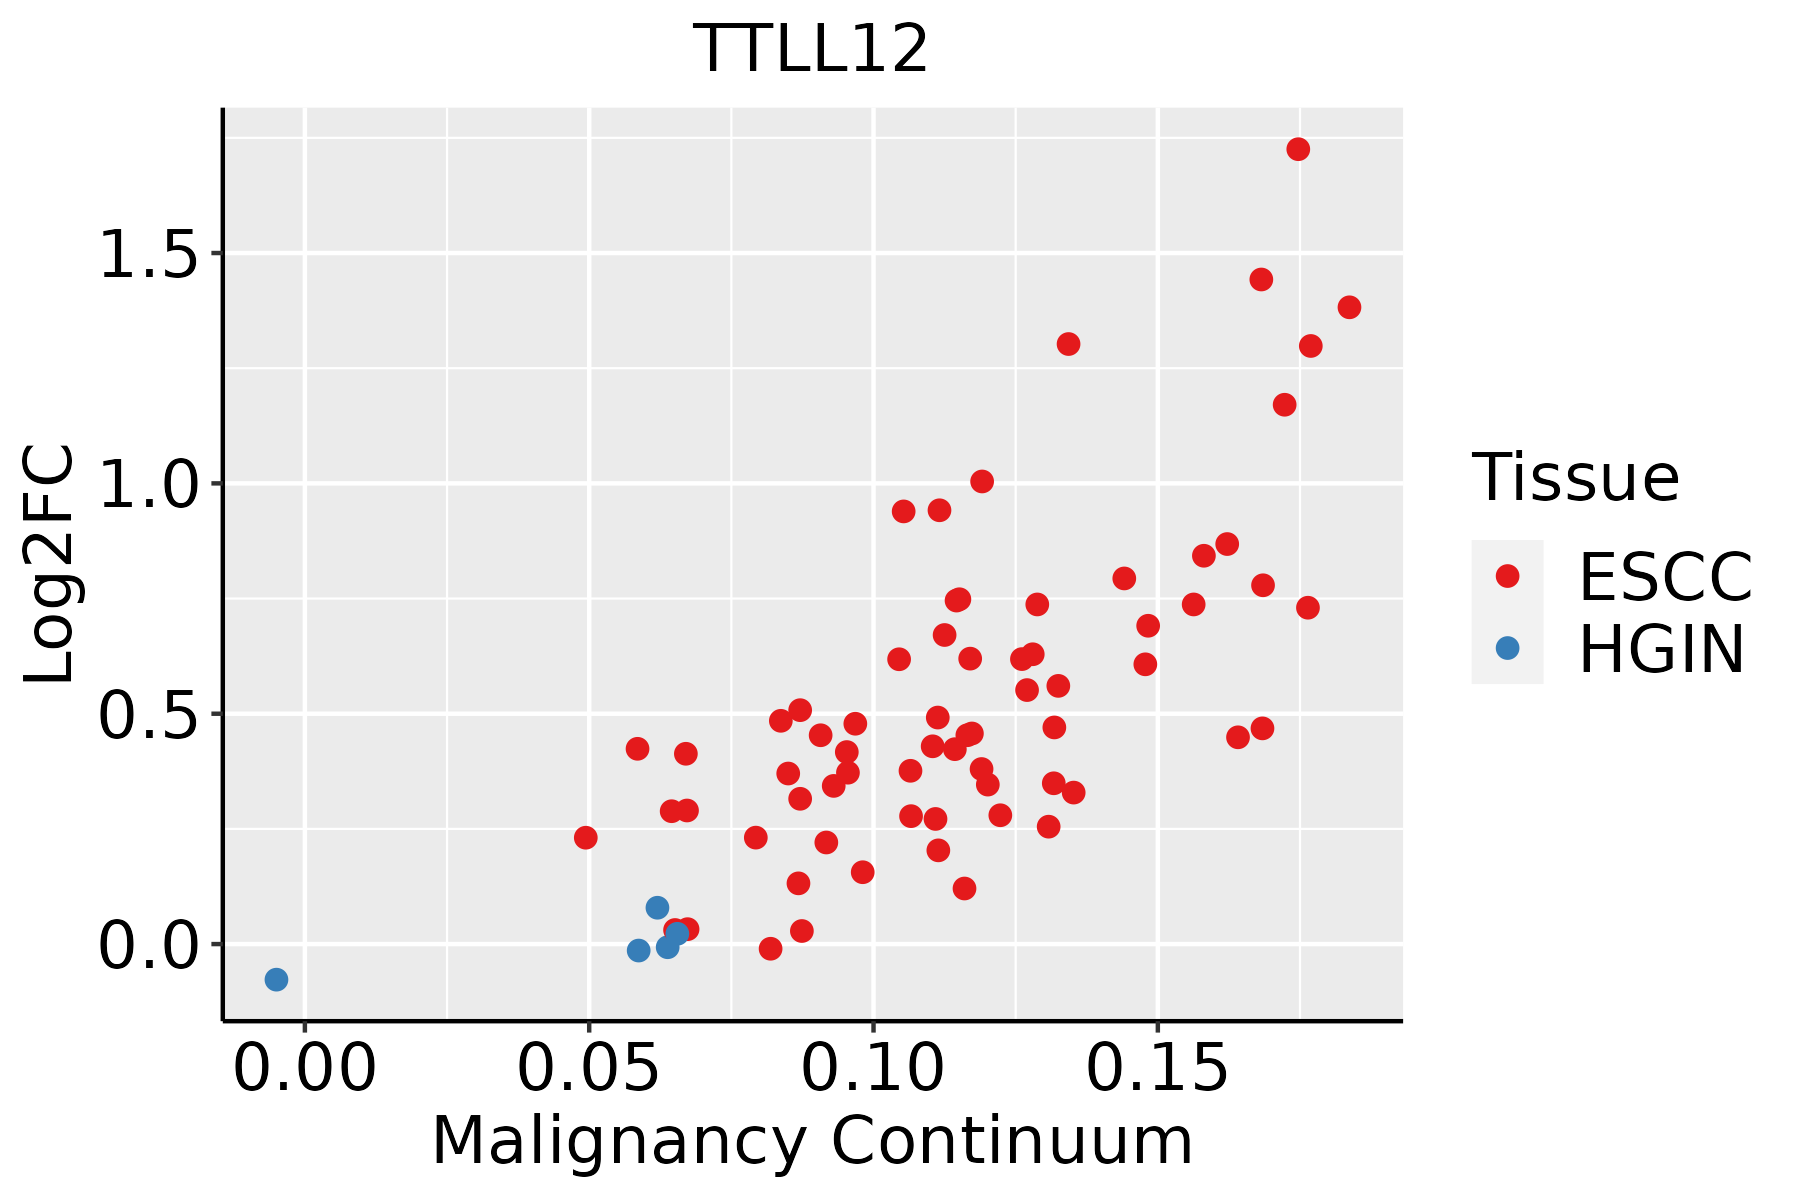 | ESCC: Esophageal squamous cell carcinoma |
| HGIN: High-grade intraepithelial neoplasias | ||
| LGIN: Low-grade intraepithelial neoplasias | ||
| Liver | 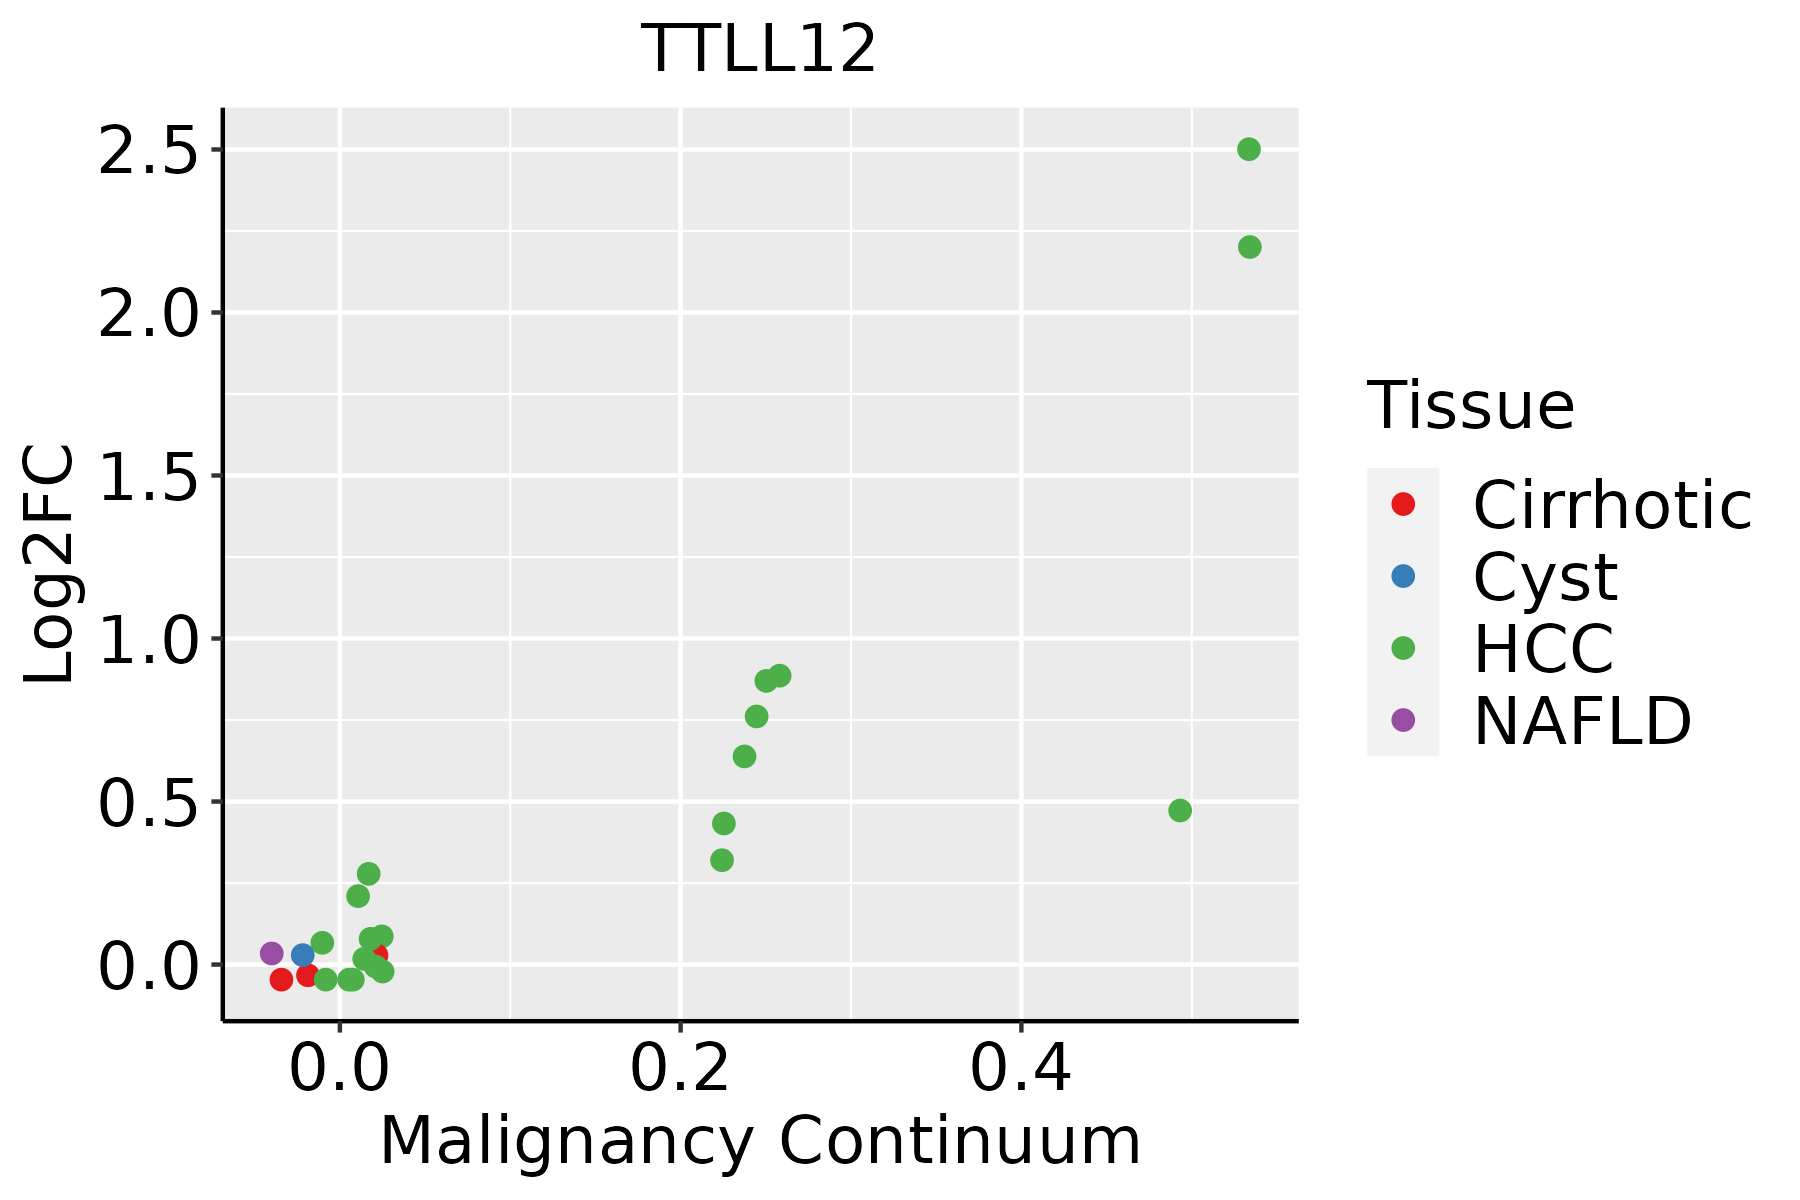 | HCC: Hepatocellular carcinoma |
| NAFLD: Non-alcoholic fatty liver disease | ||
| Oral Cavity | 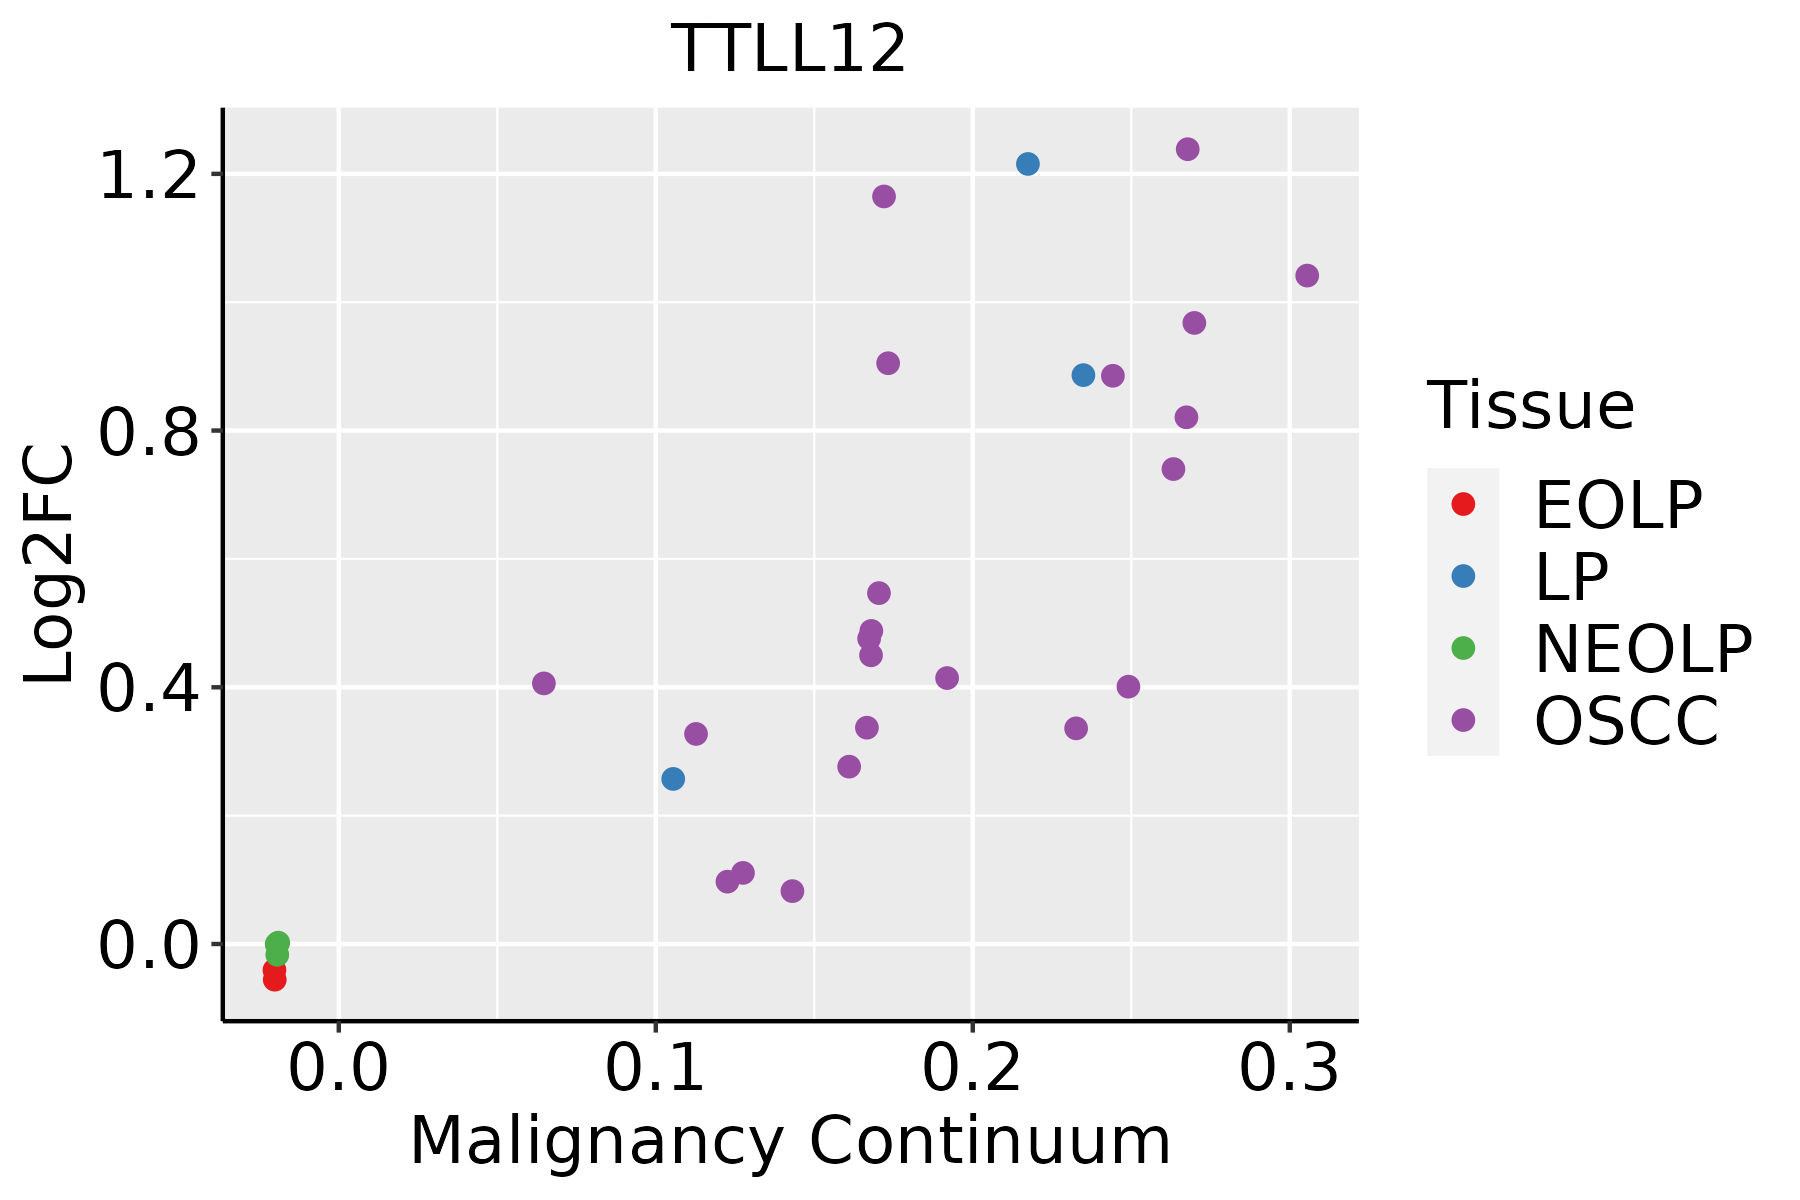 | EOLP: Erosive Oral lichen planus |
| LP: leukoplakia | ||
| NEOLP: Non-erosive oral lichen planus | ||
| OSCC: Oral squamous cell carcinoma | ||
| Skin | 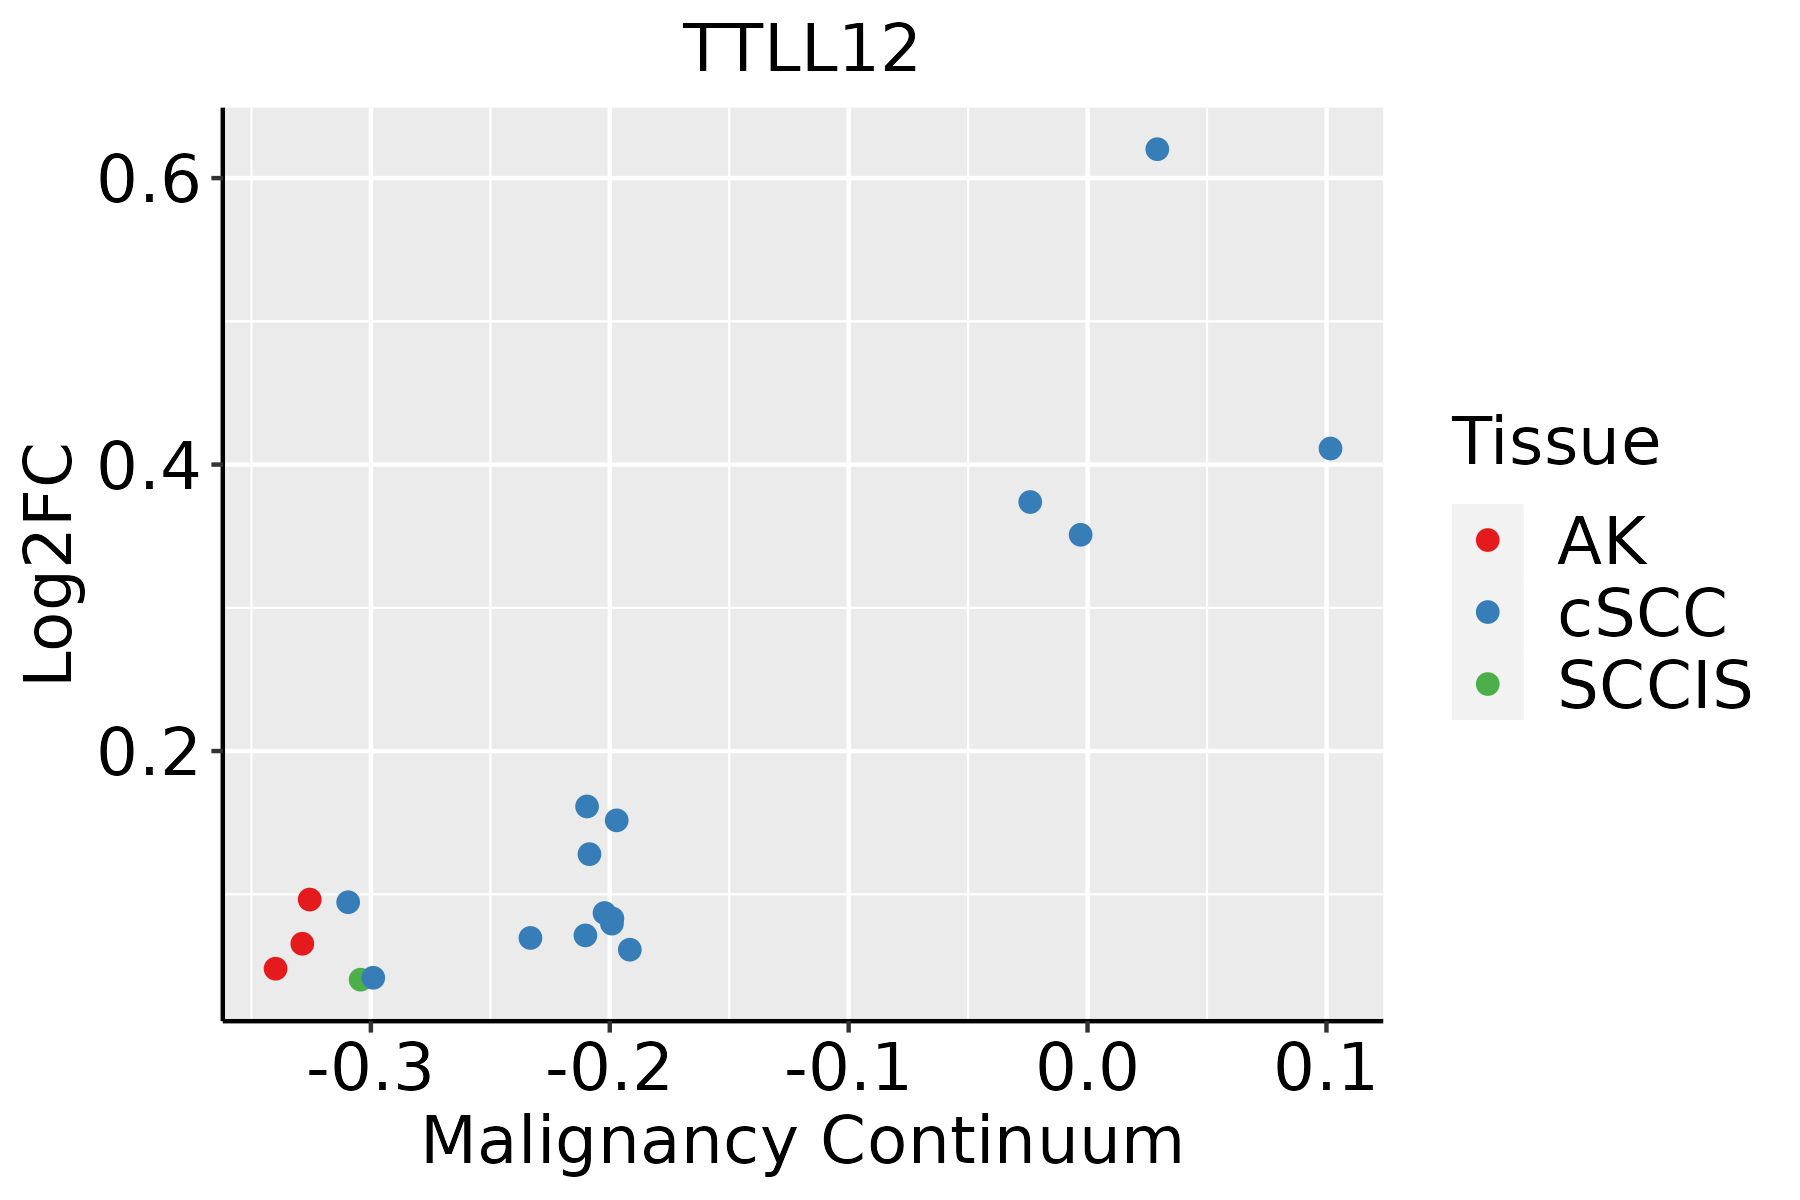 | AK: Actinic keratosis |
| cSCC: Cutaneous squamous cell carcinoma | ||
| SCCIS:squamous cell carcinoma in situ |
| ∗log2FC in expression of this searched gene in stem-like cells from each diseased tissue sample relative to stem-like cells in normal samples in each tissue plotted against the malignancy continuum. Samples are colored based on if they are from different disease stage. |
Top |
Malignant transformation related pathway analysis |
| Find out the enriched GO biological processes and KEGG pathways involved in transition from healthy to precancer to cancer |
| Tissue | Disease Stage | Enriched GO biological Processes |
| Colorectum | AD |  |
| Colorectum | SER |  |
| Colorectum | MSS |  |
| Colorectum | MSI-H |  |
| Colorectum | FAP |  |
| ∗Top 15 enriched GO BP terms are showed in the bar plot of each disease state in each tissue. Each row represents a significant GO biological process which is colored according to the -log10(p.adjust). |
| Page: 1 2 3 4 5 6 7 8 9 |
| GO ID | Tissue | Disease Stage | Description | Gene Ratio | Bg Ratio | pvalue | p.adjust | Count |
| GO:000734617 | Skin | cSCC | regulation of mitotic cell cycle | 192/4864 | 457/18723 | 3.47e-14 | 2.31e-12 | 192 |
| GO:003434014 | Skin | cSCC | response to type I interferon | 35/4864 | 58/18723 | 3.43e-08 | 9.08e-07 | 35 |
| GO:007135713 | Skin | cSCC | cellular response to type I interferon | 32/4864 | 52/18723 | 6.87e-08 | 1.72e-06 | 32 |
| GO:006033713 | Skin | cSCC | type I interferon signaling pathway | 31/4864 | 50/18723 | 8.59e-08 | 2.07e-06 | 31 |
| GO:00603386 | Skin | cSCC | regulation of type I interferon-mediated signaling pathway | 20/4864 | 36/18723 | 1.55e-04 | 1.36e-03 | 20 |
| GO:000283122 | Skin | cSCC | regulation of response to biotic stimulus | 112/4864 | 327/18723 | 5.00e-04 | 3.76e-03 | 112 |
| GO:00028326 | Skin | cSCC | negative regulation of response to biotic stimulus | 43/4864 | 108/18723 | 1.12e-03 | 7.36e-03 | 43 |
| GO:004508812 | Skin | cSCC | regulation of innate immune response | 75/4864 | 218/18723 | 3.40e-03 | 1.84e-02 | 75 |
| GO:00603393 | Skin | cSCC | negative regulation of type I interferon-mediated signaling pathway | 11/4864 | 20/18723 | 5.40e-03 | 2.71e-02 | 11 |
| GO:00607596 | Skin | cSCC | regulation of response to cytokine stimulus | 57/4864 | 162/18723 | 5.77e-03 | 2.85e-02 | 57 |
| GO:00458246 | Skin | cSCC | negative regulation of innate immune response | 28/4864 | 71/18723 | 8.86e-03 | 4.07e-02 | 28 |
| Page: 1 2 3 4 |
| Pathway ID | Tissue | Disease Stage | Description | Gene Ratio | Bg Ratio | pvalue | p.adjust | qvalue | Count |
| Page: 1 |
Top |
Cell-cell communication analysis |
| Identification of potential cell-cell interactions between two cell types and their ligand-receptor pairs for different disease states |
| Ligand | Receptor | LRpair | Pathway | Tissue | Disease Stage |
| Page: 1 |
Top |
Single-cell gene regulatory network inference analysis |
| Find out the significant the regulons (TFs) and the target genes of each regulon across cell types for different disease states |
| TF | Cell Type | Tissue | Disease Stage | Target Gene | RSS | Regulon Activity |
| ∗The dot plots of a searched regulon are shown for all cell subpopulations in each disease state of each tissue based on the regulon specific score inferred using pySCENIC and by calculating the average expression. |
| Page: 1 |
Top |
Somatic mutation of malignant transformation related genes |
| Annotation of somatic variants for genes involved in malignant transformation |
| Hugo Symbol | Variant Class | Variant Classification | dbSNP RS | HGVSc | HGVSp | HGVSp Short | SWISSPROT | BIOTYPE | SIFT | PolyPhen | Tumor Sample Barcode | Tissue | Histology | Sex | Age | Stage | Therapy Types | Drugs | Outcome |
| TTLL12 | deletion | Frame_Shift_Del | novel | c.1055delC | p.Pro352GlnfsTer5 | p.P352Qfs*5 | Q14166 | protein_coding | TCGA-D8-A27V-01 | Breast | breast invasive carcinoma | Female | <65 | I/II | Hormone Therapy | tamoxiphen | SD | ||
| TTLL12 | SNV | Missense_Mutation | rs767983108 | c.754N>T | p.Arg252Trp | p.R252W | Q14166 | protein_coding | deleterious(0) | probably_damaging(0.997) | TCGA-DG-A2KK-01 | Cervix | cervical & endocervical cancer | Female | <65 | III/IV | Chemotherapy | cisplatin | SD |
| TTLL12 | SNV | Missense_Mutation | rs759732112 | c.719N>A | p.Arg240Gln | p.R240Q | Q14166 | protein_coding | deleterious(0) | probably_damaging(0.917) | TCGA-EK-A3GK-01 | Cervix | cervical & endocervical cancer | Female | <65 | I/II | Unknown | Unknown | SD |
| TTLL12 | insertion | In_Frame_Ins | novel | c.1108_1109insCCA | p.Cys370delinsSerSer | p.C370delinsSS | Q14166 | protein_coding | TCGA-DS-A1OD-01 | Cervix | cervical & endocervical cancer | Female | <65 | I/II | Chemotherapy | cisplatin | SD | ||
| TTLL12 | SNV | Missense_Mutation | novel | c.430N>T | p.Arg144Cys | p.R144C | Q14166 | protein_coding | deleterious(0) | probably_damaging(0.999) | TCGA-5M-AAT6-01 | Colorectum | colon adenocarcinoma | Female | <65 | III/IV | Unknown | Unknown | PD |
| TTLL12 | SNV | Missense_Mutation | novel | c.521A>G | p.Asn174Ser | p.N174S | Q14166 | protein_coding | tolerated(0.26) | benign(0.119) | TCGA-5M-AATA-01 | Colorectum | colon adenocarcinoma | Unknown | Unknown | I/II | Unknown | Unknown | Unknown |
| TTLL12 | SNV | Missense_Mutation | rs745511521 | c.355C>T | p.Leu119Phe | p.L119F | Q14166 | protein_coding | deleterious(0.02) | probably_damaging(0.997) | TCGA-AD-5900-01 | Colorectum | colon adenocarcinoma | Male | >=65 | I/II | Unknown | Unknown | SD |
| TTLL12 | SNV | Missense_Mutation | c.1411A>G | p.Ile471Val | p.I471V | Q14166 | protein_coding | tolerated(0.55) | benign(0.019) | TCGA-AM-5821-01 | Colorectum | colon adenocarcinoma | Female | >=65 | I/II | Unknown | Unknown | SD | |
| TTLL12 | SNV | Missense_Mutation | rs138428335 | c.1634C>T | p.Thr545Met | p.T545M | Q14166 | protein_coding | tolerated(0.06) | benign(0.108) | TCGA-AU-6004-01 | Colorectum | colon adenocarcinoma | Female | >=65 | I/II | Unknown | Unknown | SD |
| TTLL12 | SNV | Missense_Mutation | rs148175933 | c.599N>A | p.Arg200Gln | p.R200Q | Q14166 | protein_coding | tolerated(0.19) | benign(0.158) | TCGA-AZ-6598-01 | Colorectum | colon adenocarcinoma | Female | >=65 | I/II | Unknown | Unknown | SD |
| Page: 1 2 3 4 5 6 |
Top |
Related drugs of malignant transformation related genes |
| Identification of chemicals and drugs interact with genes involved in malignant transfromation |
| (DGIdb 4.0) |
| Entrez ID | Symbol | Category | Interaction Types | Drug Claim Name | Drug Name | PMIDs |
| Page: 1 |

Copyright 2023-Present -The University of Texas Health Science Center at Houston |