| Tissue | Expression Dynamics | Abbreviation |
| Cervix | 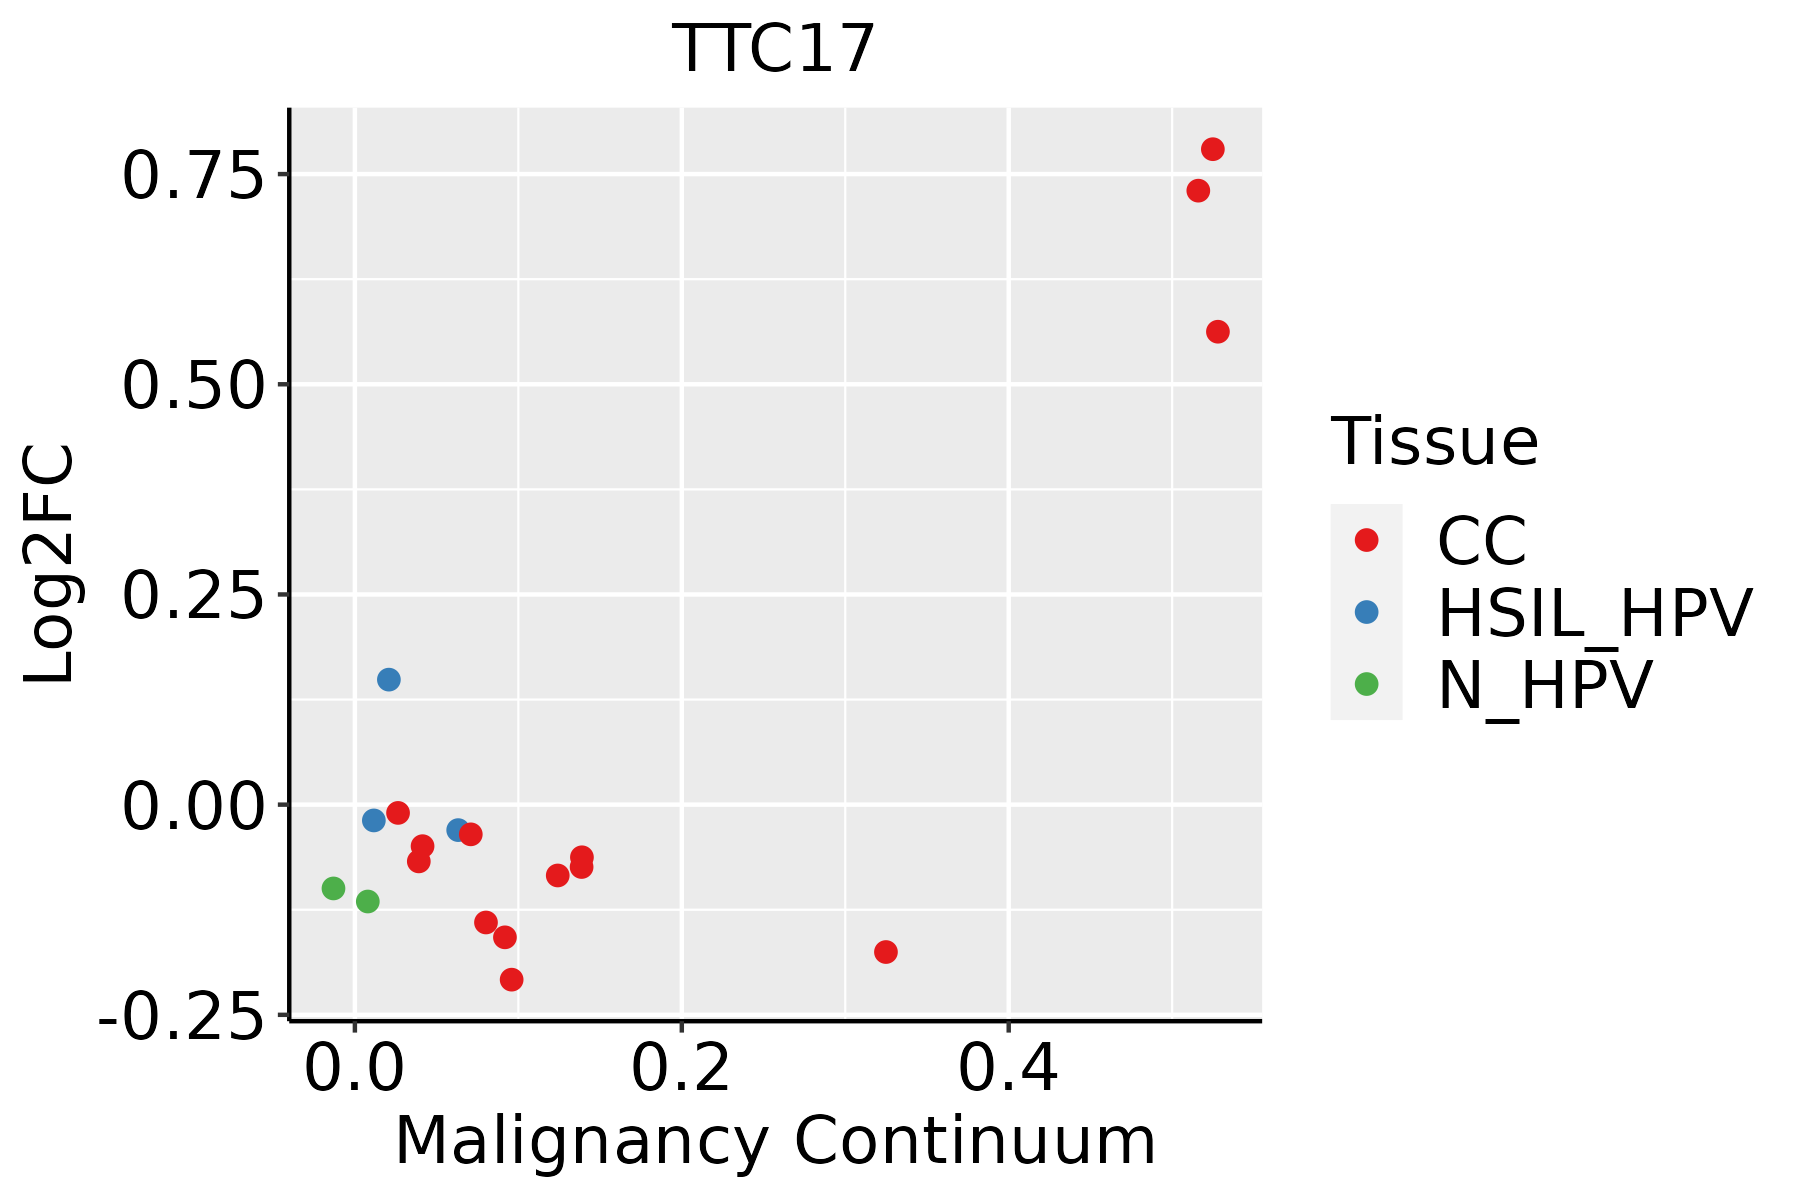 | CC: Cervix cancer |
| HSIL_HPV: HPV-infected high-grade squamous intraepithelial lesions |
| N_HPV: HPV-infected normal cervix |
| Colorectum (GSE201348) |  | FAP: Familial adenomatous polyposis |
| CRC: Colorectal cancer |
| Colorectum (HTA11) | 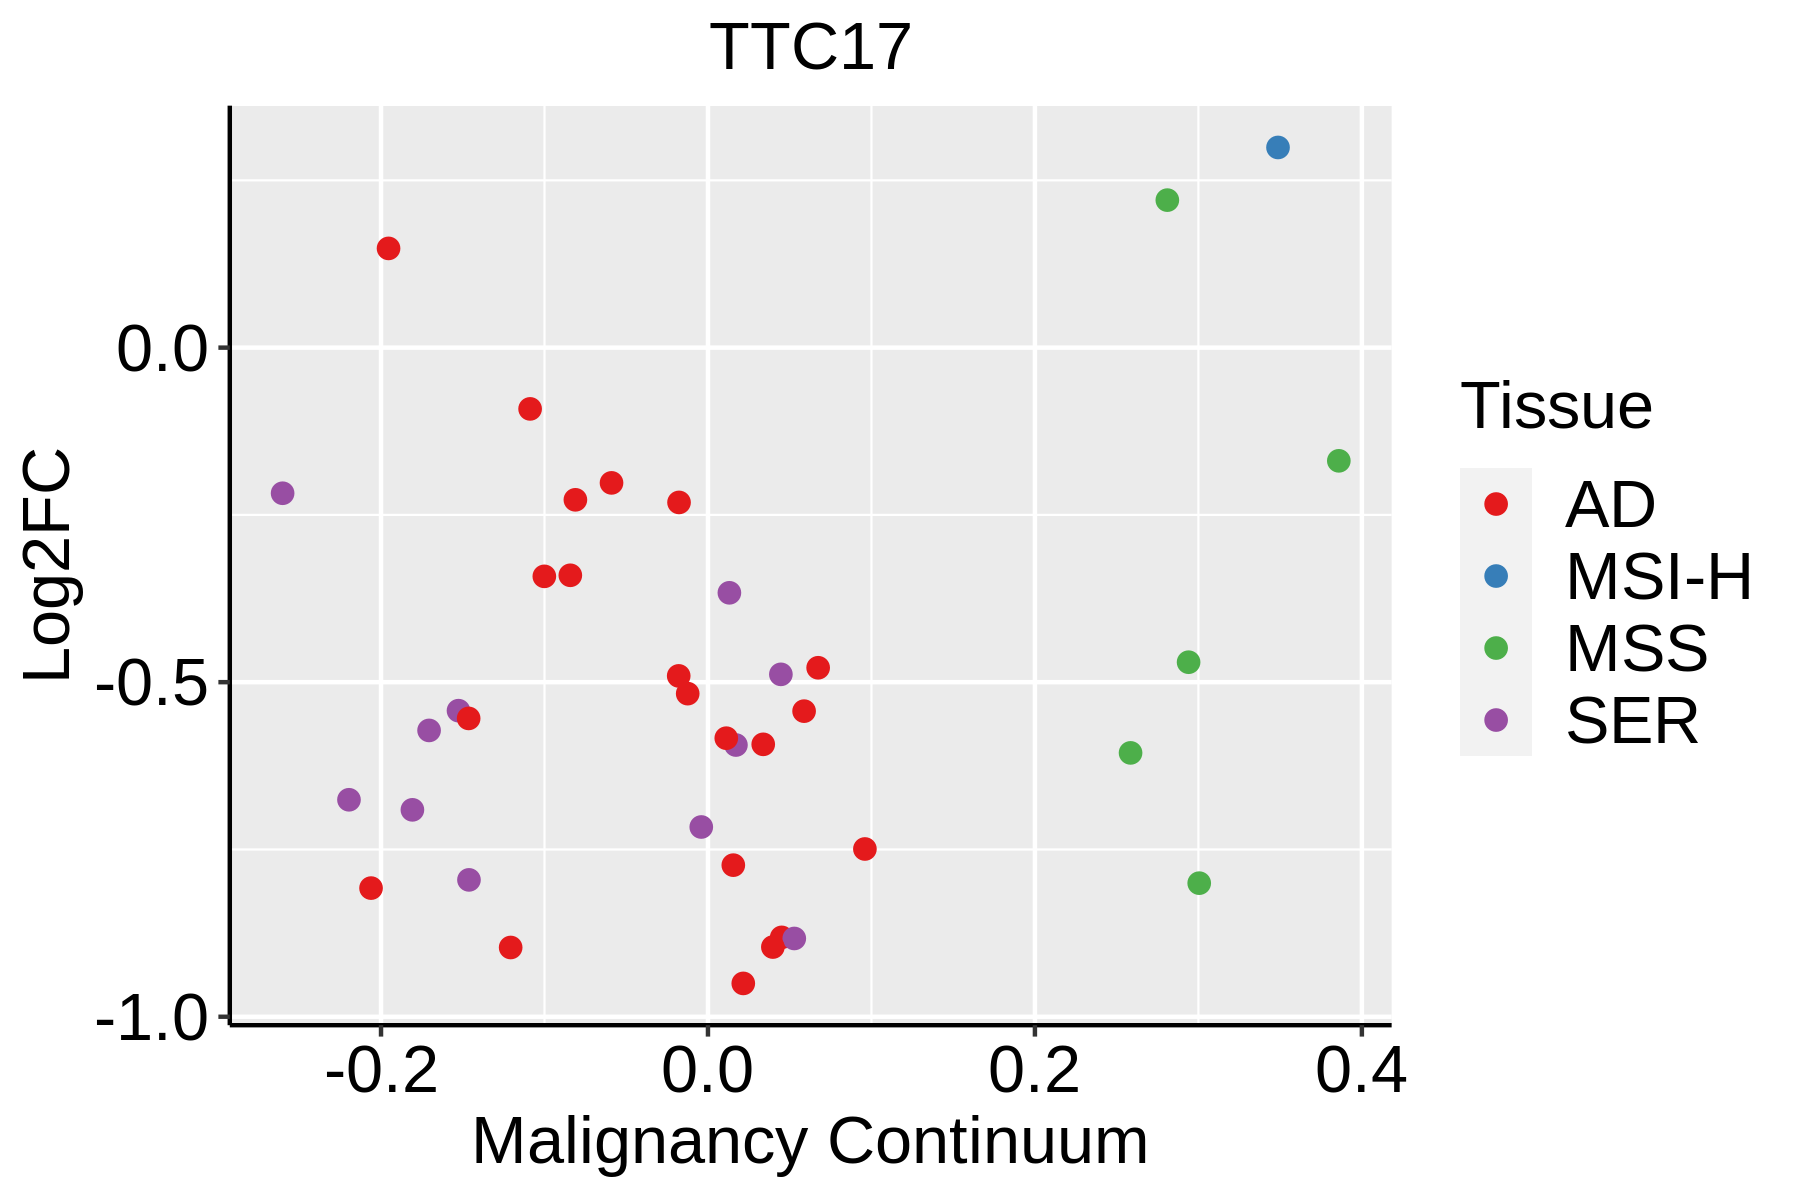 | AD: Adenomas |
| SER: Sessile serrated lesions |
| MSI-H: Microsatellite-high colorectal cancer |
| MSS: Microsatellite stable colorectal cancer |
| Esophagus | 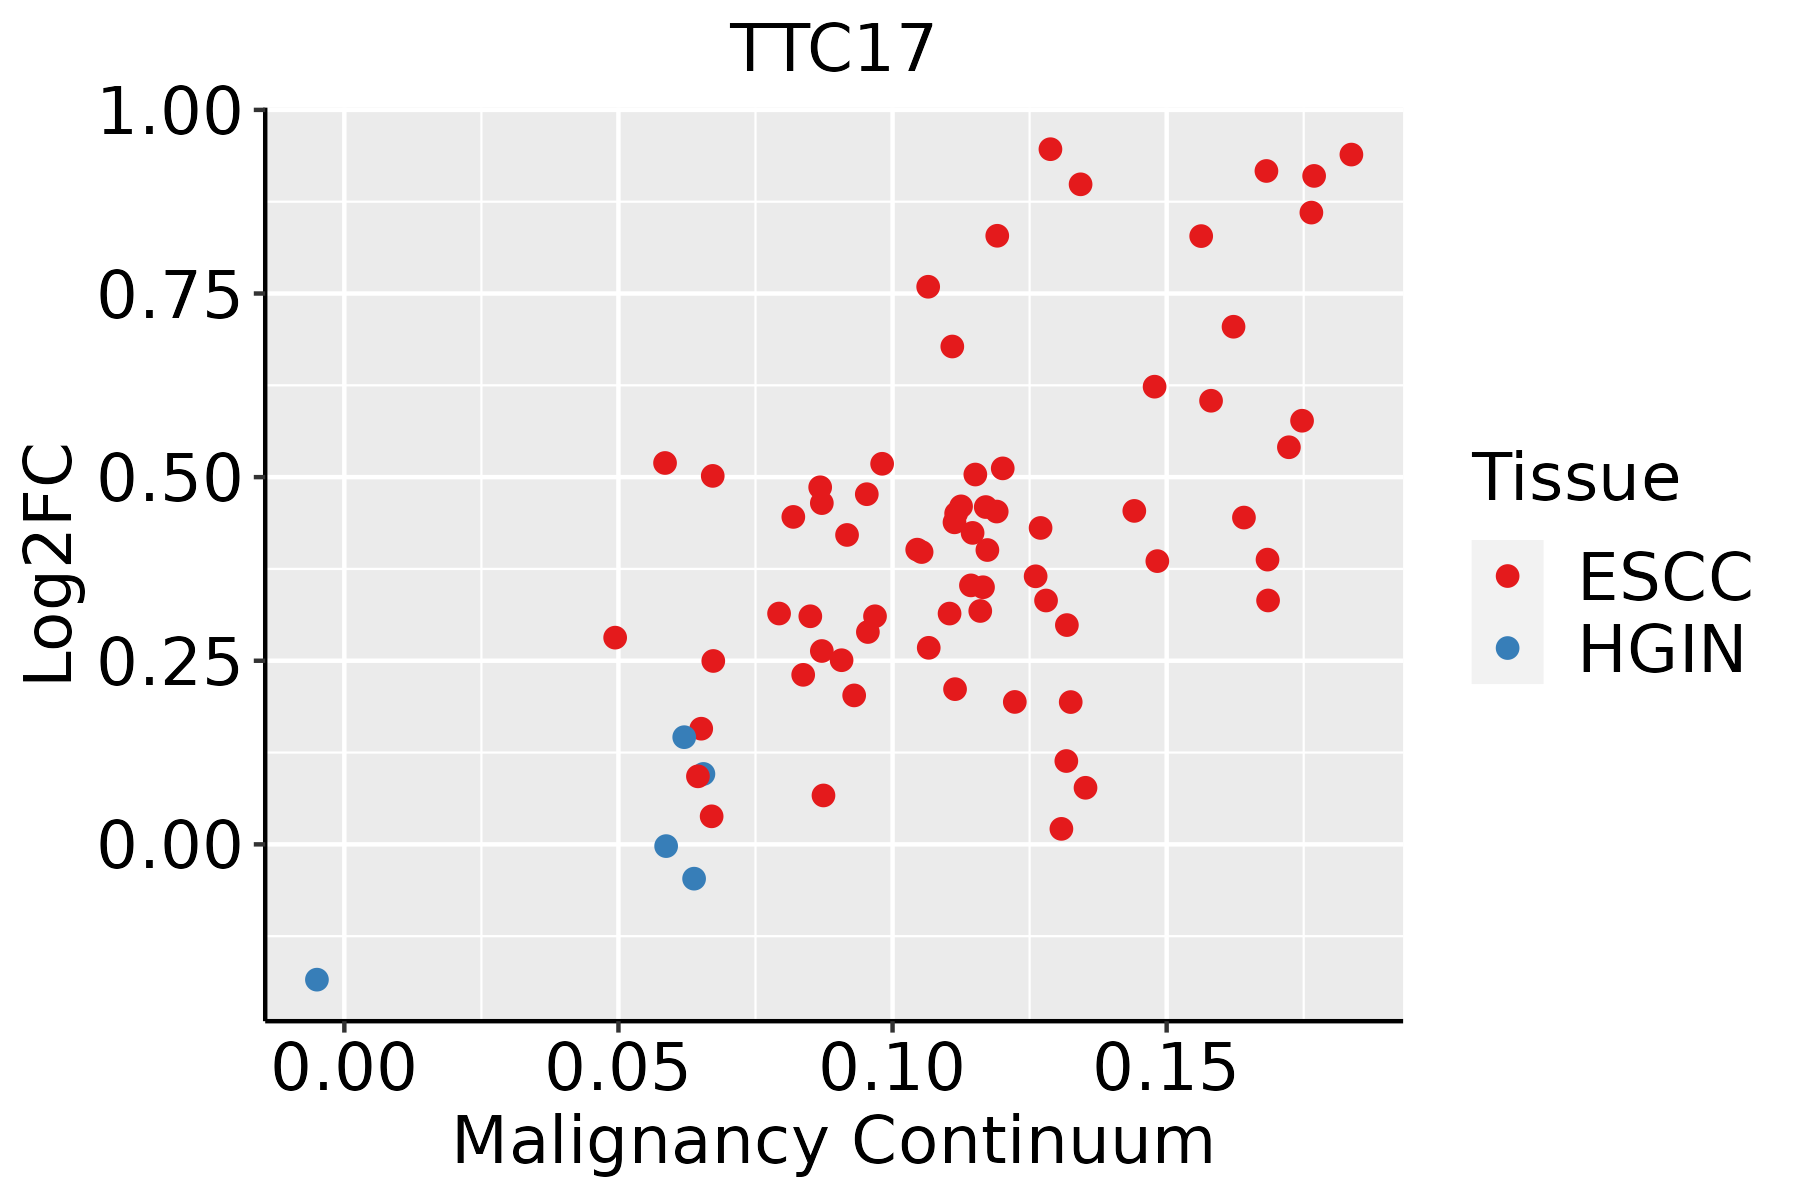 | ESCC: Esophageal squamous cell carcinoma |
| HGIN: High-grade intraepithelial neoplasias |
| LGIN: Low-grade intraepithelial neoplasias |
| Liver | 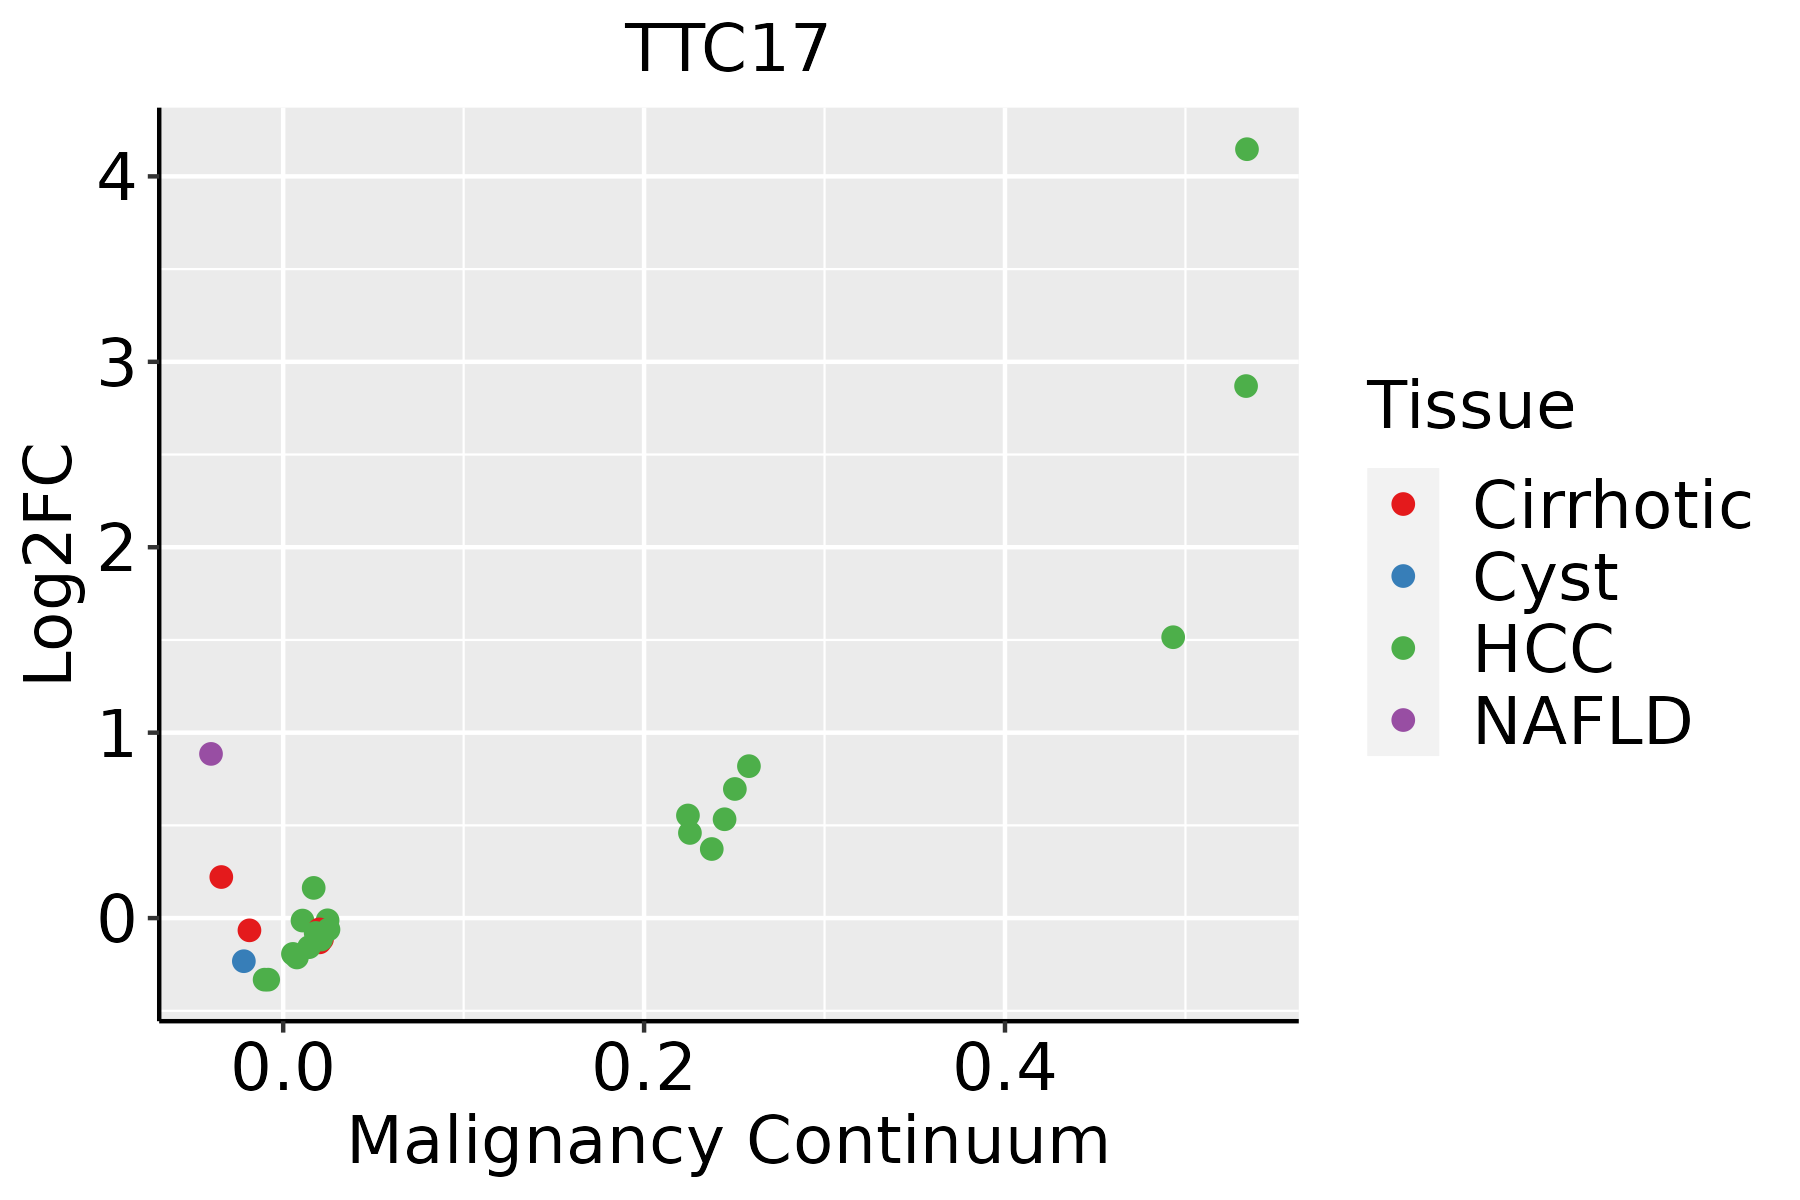 | HCC: Hepatocellular carcinoma |
| NAFLD: Non-alcoholic fatty liver disease |
| Lung |  | AAH: Atypical adenomatous hyperplasia |
| AIS: Adenocarcinoma in situ |
| IAC: Invasive lung adenocarcinoma |
| MIA: Minimally invasive adenocarcinoma |
| Oral Cavity | 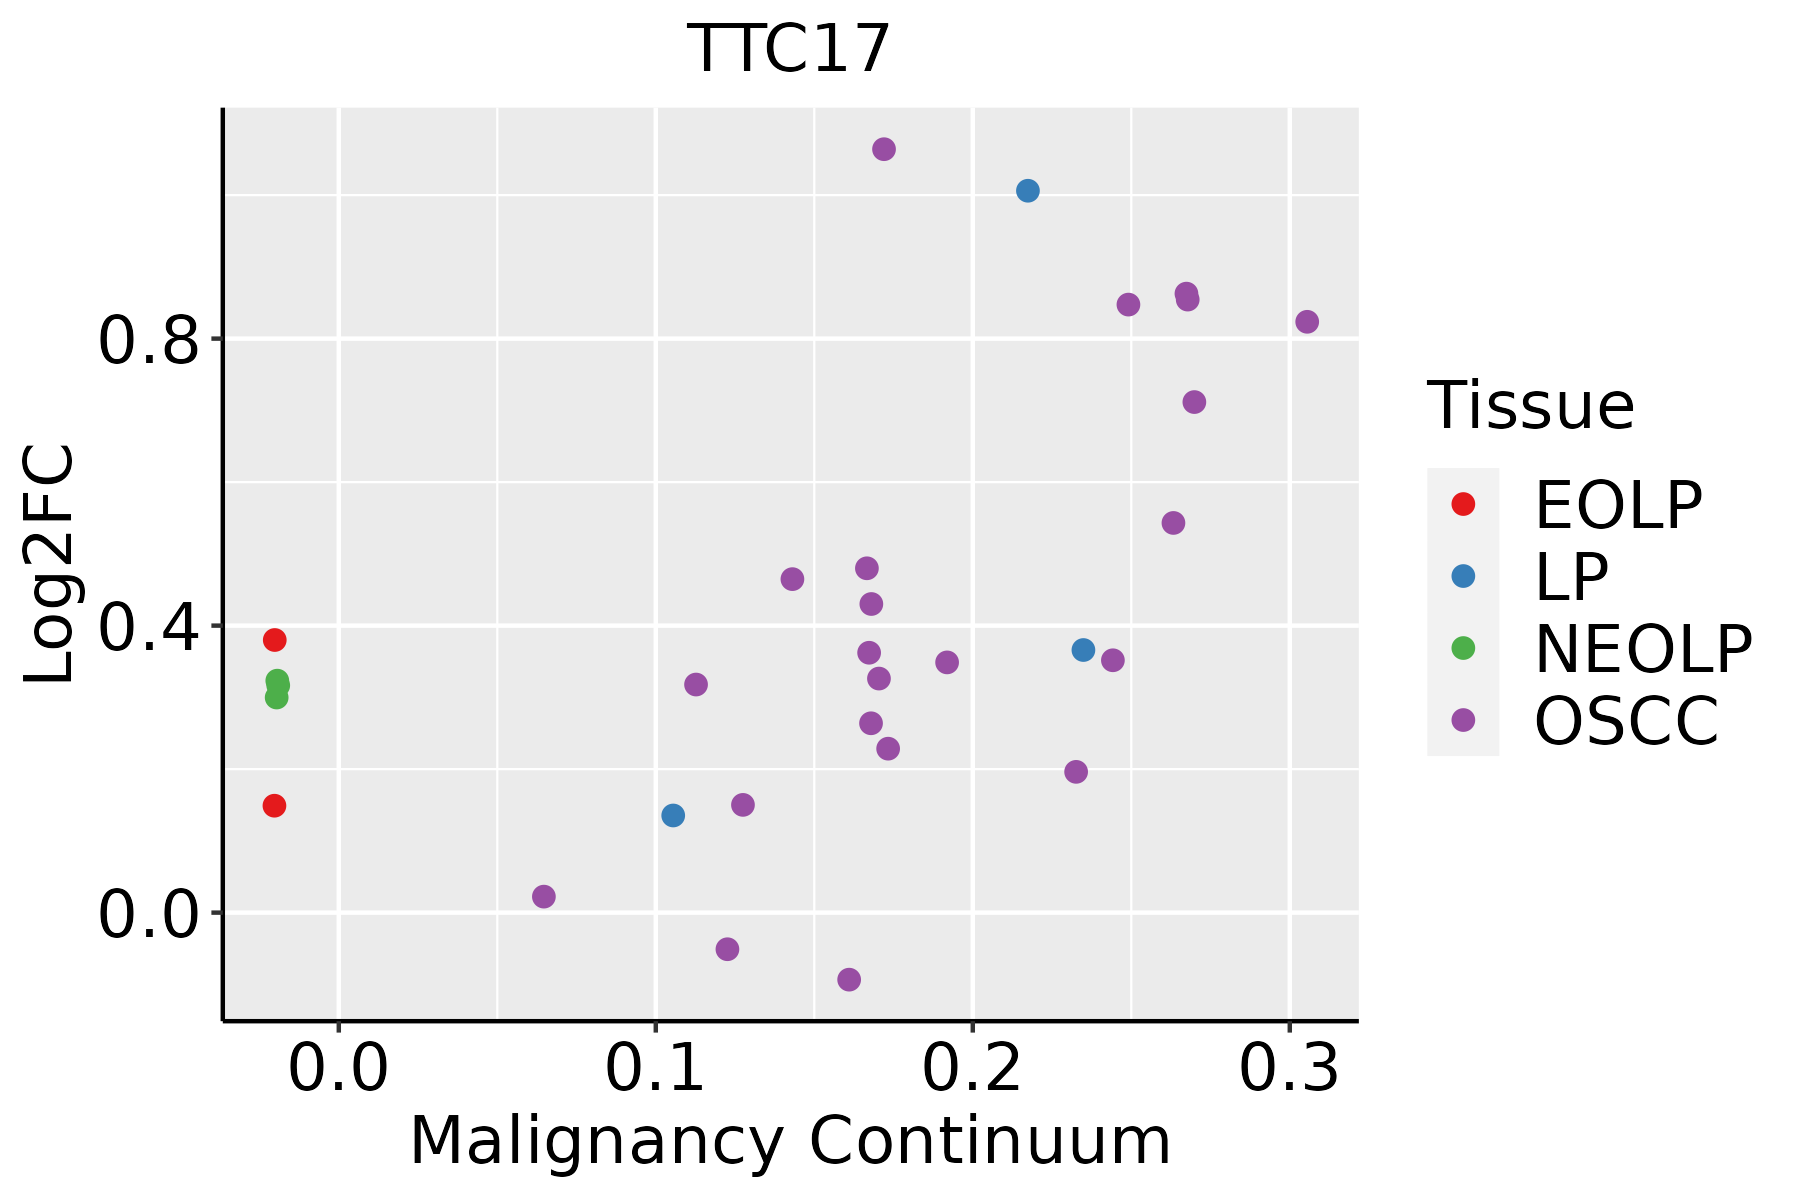 | EOLP: Erosive Oral lichen planus |
| LP: leukoplakia |
| NEOLP: Non-erosive oral lichen planus |
| OSCC: Oral squamous cell carcinoma |
| Prostate | 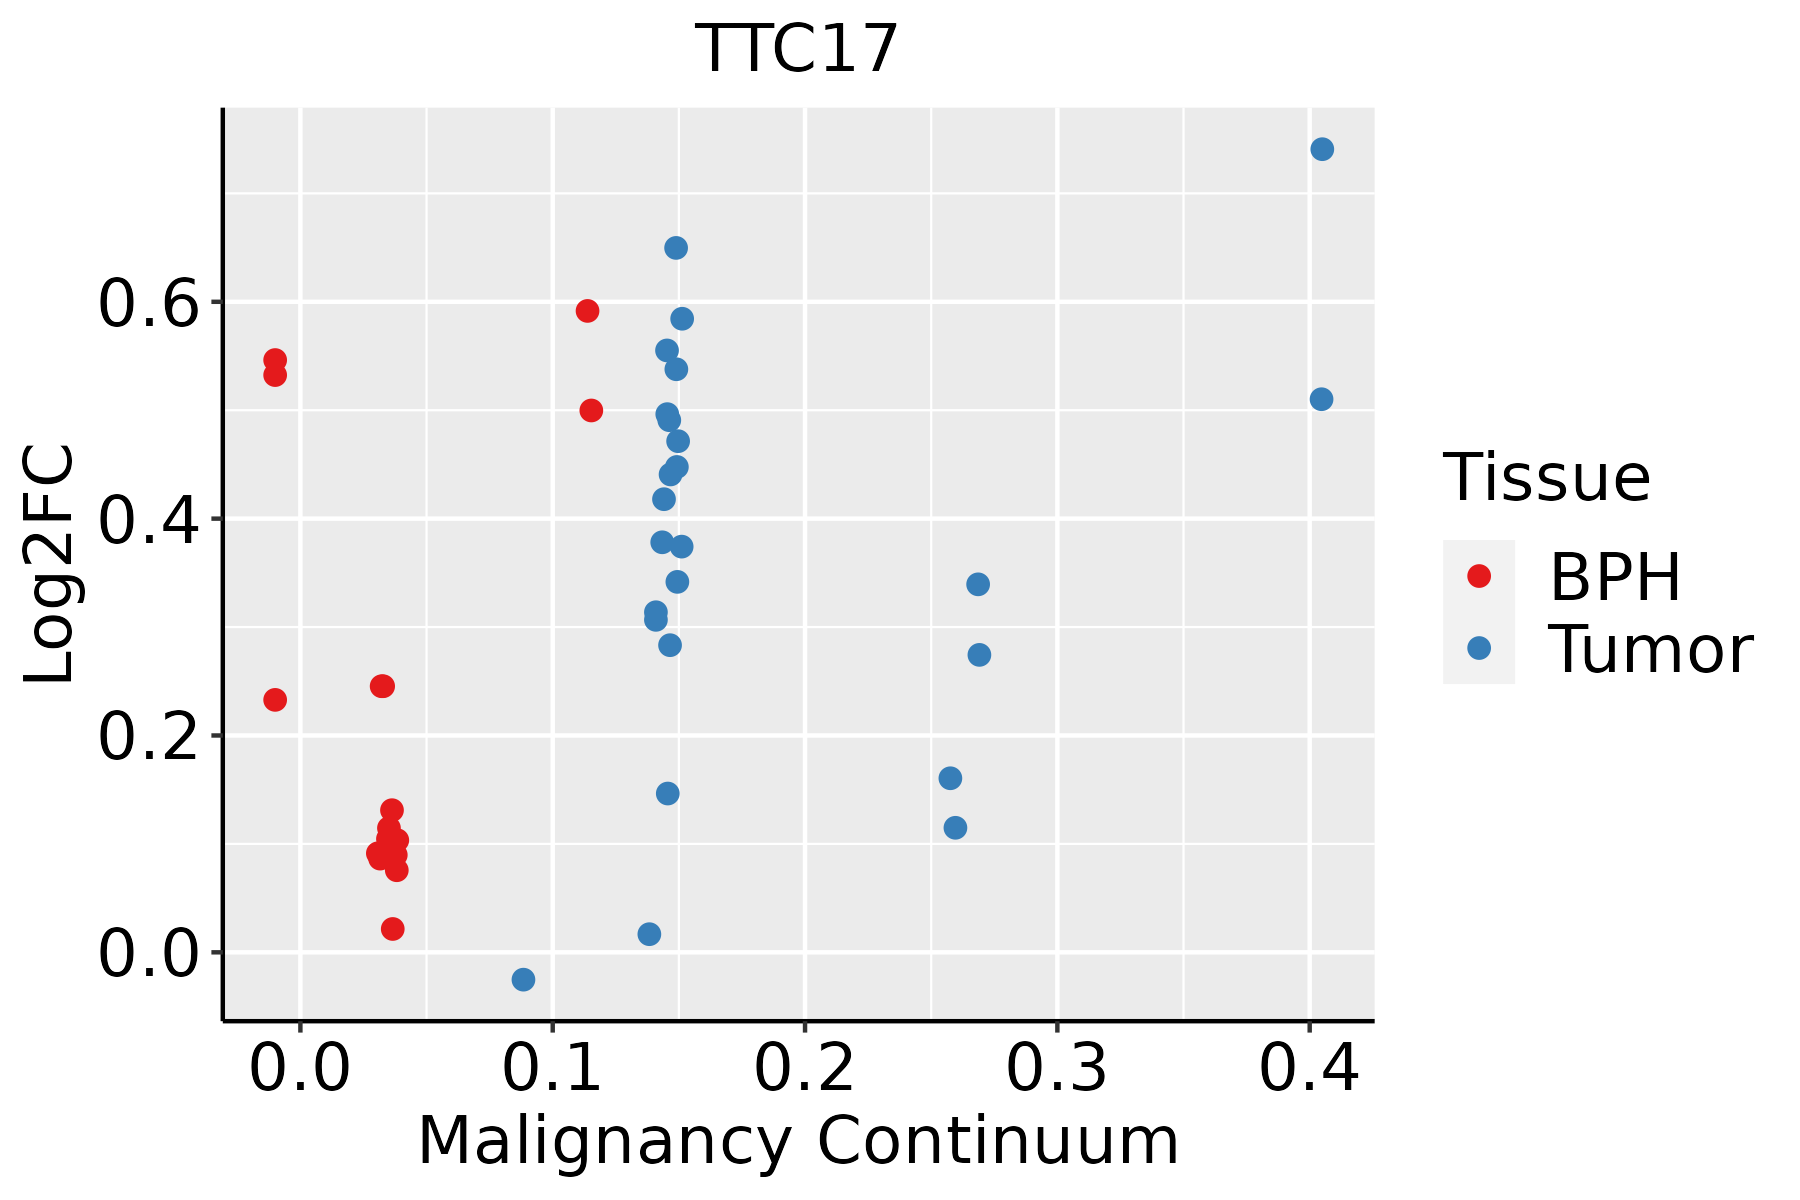 | BPH: Benign Prostatic Hyperplasia |
| Skin | 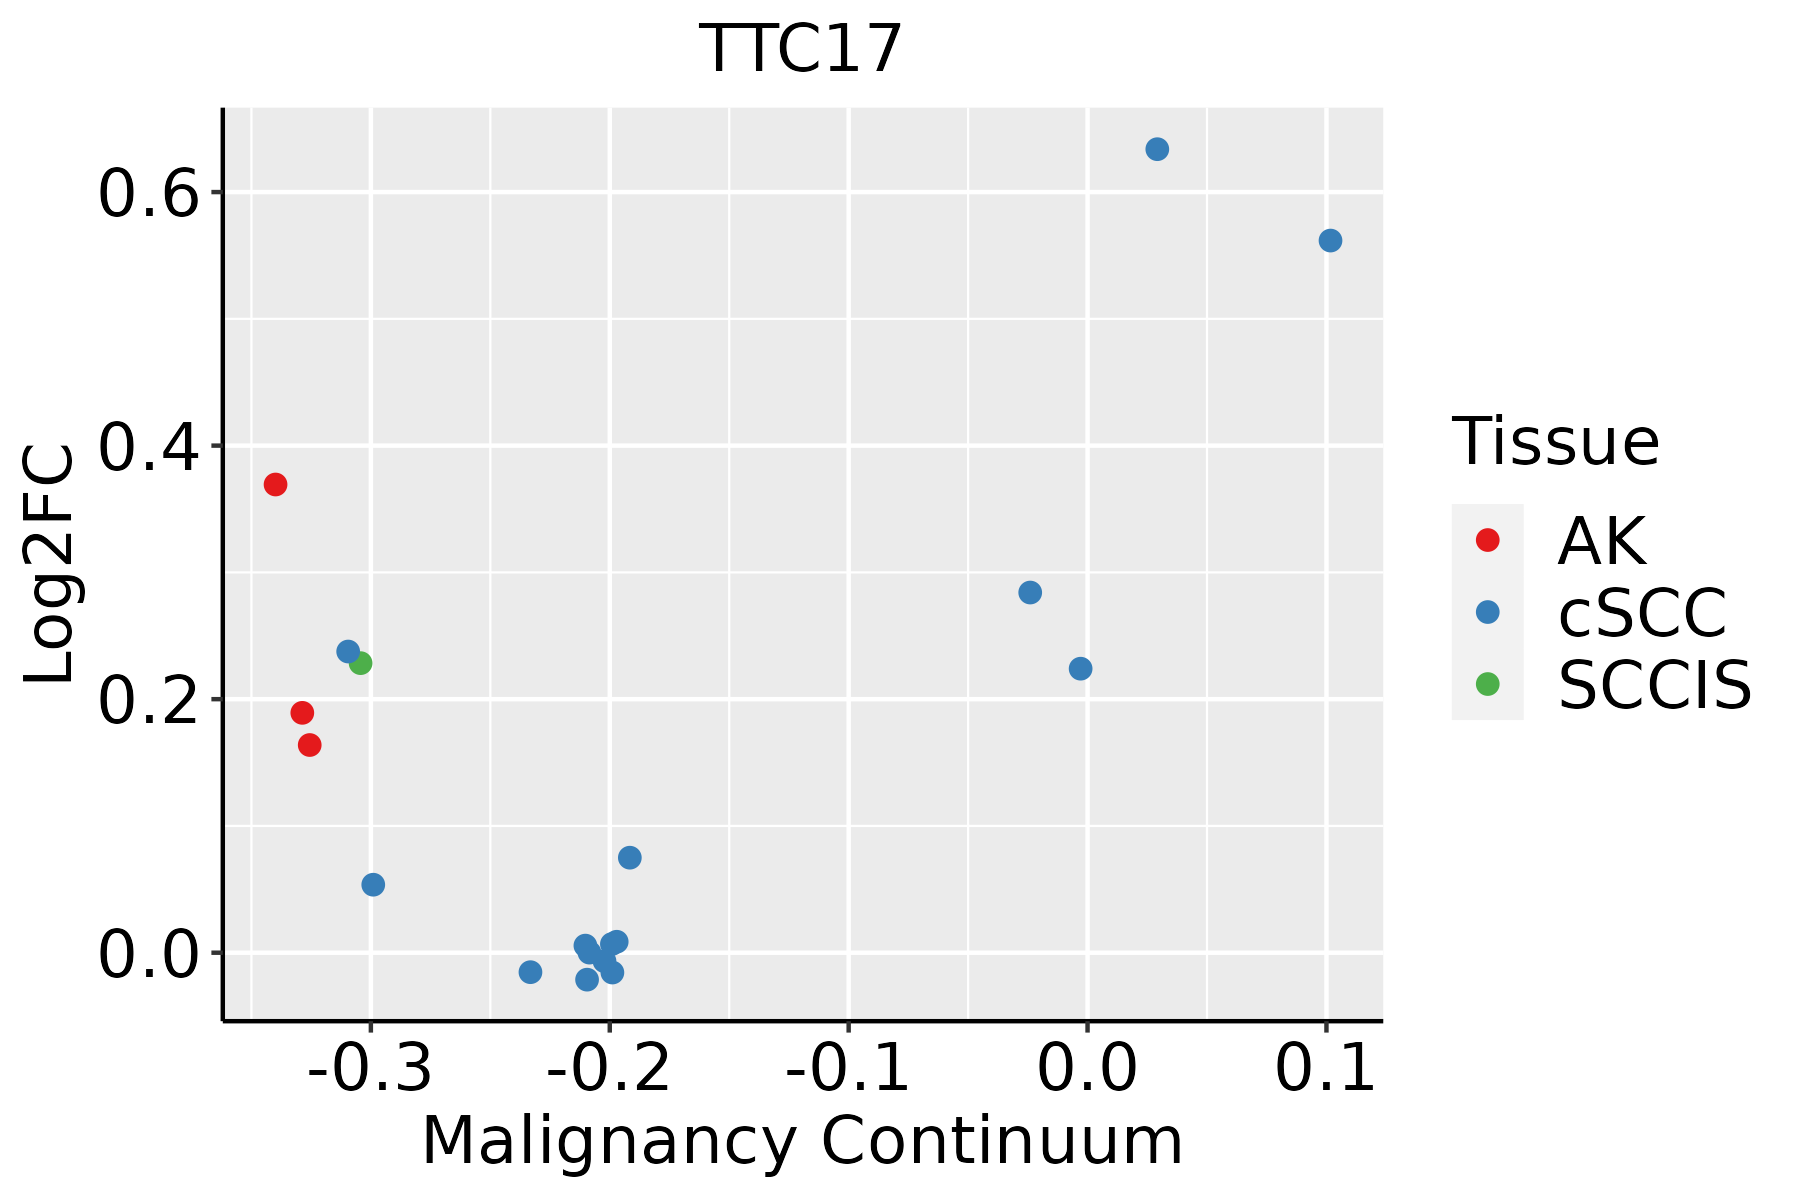 | AK: Actinic keratosis |
| cSCC: Cutaneous squamous cell carcinoma |
| SCCIS:squamous cell carcinoma in situ |
| Thyroid | 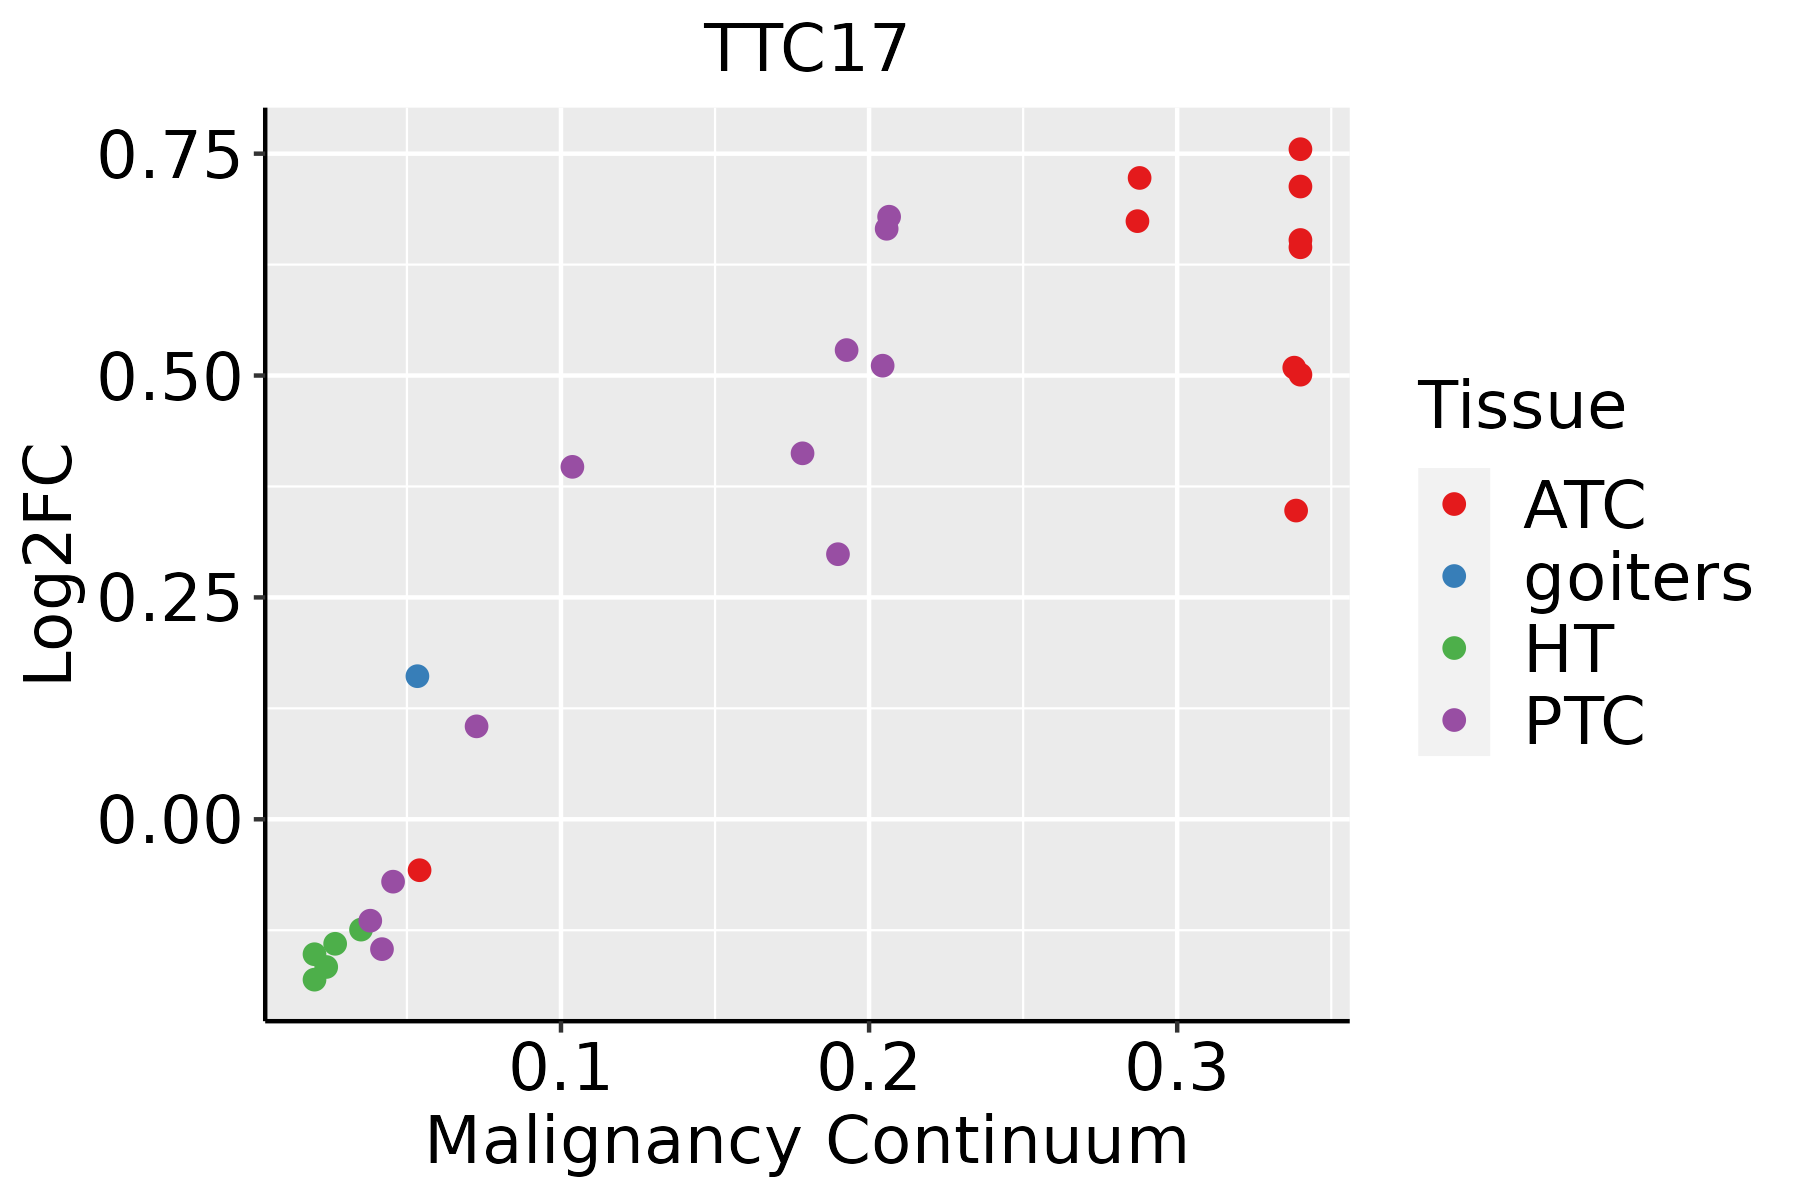 | ATC: Anaplastic thyroid cancer |
| HT: Hashimoto's thyroiditis |
| PTC: Papillary thyroid cancer |
| GO ID | Tissue | Disease Stage | Description | Gene Ratio | Bg Ratio | pvalue | p.adjust | Count |
| GO:003004119 | Oral cavity | LP | actin filament polymerization | 69/4623 | 191/18723 | 2.65e-04 | 2.75e-03 | 69 |
| GO:000815419 | Oral cavity | LP | actin polymerization or depolymerization | 76/4623 | 218/18723 | 4.67e-04 | 4.42e-03 | 76 |
| GO:000701526 | Oral cavity | EOLP | actin filament organization | 102/2218 | 442/18723 | 1.61e-11 | 2.48e-09 | 102 |
| GO:005125825 | Oral cavity | EOLP | protein polymerization | 74/2218 | 297/18723 | 2.65e-10 | 2.45e-08 | 74 |
| GO:000815424 | Oral cavity | EOLP | actin polymerization or depolymerization | 53/2218 | 218/18723 | 2.08e-07 | 6.55e-06 | 53 |
| GO:003004123 | Oral cavity | EOLP | actin filament polymerization | 48/2218 | 191/18723 | 2.68e-07 | 8.16e-06 | 48 |
| GO:000701534 | Oral cavity | NEOLP | actin filament organization | 94/2005 | 442/18723 | 4.49e-11 | 5.80e-09 | 94 |
| GO:005125833 | Oral cavity | NEOLP | protein polymerization | 67/2005 | 297/18723 | 2.27e-09 | 1.40e-07 | 67 |
| GO:000815431 | Oral cavity | NEOLP | actin polymerization or depolymerization | 47/2005 | 218/18723 | 2.11e-06 | 4.91e-05 | 47 |
| GO:003004132 | Oral cavity | NEOLP | actin filament polymerization | 41/2005 | 191/18723 | 1.03e-05 | 1.94e-04 | 41 |
| GO:000701518 | Prostate | BPH | actin filament organization | 147/3107 | 442/18723 | 3.36e-18 | 1.15e-15 | 147 |
| GO:005125818 | Prostate | BPH | protein polymerization | 96/3107 | 297/18723 | 1.52e-11 | 1.10e-09 | 96 |
| GO:000815416 | Prostate | BPH | actin polymerization or depolymerization | 72/3107 | 218/18723 | 1.82e-09 | 7.59e-08 | 72 |
| GO:003004116 | Prostate | BPH | actin filament polymerization | 63/3107 | 191/18723 | 1.94e-08 | 5.98e-07 | 63 |
| GO:000701519 | Prostate | Tumor | actin filament organization | 142/3246 | 442/18723 | 1.40e-14 | 1.89e-12 | 142 |
| GO:005125819 | Prostate | Tumor | protein polymerization | 93/3246 | 297/18723 | 2.22e-09 | 9.58e-08 | 93 |
| GO:000815417 | Prostate | Tumor | actin polymerization or depolymerization | 70/3246 | 218/18723 | 6.91e-08 | 1.97e-06 | 70 |
| GO:003004117 | Prostate | Tumor | actin filament polymerization | 62/3246 | 191/18723 | 2.47e-07 | 5.72e-06 | 62 |
| GO:000701528 | Skin | AK | actin filament organization | 85/1910 | 442/18723 | 5.94e-09 | 4.14e-07 | 85 |
| GO:005125827 | Skin | AK | protein polymerization | 53/1910 | 297/18723 | 3.74e-05 | 6.20e-04 | 53 |
| Hugo Symbol | Variant Class | Variant Classification | dbSNP RS | HGVSc | HGVSp | HGVSp Short | SWISSPROT | BIOTYPE | SIFT | PolyPhen | Tumor Sample Barcode | Tissue | Histology | Sex | Age | Stage | Therapy Types | Drugs | Outcome |
| TTC17 | SNV | Missense_Mutation | novel | c.2908G>T | p.Ala970Ser | p.A970S | Q96AE7 | protein_coding | tolerated(0.38) | possibly_damaging(0.551) | TCGA-A2-A25A-01 | Breast | breast invasive carcinoma | Female | <65 | I/II | Unspecific | Cytoxan | SD |
| TTC17 | SNV | Missense_Mutation | novel | c.3082A>G | p.Lys1028Glu | p.K1028E | Q96AE7 | protein_coding | tolerated(0.18) | probably_damaging(0.98) | TCGA-A2-A3XY-01 | Breast | breast invasive carcinoma | Female | <65 | I/II | Chemotherapy | adriamycin | PD |
| TTC17 | SNV | Missense_Mutation | | c.2881G>T | p.Asp961Tyr | p.D961Y | Q96AE7 | protein_coding | deleterious(0) | probably_damaging(0.997) | TCGA-AC-A23H-01 | Breast | breast invasive carcinoma | Female | >=65 | I/II | Unknown | Unknown | PD |
| TTC17 | SNV | Missense_Mutation | | c.412N>T | p.Asp138Tyr | p.D138Y | Q96AE7 | protein_coding | deleterious(0.02) | possibly_damaging(0.736) | TCGA-AN-A046-01 | Breast | breast invasive carcinoma | Female | >=65 | I/II | Unknown | Unknown | SD |
| TTC17 | SNV | Missense_Mutation | novel | c.3080N>G | p.Val1027Gly | p.V1027G | Q96AE7 | protein_coding | deleterious(0) | probably_damaging(0.991) | TCGA-AO-A1KP-01 | Breast | breast invasive carcinoma | Female | >=65 | I/II | Chemotherapy | fluorouracil | SD |
| TTC17 | SNV | Missense_Mutation | | c.1552G>A | p.Glu518Lys | p.E518K | Q96AE7 | protein_coding | tolerated(0.58) | benign(0.106) | TCGA-AR-A251-01 | Breast | breast invasive carcinoma | Female | <65 | III/IV | Chemotherapy | doxorubicin | SD |
| TTC17 | SNV | Missense_Mutation | | c.334N>T | p.Pro112Ser | p.P112S | Q96AE7 | protein_coding | tolerated(0.28) | benign(0.34) | TCGA-BH-A18G-01 | Breast | breast invasive carcinoma | Female | >=65 | I/II | Unknown | Unknown | SD |
| TTC17 | SNV | Missense_Mutation | | c.751N>G | p.Arg251Gly | p.R251G | Q96AE7 | protein_coding | deleterious(0) | probably_damaging(0.953) | TCGA-C8-A134-01 | Breast | breast invasive carcinoma | Female | <65 | I/II | Chemotherapy | 5-fluorouracil | CR |
| TTC17 | SNV | Missense_Mutation | rs765970018 | c.1429N>A | p.Val477Ile | p.V477I | Q96AE7 | protein_coding | tolerated(0.39) | benign(0.06) | TCGA-EW-A1IZ-01 | Breast | breast invasive carcinoma | Female | <65 | III/IV | Chemotherapy | taxotere | SD |
| TTC17 | insertion | Frame_Shift_Ins | novel | c.2137_2138insTATTATATATTAGTCTTTT | p.Arg713IlefsTer20 | p.R713Ifs*20 | Q96AE7 | protein_coding | | | TCGA-A8-A07L-01 | Breast | breast invasive carcinoma | Female | <65 | III/IV | Chemotherapy | | CR |


