
|
|||||
|
 | |
| |
| |
| |
| |
| |
|
Gene: TRIR |
Gene summary for TRIR |
| Gene information | Species | Human | Gene symbol | TRIR | Gene ID | 79002 |
| Gene name | telomerase RNA component interacting RNase | |
| Gene Alias | C19orf43 | |
| Cytomap | 19p13.13 | |
| Gene Type | protein-coding | GO ID | GO:0006139 | UniProtAcc | K7EN60 |
Top |
Malignant transformation analysis |
| Identification of the aberrant gene expression in precancerous and cancerous lesions by comparing the gene expression of stem-like cells in diseased tissues with normal stem cells |
| Entrez ID | Symbol | Replicates | Species | Organ | Tissue | Adj P-value | Log2FC | Malignancy |
| 79002 | TRIR | GSM4909282 | Human | Breast | IDC | 3.84e-29 | 6.89e-01 | -0.0288 |
| 79002 | TRIR | GSM4909285 | Human | Breast | IDC | 7.51e-86 | 1.07e+00 | 0.21 |
| 79002 | TRIR | GSM4909286 | Human | Breast | IDC | 5.56e-17 | 3.10e-01 | 0.1081 |
| 79002 | TRIR | GSM4909290 | Human | Breast | IDC | 2.76e-06 | 3.92e-01 | 0.2096 |
| 79002 | TRIR | GSM4909291 | Human | Breast | IDC | 8.18e-15 | 6.06e-01 | 0.1753 |
| 79002 | TRIR | GSM4909293 | Human | Breast | IDC | 1.28e-11 | 3.02e-01 | 0.1581 |
| 79002 | TRIR | GSM4909296 | Human | Breast | IDC | 4.18e-08 | 2.62e-01 | 0.1524 |
| 79002 | TRIR | GSM4909297 | Human | Breast | IDC | 7.16e-04 | -1.22e-01 | 0.1517 |
| 79002 | TRIR | GSM4909298 | Human | Breast | IDC | 4.15e-15 | 4.80e-01 | 0.1551 |
| 79002 | TRIR | GSM4909299 | Human | Breast | IDC | 9.58e-05 | 3.15e-01 | 0.035 |
| 79002 | TRIR | GSM4909300 | Human | Breast | IDC | 2.14e-02 | 3.16e-01 | 0.0334 |
| 79002 | TRIR | GSM4909301 | Human | Breast | IDC | 2.57e-06 | 3.72e-01 | 0.1577 |
| 79002 | TRIR | GSM4909304 | Human | Breast | IDC | 1.71e-13 | 4.34e-01 | 0.1636 |
| 79002 | TRIR | GSM4909305 | Human | Breast | IDC | 4.08e-05 | 2.72e-01 | 0.0436 |
| 79002 | TRIR | GSM4909307 | Human | Breast | IDC | 1.34e-05 | 3.69e-01 | 0.1569 |
| 79002 | TRIR | GSM4909308 | Human | Breast | IDC | 3.68e-19 | 4.90e-01 | 0.158 |
| 79002 | TRIR | GSM4909309 | Human | Breast | IDC | 1.14e-02 | 3.17e-01 | 0.0483 |
| 79002 | TRIR | GSM4909311 | Human | Breast | IDC | 1.04e-22 | -1.61e-01 | 0.1534 |
| 79002 | TRIR | GSM4909312 | Human | Breast | IDC | 7.28e-13 | 3.00e-01 | 0.1552 |
| 79002 | TRIR | GSM4909313 | Human | Breast | IDC | 2.44e-03 | 3.16e-01 | 0.0391 |
| Page: 1 2 3 4 5 6 7 8 9 10 11 |
| Tissue | Expression Dynamics | Abbreviation |
| Breast | 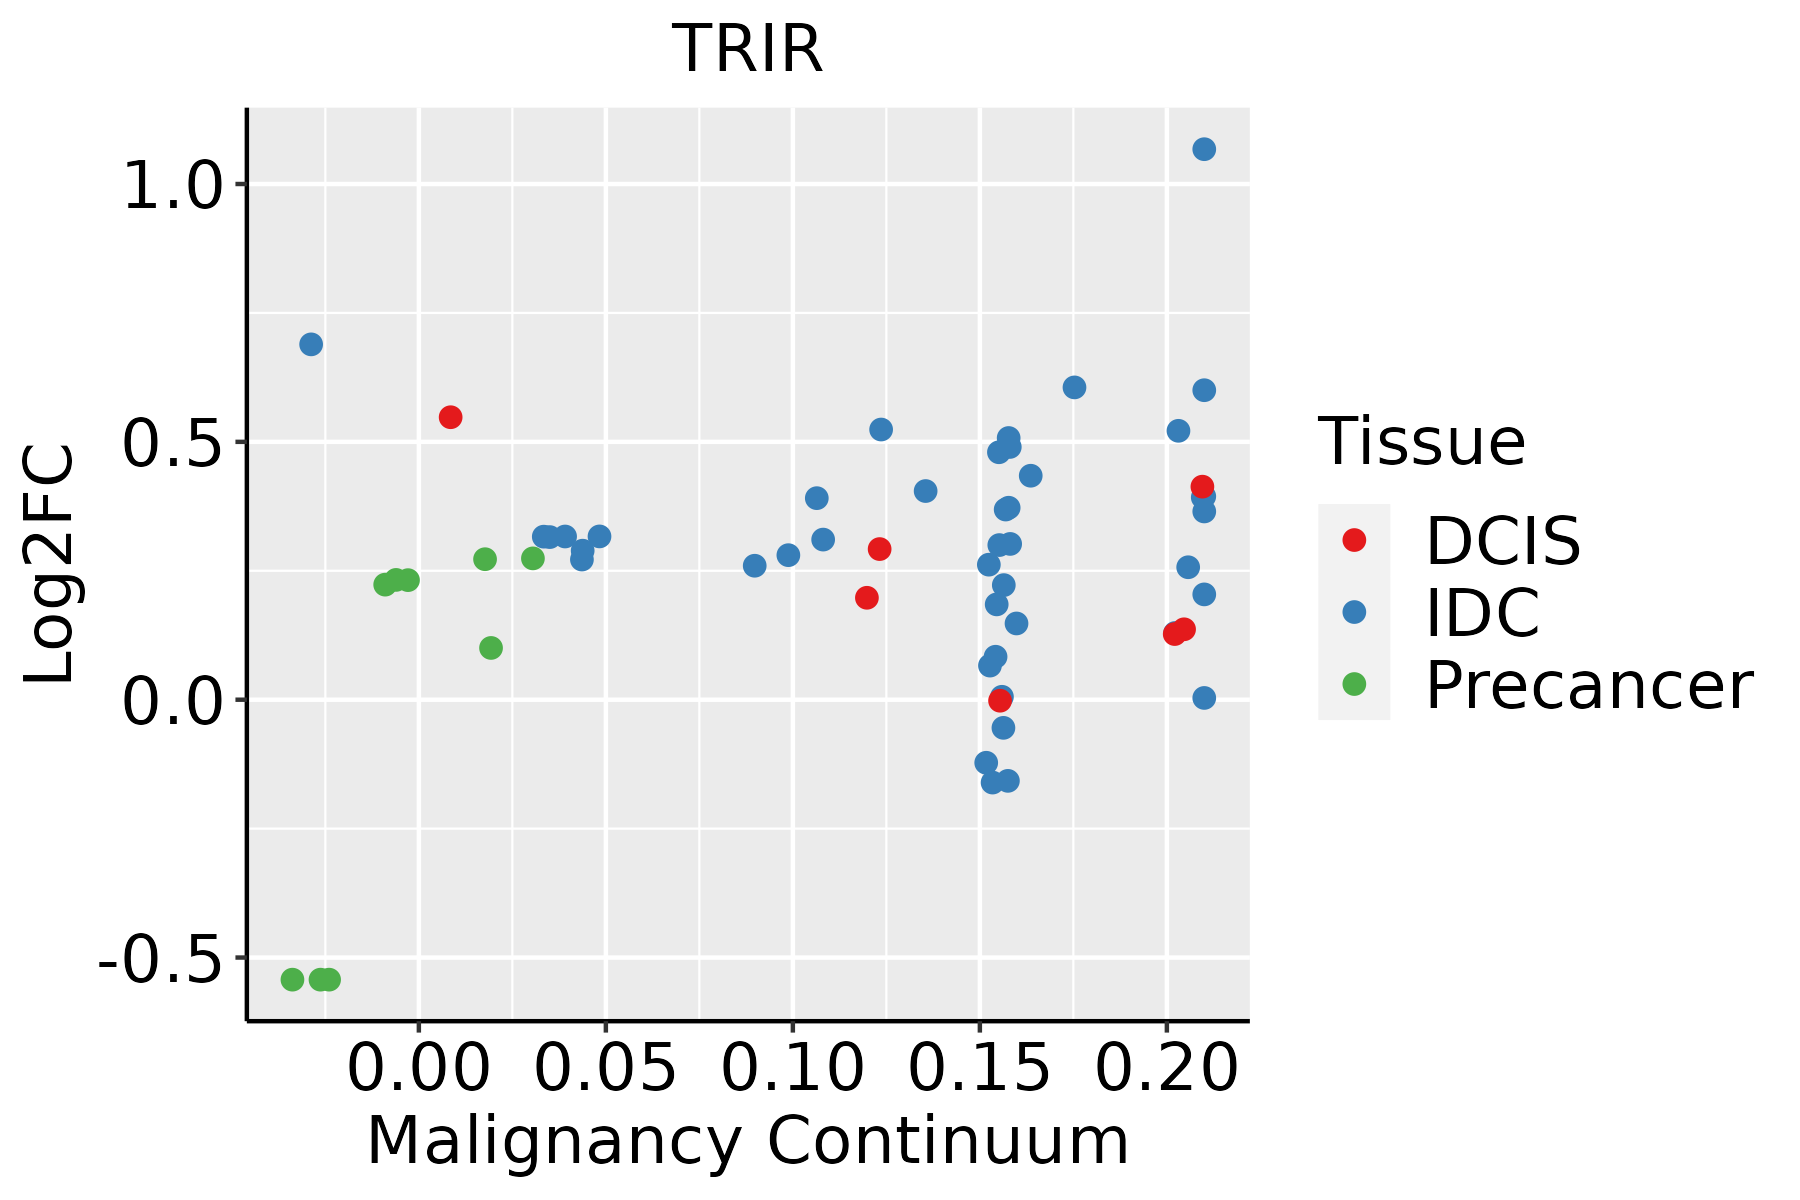 | IDC: Invasive ductal carcinoma |
| DCIS: Ductal carcinoma in situ | ||
| Precancer(BRCA1-mut): Precancerous lesion from BRCA1 mutation carriers | ||
| Cervix | 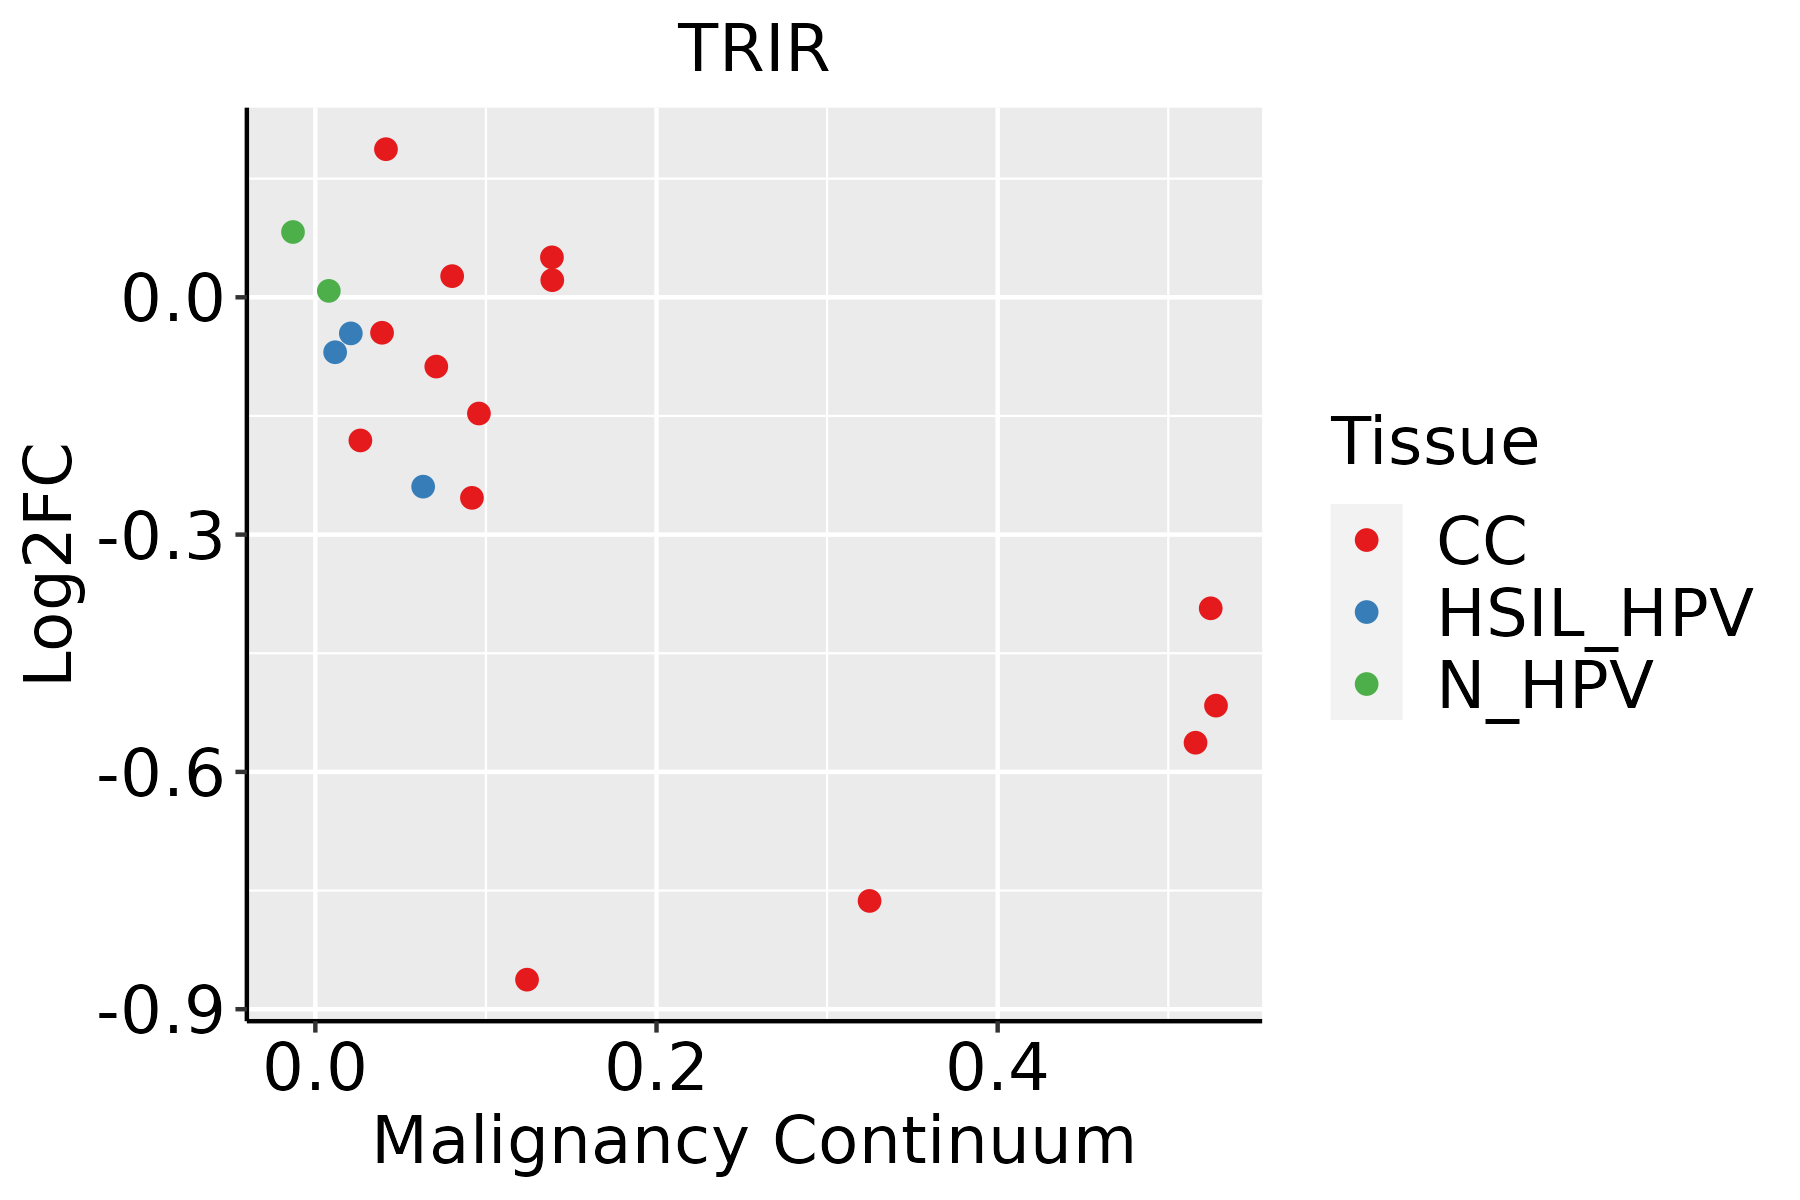 | CC: Cervix cancer |
| HSIL_HPV: HPV-infected high-grade squamous intraepithelial lesions | ||
| N_HPV: HPV-infected normal cervix | ||
| Colorectum (GSE201348) |  | FAP: Familial adenomatous polyposis |
| CRC: Colorectal cancer | ||
| Colorectum (HTA11) |  | AD: Adenomas |
| SER: Sessile serrated lesions | ||
| MSI-H: Microsatellite-high colorectal cancer | ||
| MSS: Microsatellite stable colorectal cancer | ||
| Endometrium | 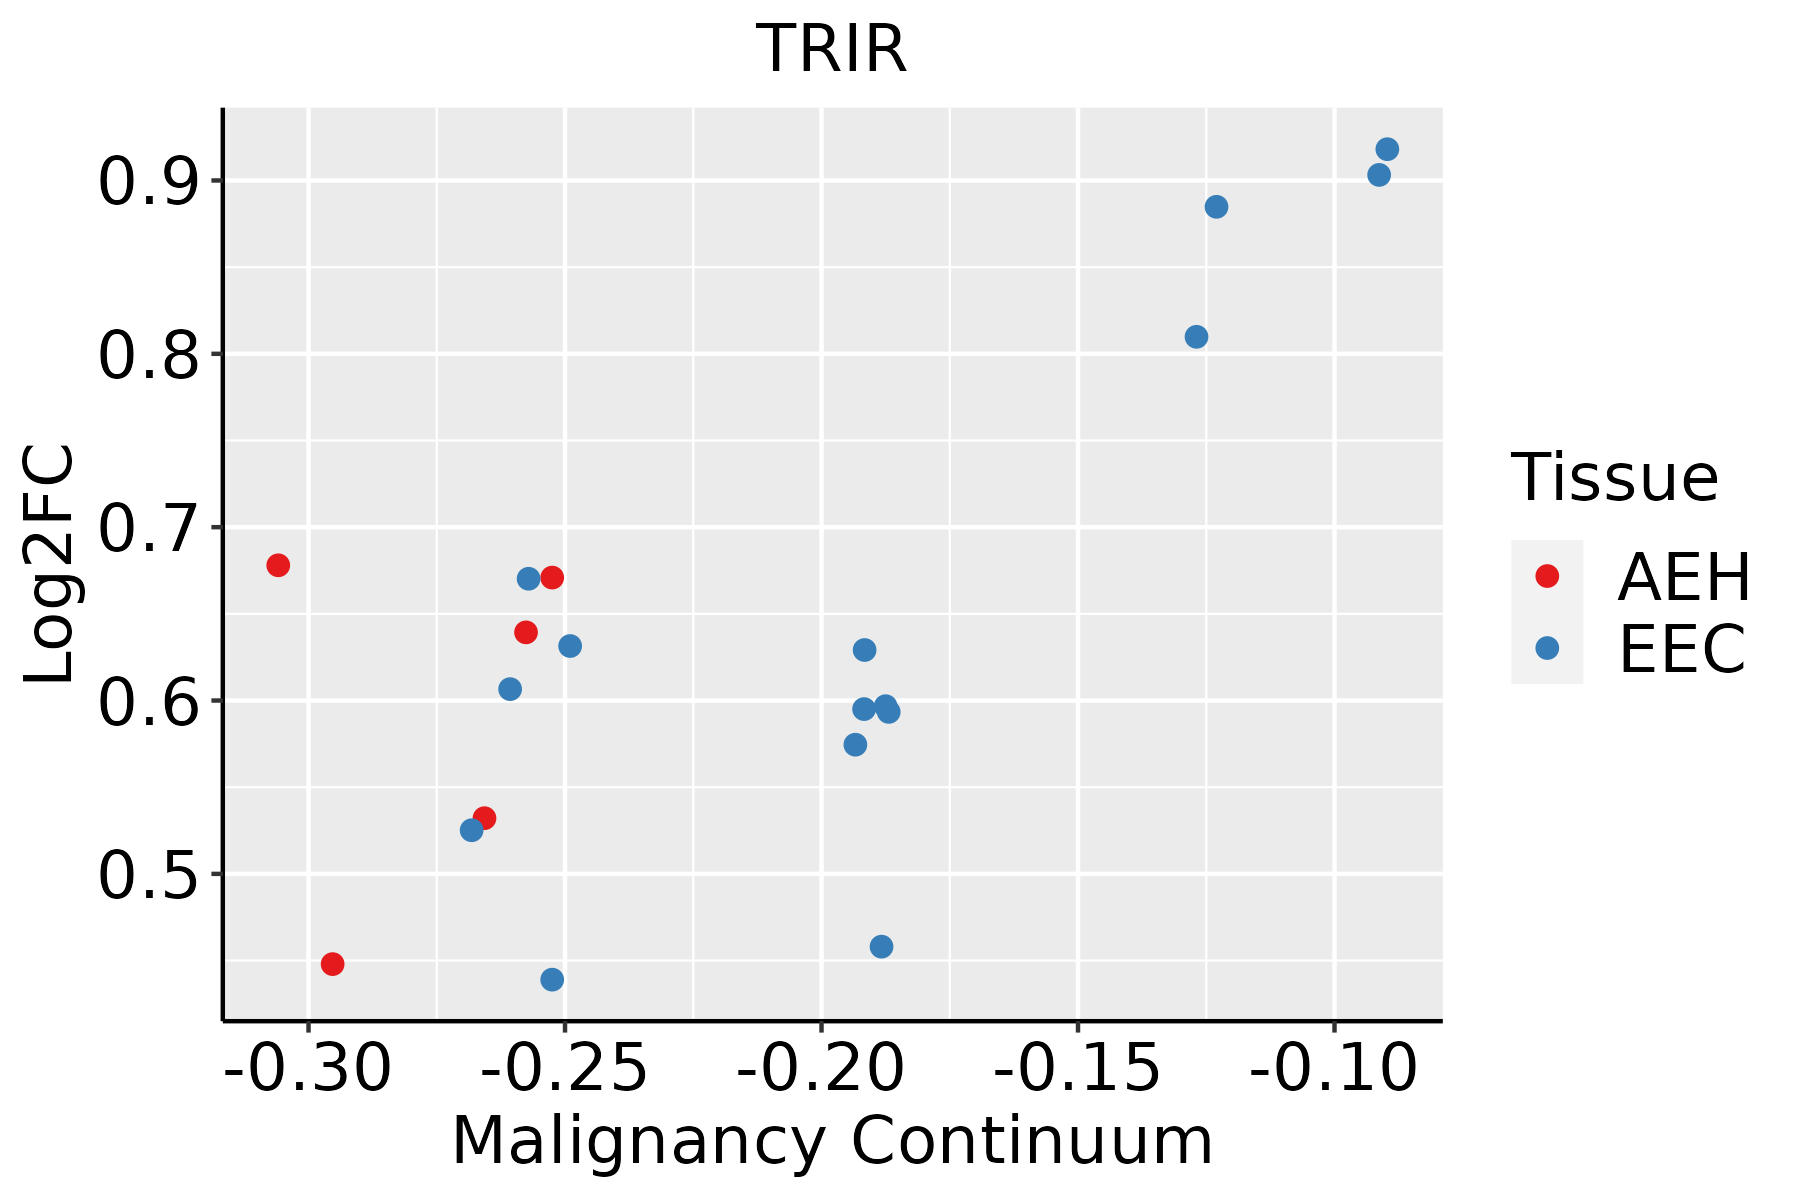 | AEH: Atypical endometrial hyperplasia |
| EEC: Endometrioid Cancer | ||
| Esophagus | 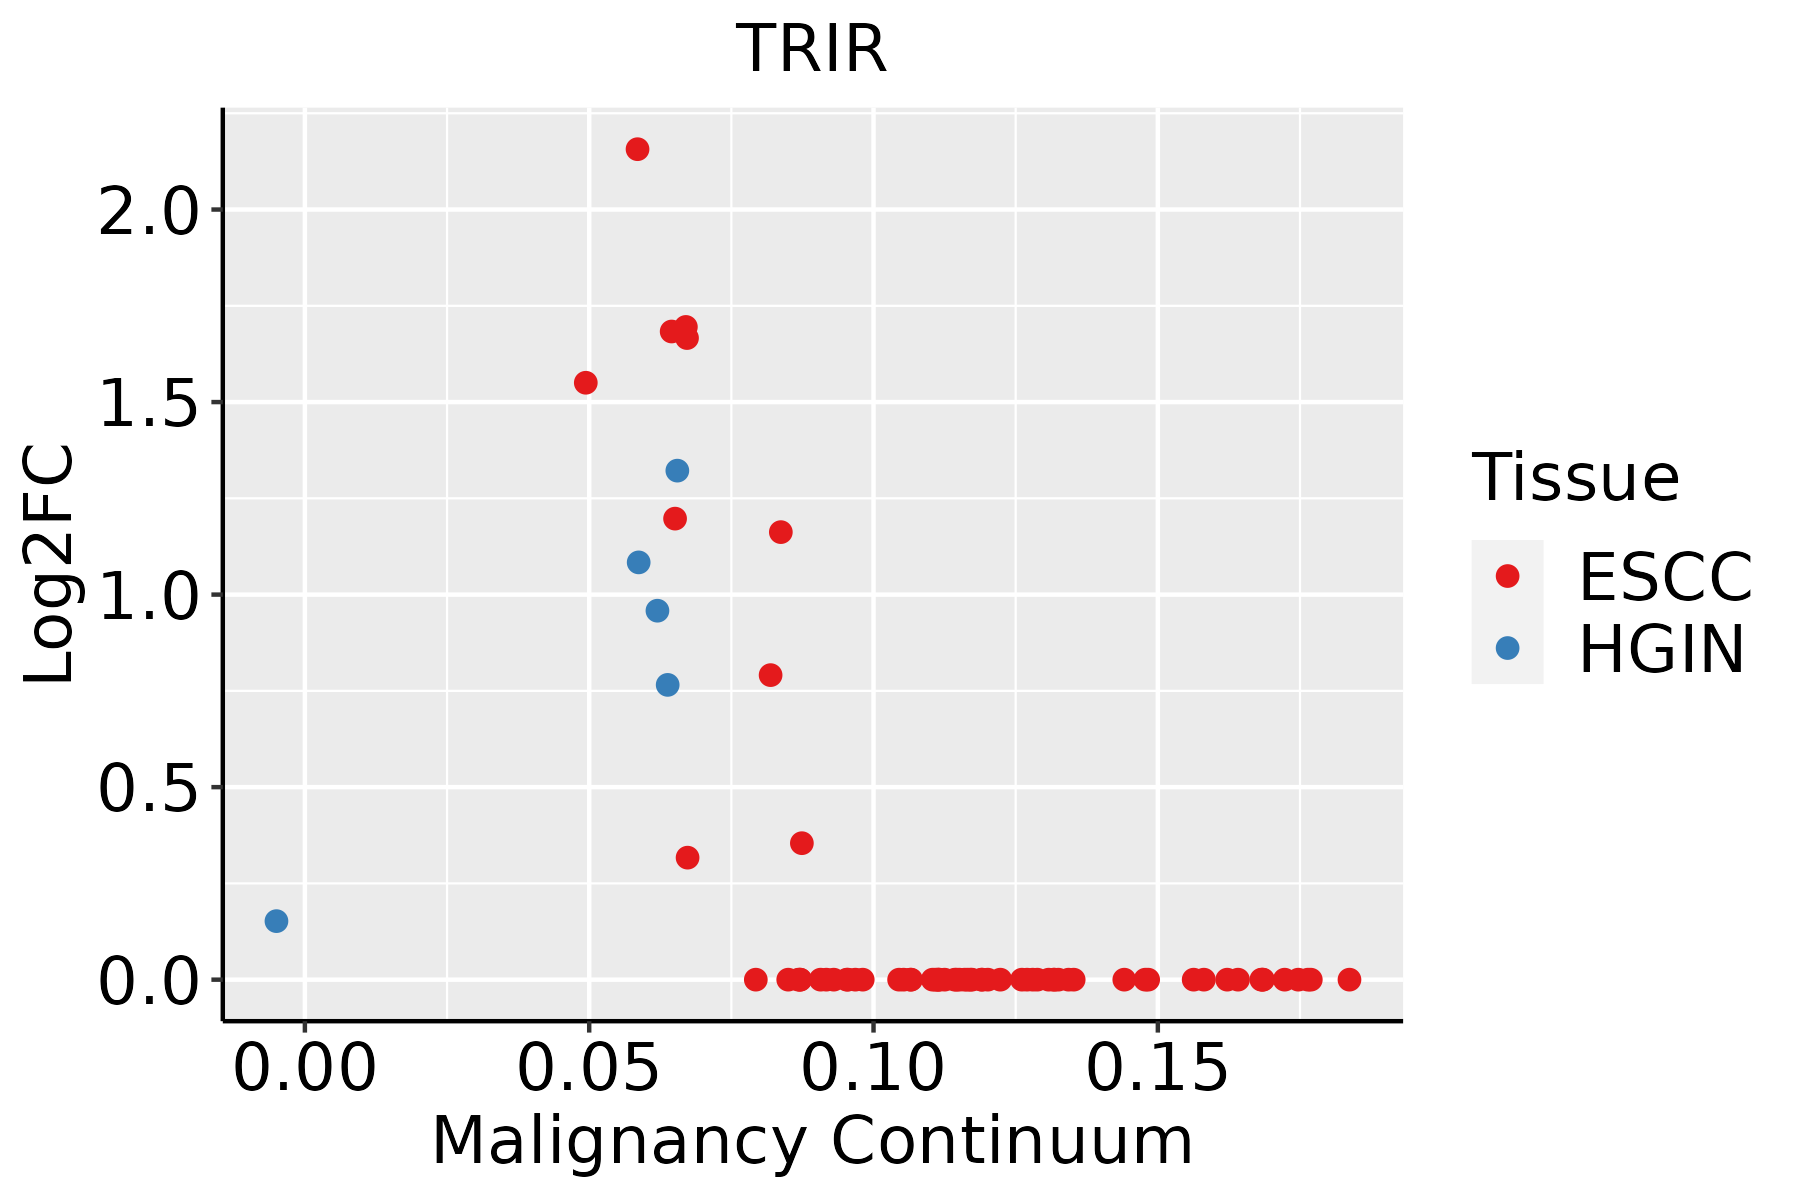 | ESCC: Esophageal squamous cell carcinoma |
| HGIN: High-grade intraepithelial neoplasias | ||
| LGIN: Low-grade intraepithelial neoplasias | ||
| GC | 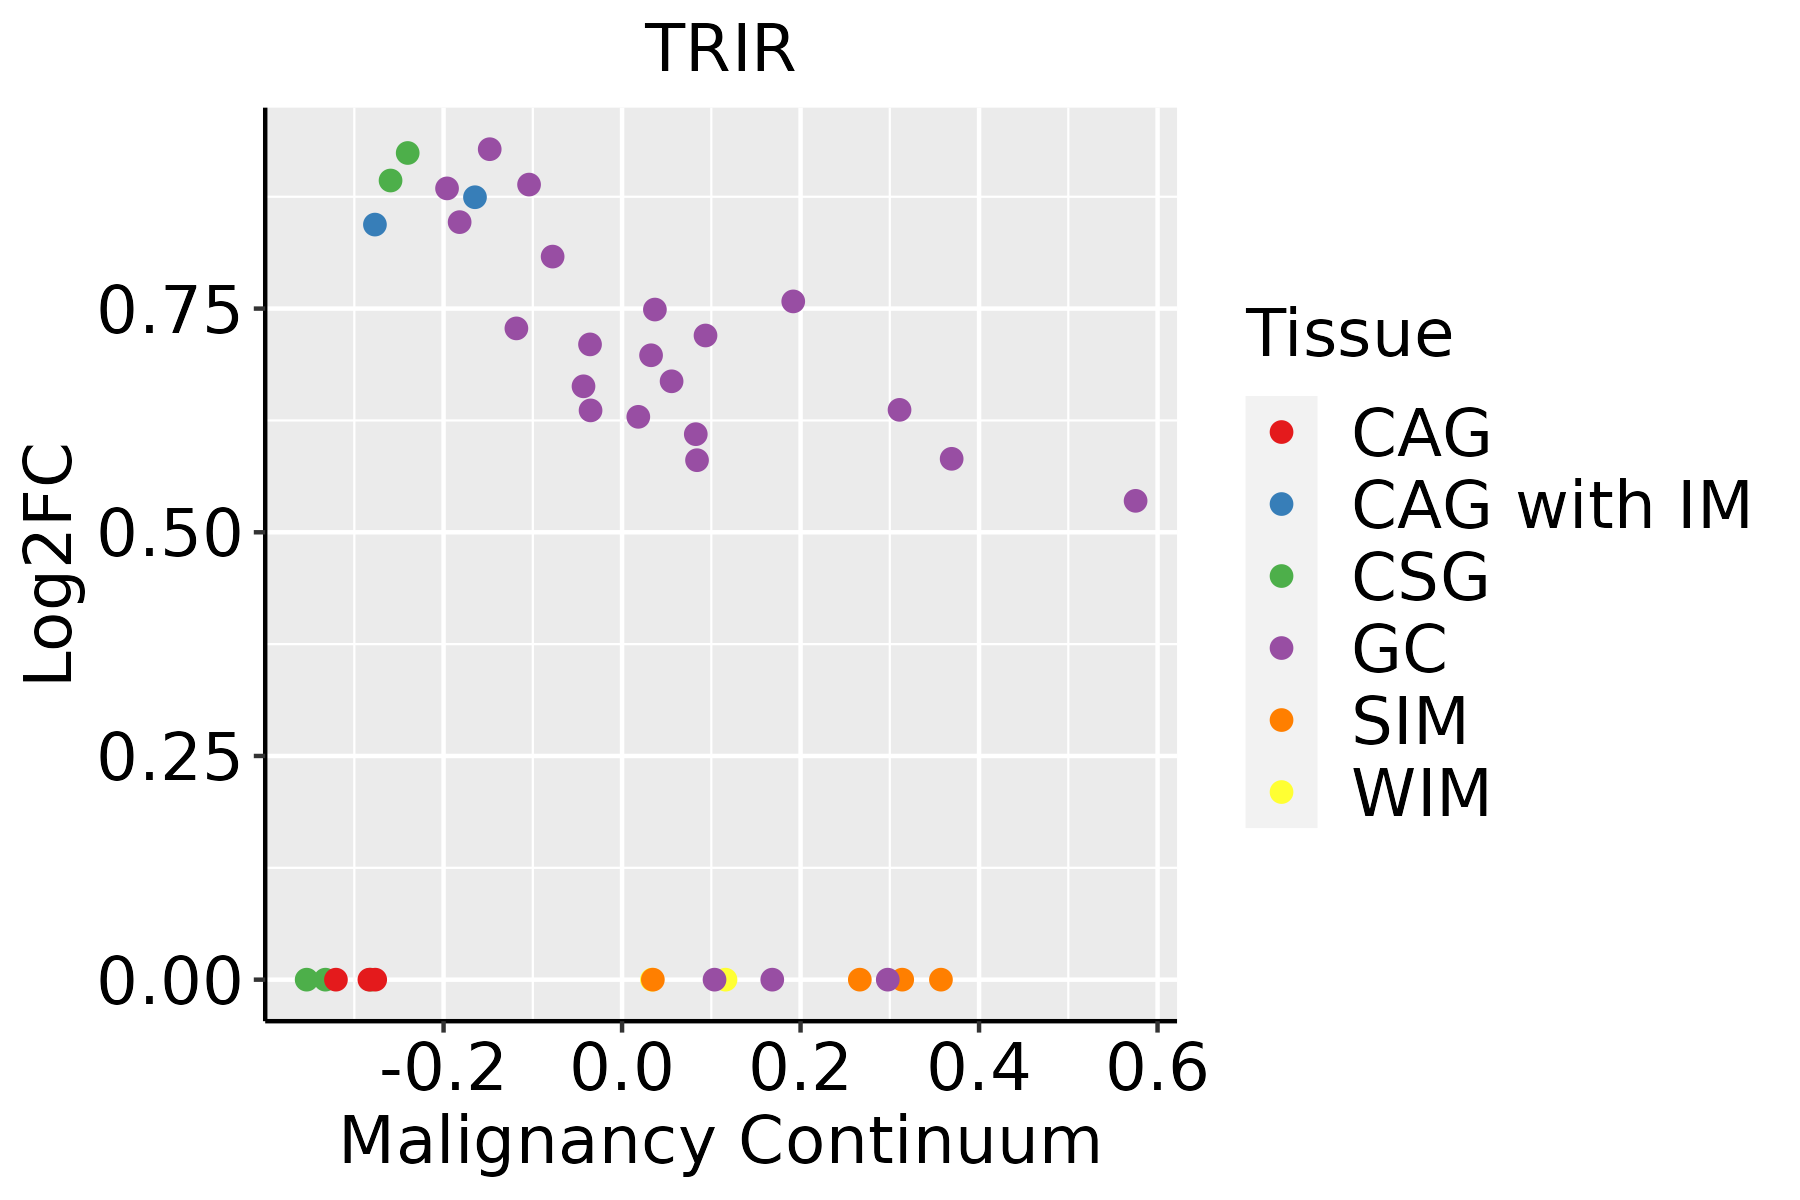 | CAG: Chronic atrophic gastritis |
| CAG with IM: Chronic atrophic gastritis with intestinal metaplasia | ||
| CSG: Chronic superficial gastritis | ||
| GC: Gastric cancer | ||
| SIM: Severe intestinal metaplasia | ||
| WIM: Wild intestinal metaplasia | ||
| Liver | 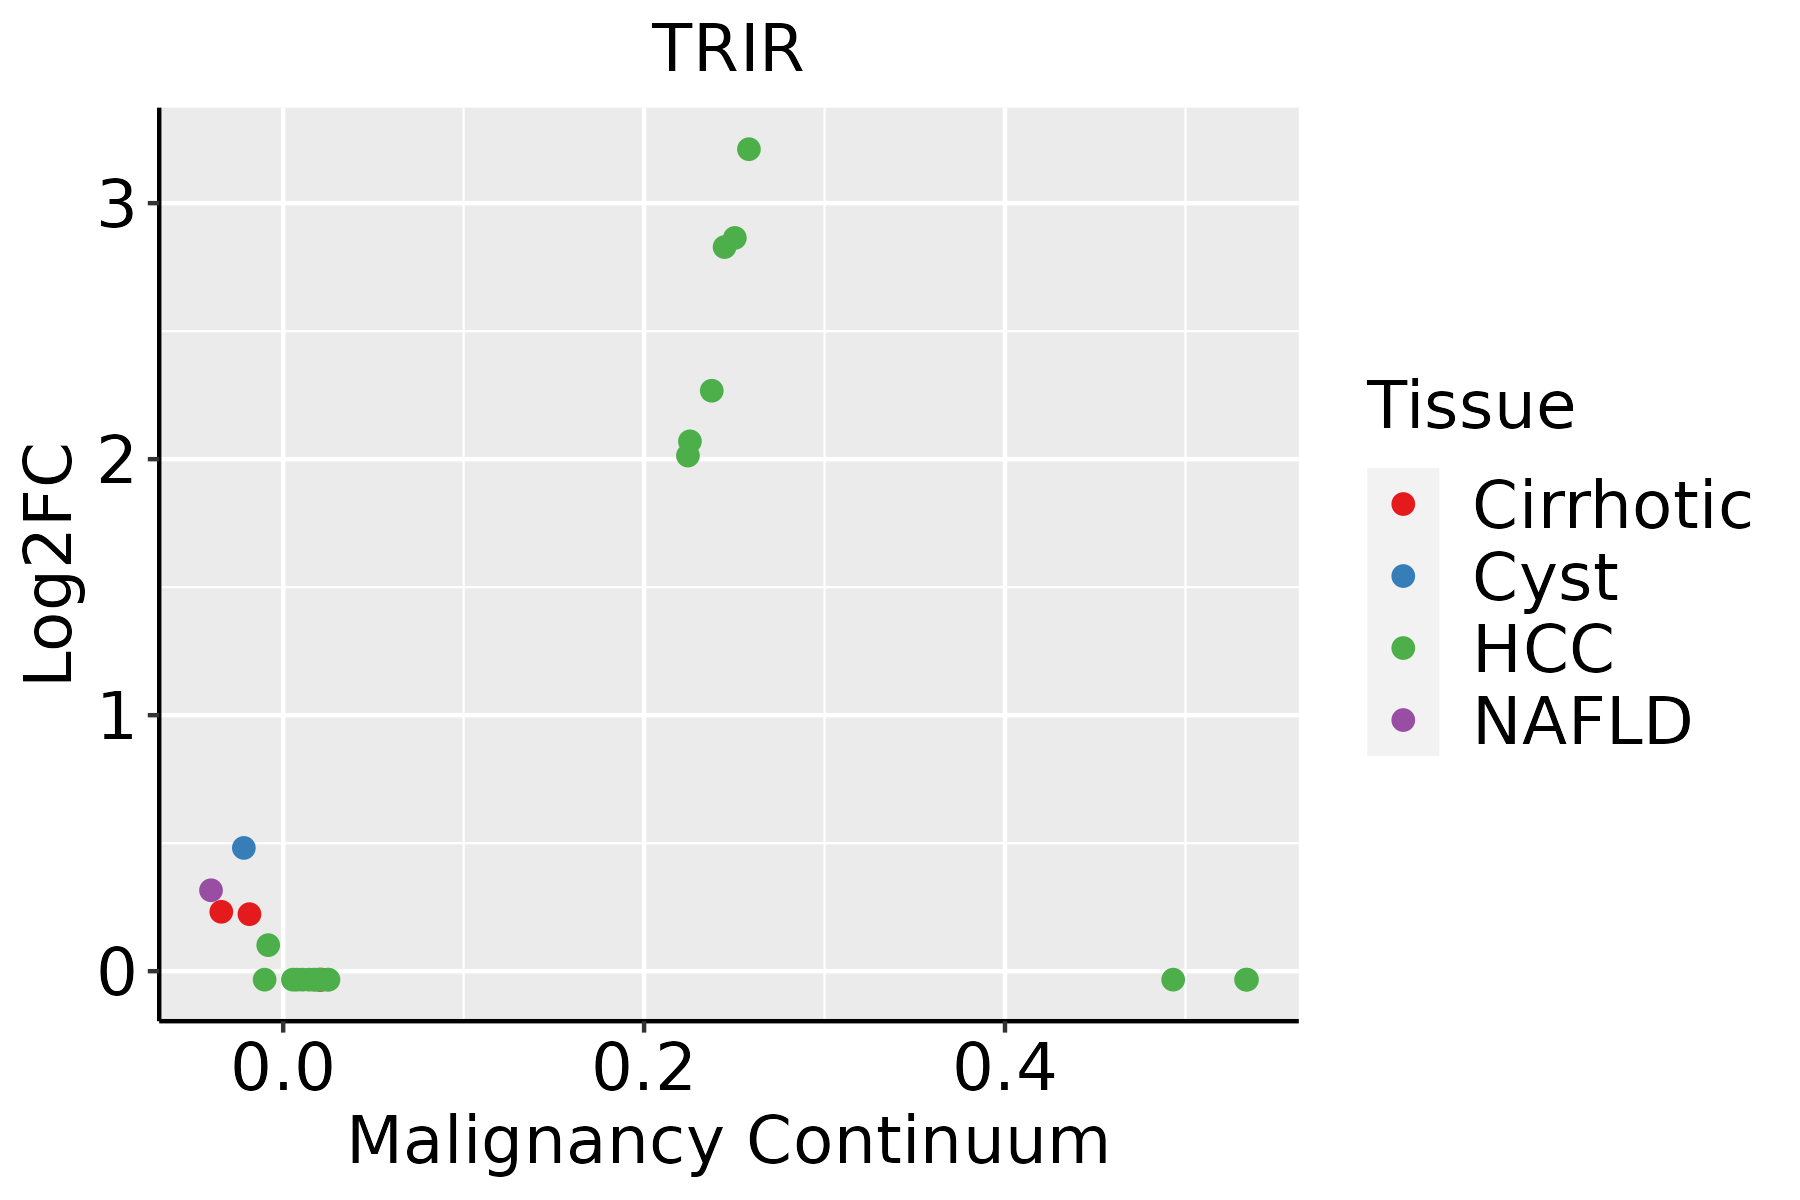 | HCC: Hepatocellular carcinoma |
| NAFLD: Non-alcoholic fatty liver disease | ||
| Prostate | 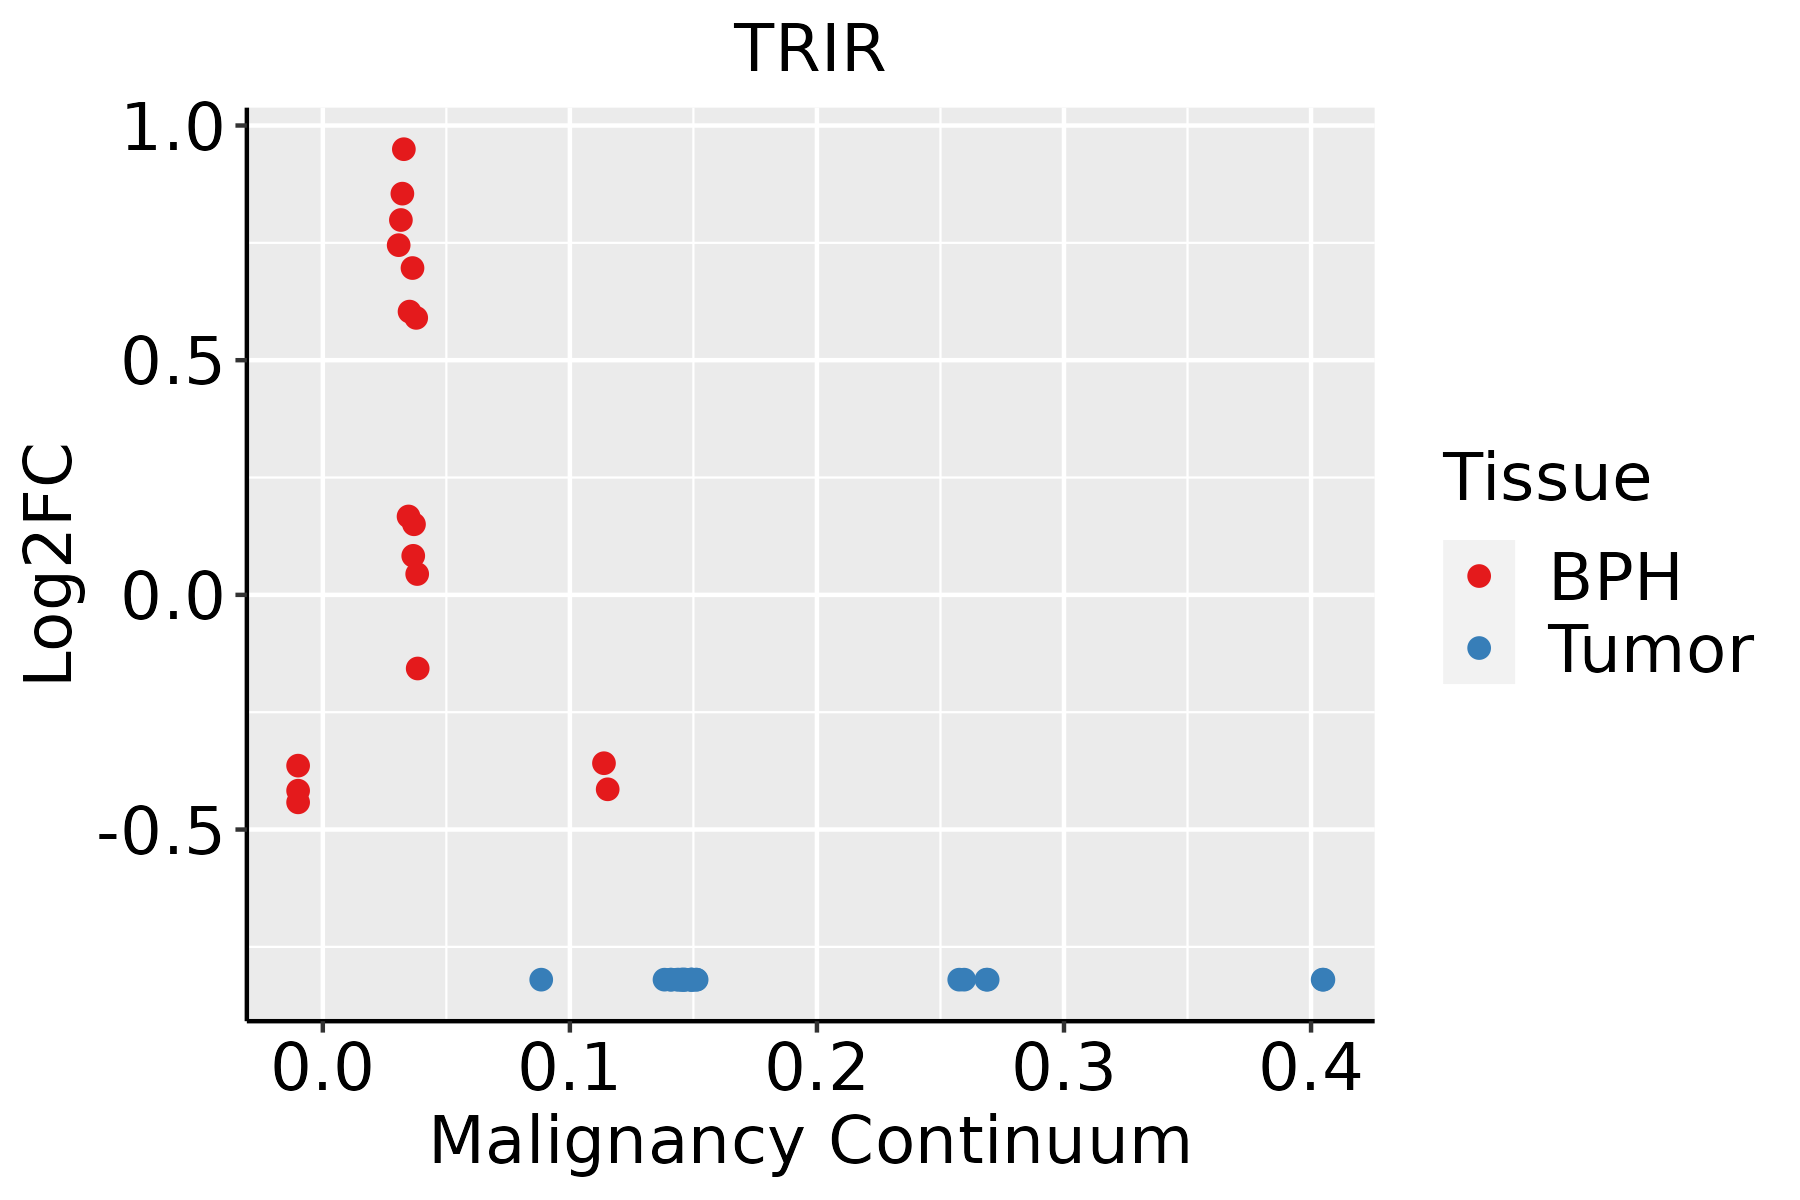 | BPH: Benign Prostatic Hyperplasia |
| Thyroid |  | ATC: Anaplastic thyroid cancer |
| HT: Hashimoto's thyroiditis | ||
| PTC: Papillary thyroid cancer |
| ∗log2FC in expression of this searched gene in stem-like cells from each diseased tissue sample relative to stem-like cells in normal samples in each tissue plotted against the malignancy continuum. Samples are colored based on if they are from different disease stage. |
Top |
Malignant transformation related pathway analysis |
| Find out the enriched GO biological processes and KEGG pathways involved in transition from healthy to precancer to cancer |
| Tissue | Disease Stage | Enriched GO biological Processes |
| Colorectum | AD |  |
| Colorectum | SER |  |
| Colorectum | MSS |  |
| Colorectum | MSI-H |  |
| Colorectum | FAP |  |
| ∗Top 15 enriched GO BP terms are showed in the bar plot of each disease state in each tissue. Each row represents a significant GO biological process which is colored according to the -log10(p.adjust). |
| Page: 1 2 3 4 5 6 7 8 9 |
| GO ID | Tissue | Disease Stage | Description | Gene Ratio | Bg Ratio | pvalue | p.adjust | Count |
| GO:19013619 | Endometrium | AEH | organic cyclic compound catabolic process | 83/2100 | 495/18723 | 1.13e-04 | 1.60e-03 | 83 |
| GO:000640115 | Endometrium | EEC | RNA catabolic process | 65/2168 | 278/18723 | 1.90e-08 | 1.16e-06 | 65 |
| GO:004427013 | Endometrium | EEC | cellular nitrogen compound catabolic process | 83/2168 | 451/18723 | 1.17e-05 | 2.43e-04 | 83 |
| GO:004670013 | Endometrium | EEC | heterocycle catabolic process | 82/2168 | 445/18723 | 1.26e-05 | 2.55e-04 | 82 |
| GO:003465514 | Endometrium | EEC | nucleobase-containing compound catabolic process | 76/2168 | 407/18723 | 1.61e-05 | 3.12e-04 | 76 |
| GO:001607216 | Endometrium | EEC | rRNA metabolic process | 49/2168 | 236/18723 | 3.27e-05 | 5.62e-04 | 49 |
| GO:001943913 | Endometrium | EEC | aromatic compound catabolic process | 83/2168 | 467/18723 | 4.32e-05 | 7.10e-04 | 83 |
| GO:190136113 | Endometrium | EEC | organic cyclic compound catabolic process | 86/2168 | 495/18723 | 7.31e-05 | 1.07e-03 | 86 |
| GO:001607219 | Esophagus | HGIN | rRNA metabolic process | 72/2587 | 236/18723 | 2.26e-11 | 2.56e-09 | 72 |
| GO:000640120 | Esophagus | HGIN | RNA catabolic process | 77/2587 | 278/18723 | 7.63e-10 | 6.36e-08 | 77 |
| GO:003465519 | Esophagus | HGIN | nucleobase-containing compound catabolic process | 98/2587 | 407/18723 | 1.44e-08 | 8.94e-07 | 98 |
| GO:004670017 | Esophagus | HGIN | heterocycle catabolic process | 103/2587 | 445/18723 | 5.44e-08 | 2.99e-06 | 103 |
| GO:004427018 | Esophagus | HGIN | cellular nitrogen compound catabolic process | 103/2587 | 451/18723 | 1.10e-07 | 5.56e-06 | 103 |
| GO:001943917 | Esophagus | HGIN | aromatic compound catabolic process | 105/2587 | 467/18723 | 1.89e-07 | 9.31e-06 | 105 |
| GO:190136117 | Esophagus | HGIN | organic cyclic compound catabolic process | 106/2587 | 495/18723 | 1.94e-06 | 7.13e-05 | 106 |
| GO:00346606 | Esophagus | HGIN | ncRNA metabolic process | 104/2587 | 485/18723 | 2.26e-06 | 8.23e-05 | 104 |
| GO:0016072110 | Esophagus | ESCC | rRNA metabolic process | 197/8552 | 236/18723 | 1.31e-33 | 1.18e-30 | 197 |
| GO:003466012 | Esophagus | ESCC | ncRNA metabolic process | 346/8552 | 485/18723 | 4.35e-31 | 2.51e-28 | 346 |
| GO:0006401110 | Esophagus | ESCC | RNA catabolic process | 204/8552 | 278/18723 | 3.39e-21 | 5.66e-19 | 204 |
| GO:0034655110 | Esophagus | ESCC | nucleobase-containing compound catabolic process | 272/8552 | 407/18723 | 2.92e-18 | 2.90e-16 | 272 |
| Page: 1 2 3 4 5 6 7 8 |
| Pathway ID | Tissue | Disease Stage | Description | Gene Ratio | Bg Ratio | pvalue | p.adjust | qvalue | Count |
| Page: 1 |
Top |
Cell-cell communication analysis |
| Identification of potential cell-cell interactions between two cell types and their ligand-receptor pairs for different disease states |
| Ligand | Receptor | LRpair | Pathway | Tissue | Disease Stage |
| Page: 1 |
Top |
Single-cell gene regulatory network inference analysis |
| Find out the significant the regulons (TFs) and the target genes of each regulon across cell types for different disease states |
| TF | Cell Type | Tissue | Disease Stage | Target Gene | RSS | Regulon Activity |
| ∗The dot plots of a searched regulon are shown for all cell subpopulations in each disease state of each tissue based on the regulon specific score inferred using pySCENIC and by calculating the average expression. |
| Page: 1 |
Top |
Somatic mutation of malignant transformation related genes |
| Annotation of somatic variants for genes involved in malignant transformation |
| Hugo Symbol | Variant Class | Variant Classification | dbSNP RS | HGVSc | HGVSp | HGVSp Short | SWISSPROT | BIOTYPE | SIFT | PolyPhen | Tumor Sample Barcode | Tissue | Histology | Sex | Age | Stage | Therapy Types | Drugs | Outcome |
| Page: 1 |
Top |
Related drugs of malignant transformation related genes |
| Identification of chemicals and drugs interact with genes involved in malignant transfromation |
| (DGIdb 4.0) |
| Entrez ID | Symbol | Category | Interaction Types | Drug Claim Name | Drug Name | PMIDs |
| Page: 1 |

Copyright 2023-Present -The University of Texas Health Science Center at Houston |