
|
|||||
|
 | |
| |
| |
| |
| |
| |
|
Gene: TRIP13 |
Gene summary for TRIP13 |
| Gene information | Species | Human | Gene symbol | TRIP13 | Gene ID | 9319 |
| Gene name | thyroid hormone receptor interactor 13 | |
| Gene Alias | 16E1BP | |
| Cytomap | 5p15.33 | |
| Gene Type | protein-coding | GO ID | GO:0000003 | UniProtAcc | Q15645 |
Top |
Malignant transformation analysis |
| Identification of the aberrant gene expression in precancerous and cancerous lesions by comparing the gene expression of stem-like cells in diseased tissues with normal stem cells |
| Entrez ID | Symbol | Replicates | Species | Organ | Tissue | Adj P-value | Log2FC | Malignancy |
| 9319 | TRIP13 | LZE2T | Human | Esophagus | ESCC | 1.52e-08 | 5.95e-01 | 0.082 |
| 9319 | TRIP13 | LZE8T | Human | Esophagus | ESCC | 2.72e-03 | 1.43e-01 | 0.067 |
| 9319 | TRIP13 | LZE22T | Human | Esophagus | ESCC | 1.57e-02 | 2.96e-01 | 0.068 |
| 9319 | TRIP13 | LZE24T | Human | Esophagus | ESCC | 9.19e-06 | 2.20e-01 | 0.0596 |
| 9319 | TRIP13 | LZE6T | Human | Esophagus | ESCC | 1.55e-08 | 3.84e-01 | 0.0845 |
| 9319 | TRIP13 | P1T-E | Human | Esophagus | ESCC | 4.62e-03 | 1.91e-01 | 0.0875 |
| 9319 | TRIP13 | P2T-E | Human | Esophagus | ESCC | 5.71e-10 | 2.92e-01 | 0.1177 |
| 9319 | TRIP13 | P4T-E | Human | Esophagus | ESCC | 4.58e-21 | 5.72e-01 | 0.1323 |
| 9319 | TRIP13 | P5T-E | Human | Esophagus | ESCC | 3.30e-21 | 5.03e-01 | 0.1327 |
| 9319 | TRIP13 | P8T-E | Human | Esophagus | ESCC | 5.67e-06 | 2.57e-01 | 0.0889 |
| 9319 | TRIP13 | P9T-E | Human | Esophagus | ESCC | 2.41e-06 | 1.96e-01 | 0.1131 |
| 9319 | TRIP13 | P10T-E | Human | Esophagus | ESCC | 3.19e-13 | 3.81e-01 | 0.116 |
| 9319 | TRIP13 | P15T-E | Human | Esophagus | ESCC | 5.26e-03 | 1.22e-01 | 0.1149 |
| 9319 | TRIP13 | P16T-E | Human | Esophagus | ESCC | 1.79e-02 | 1.12e-01 | 0.1153 |
| 9319 | TRIP13 | P17T-E | Human | Esophagus | ESCC | 3.52e-10 | 6.91e-01 | 0.1278 |
| 9319 | TRIP13 | P19T-E | Human | Esophagus | ESCC | 5.57e-05 | 6.85e-01 | 0.1662 |
| 9319 | TRIP13 | P20T-E | Human | Esophagus | ESCC | 2.16e-09 | 2.26e-01 | 0.1124 |
| 9319 | TRIP13 | P21T-E | Human | Esophagus | ESCC | 5.39e-24 | 7.38e-01 | 0.1617 |
| 9319 | TRIP13 | P22T-E | Human | Esophagus | ESCC | 5.35e-03 | 1.03e-01 | 0.1236 |
| 9319 | TRIP13 | P23T-E | Human | Esophagus | ESCC | 2.24e-10 | 2.71e-01 | 0.108 |
| Page: 1 2 3 4 5 |
| Tissue | Expression Dynamics | Abbreviation |
| Esophagus | 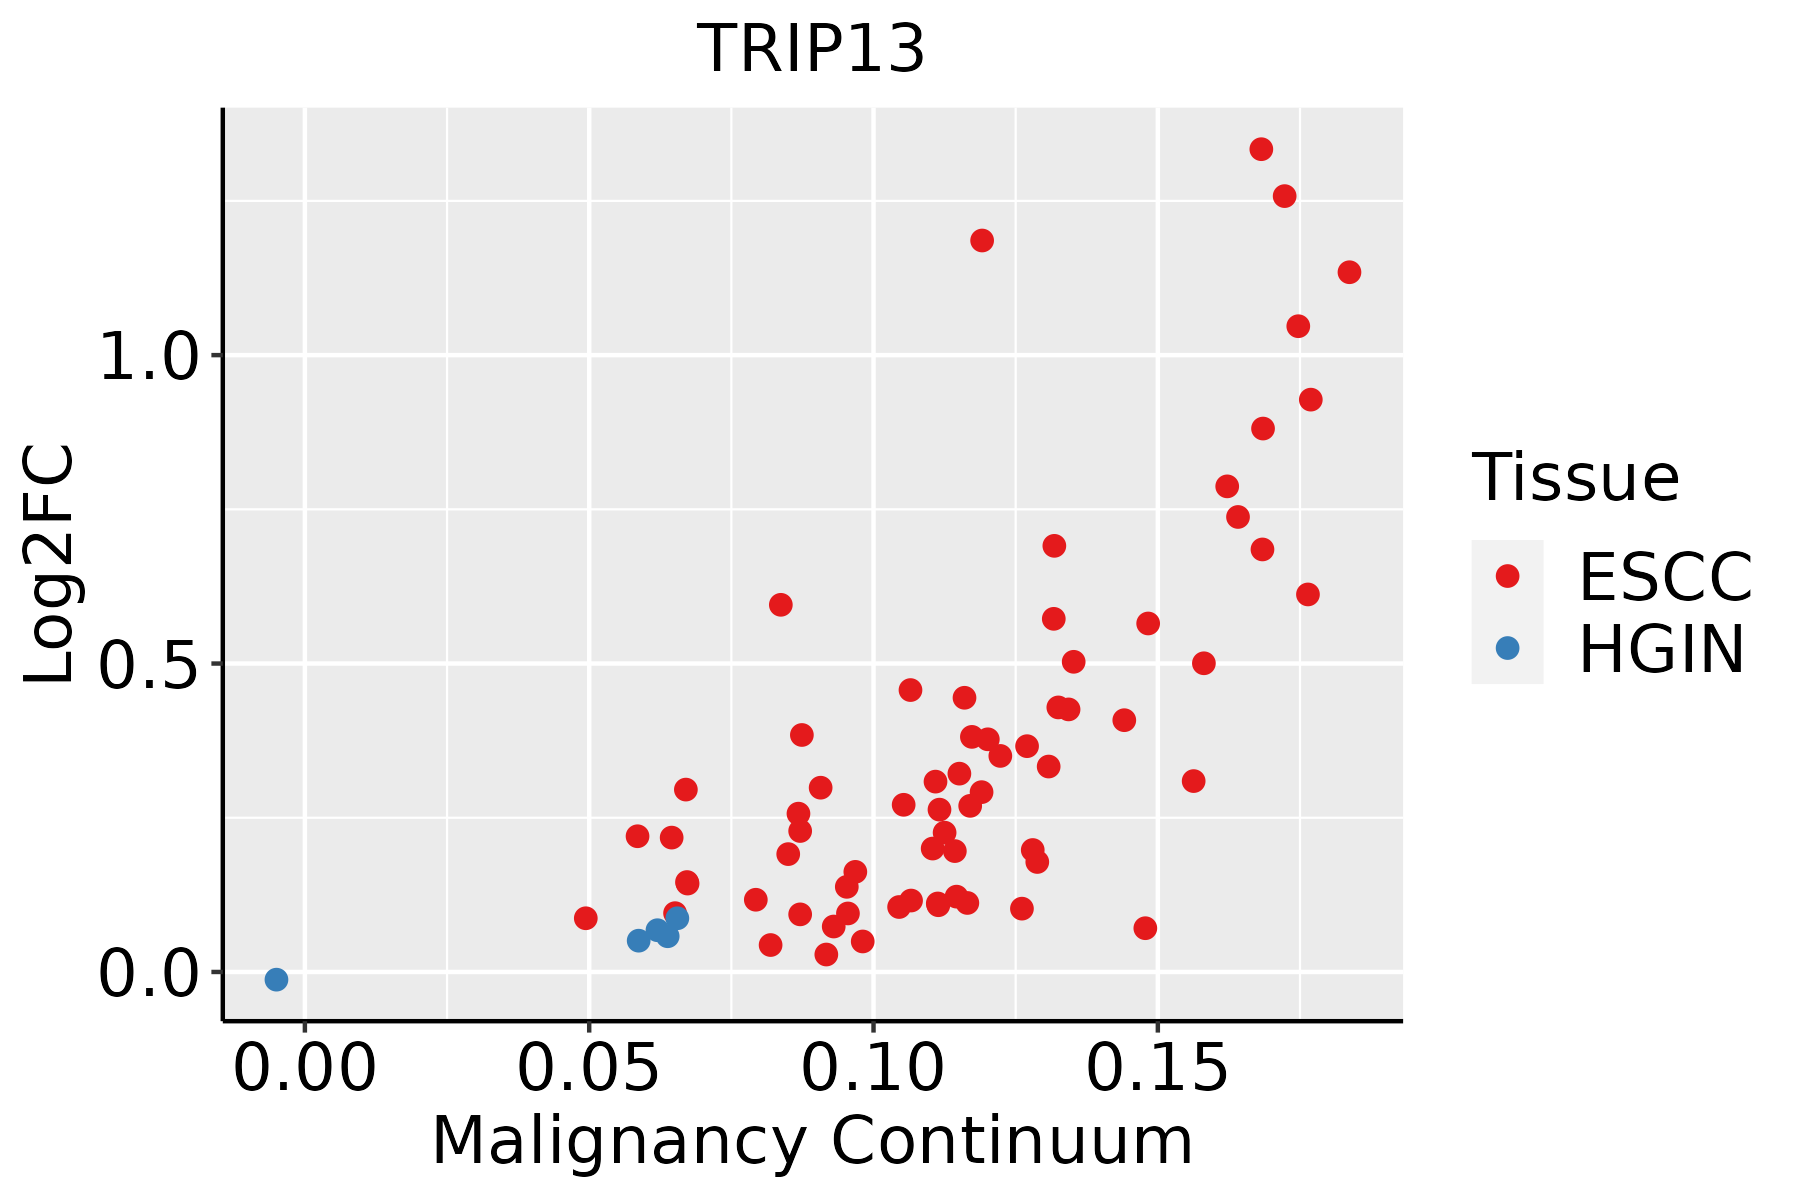 | ESCC: Esophageal squamous cell carcinoma |
| HGIN: High-grade intraepithelial neoplasias | ||
| LGIN: Low-grade intraepithelial neoplasias | ||
| Liver | 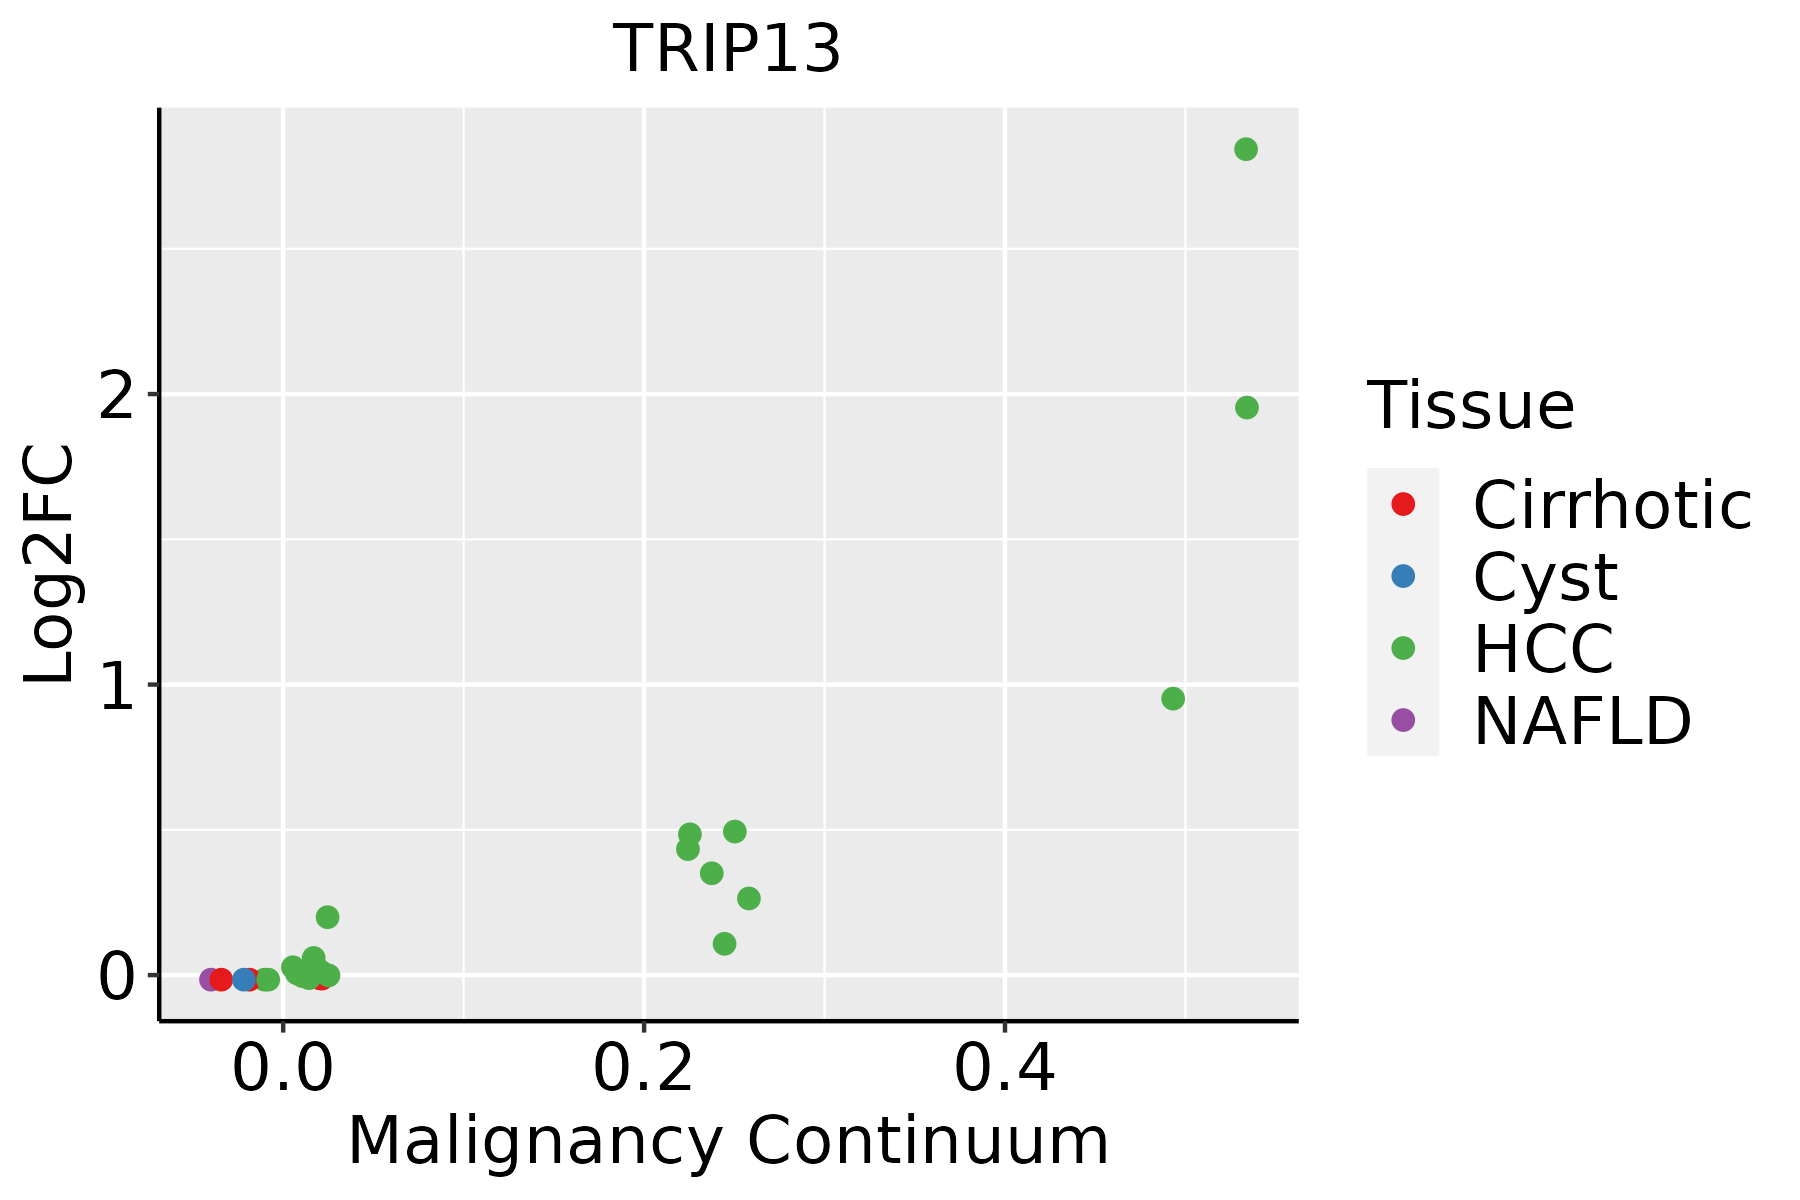 | HCC: Hepatocellular carcinoma |
| NAFLD: Non-alcoholic fatty liver disease | ||
| Oral Cavity | 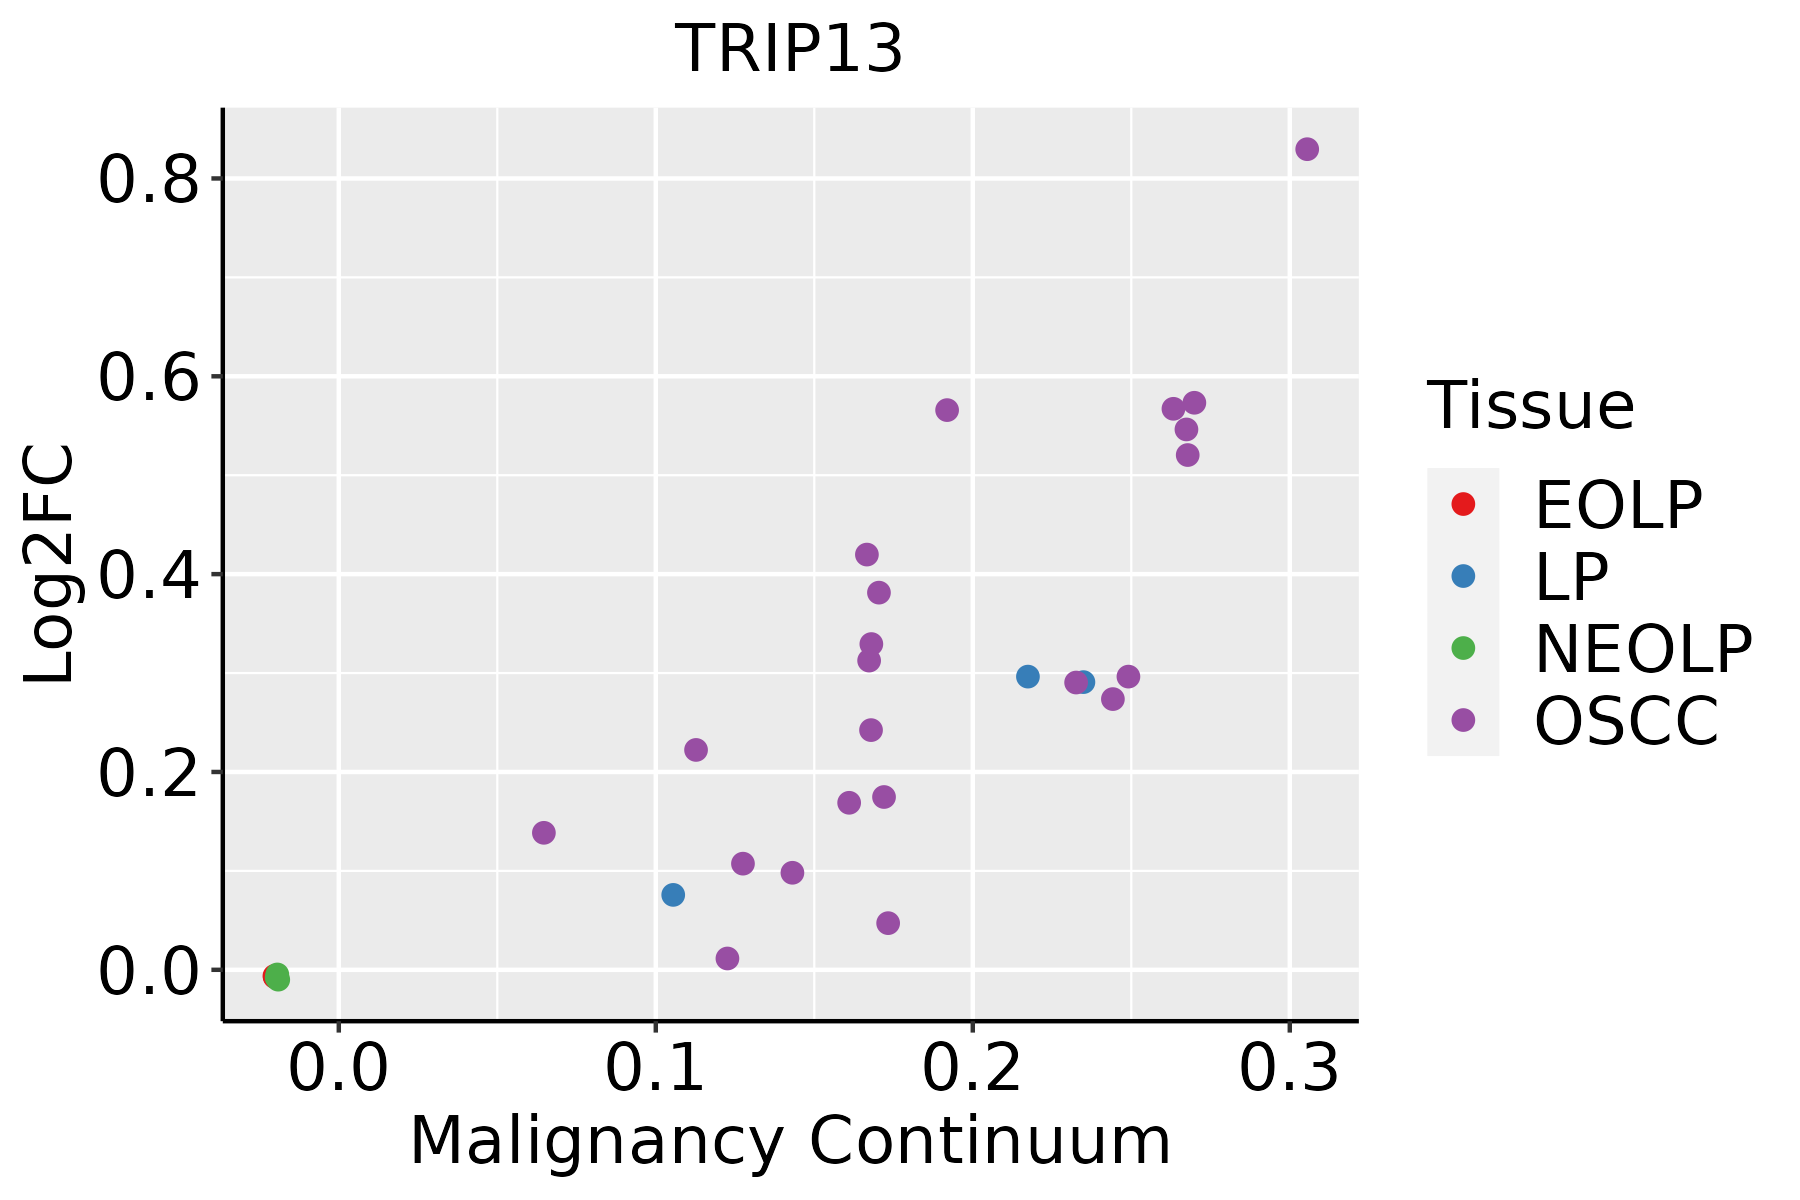 | EOLP: Erosive Oral lichen planus |
| LP: leukoplakia | ||
| NEOLP: Non-erosive oral lichen planus | ||
| OSCC: Oral squamous cell carcinoma | ||
| Skin | 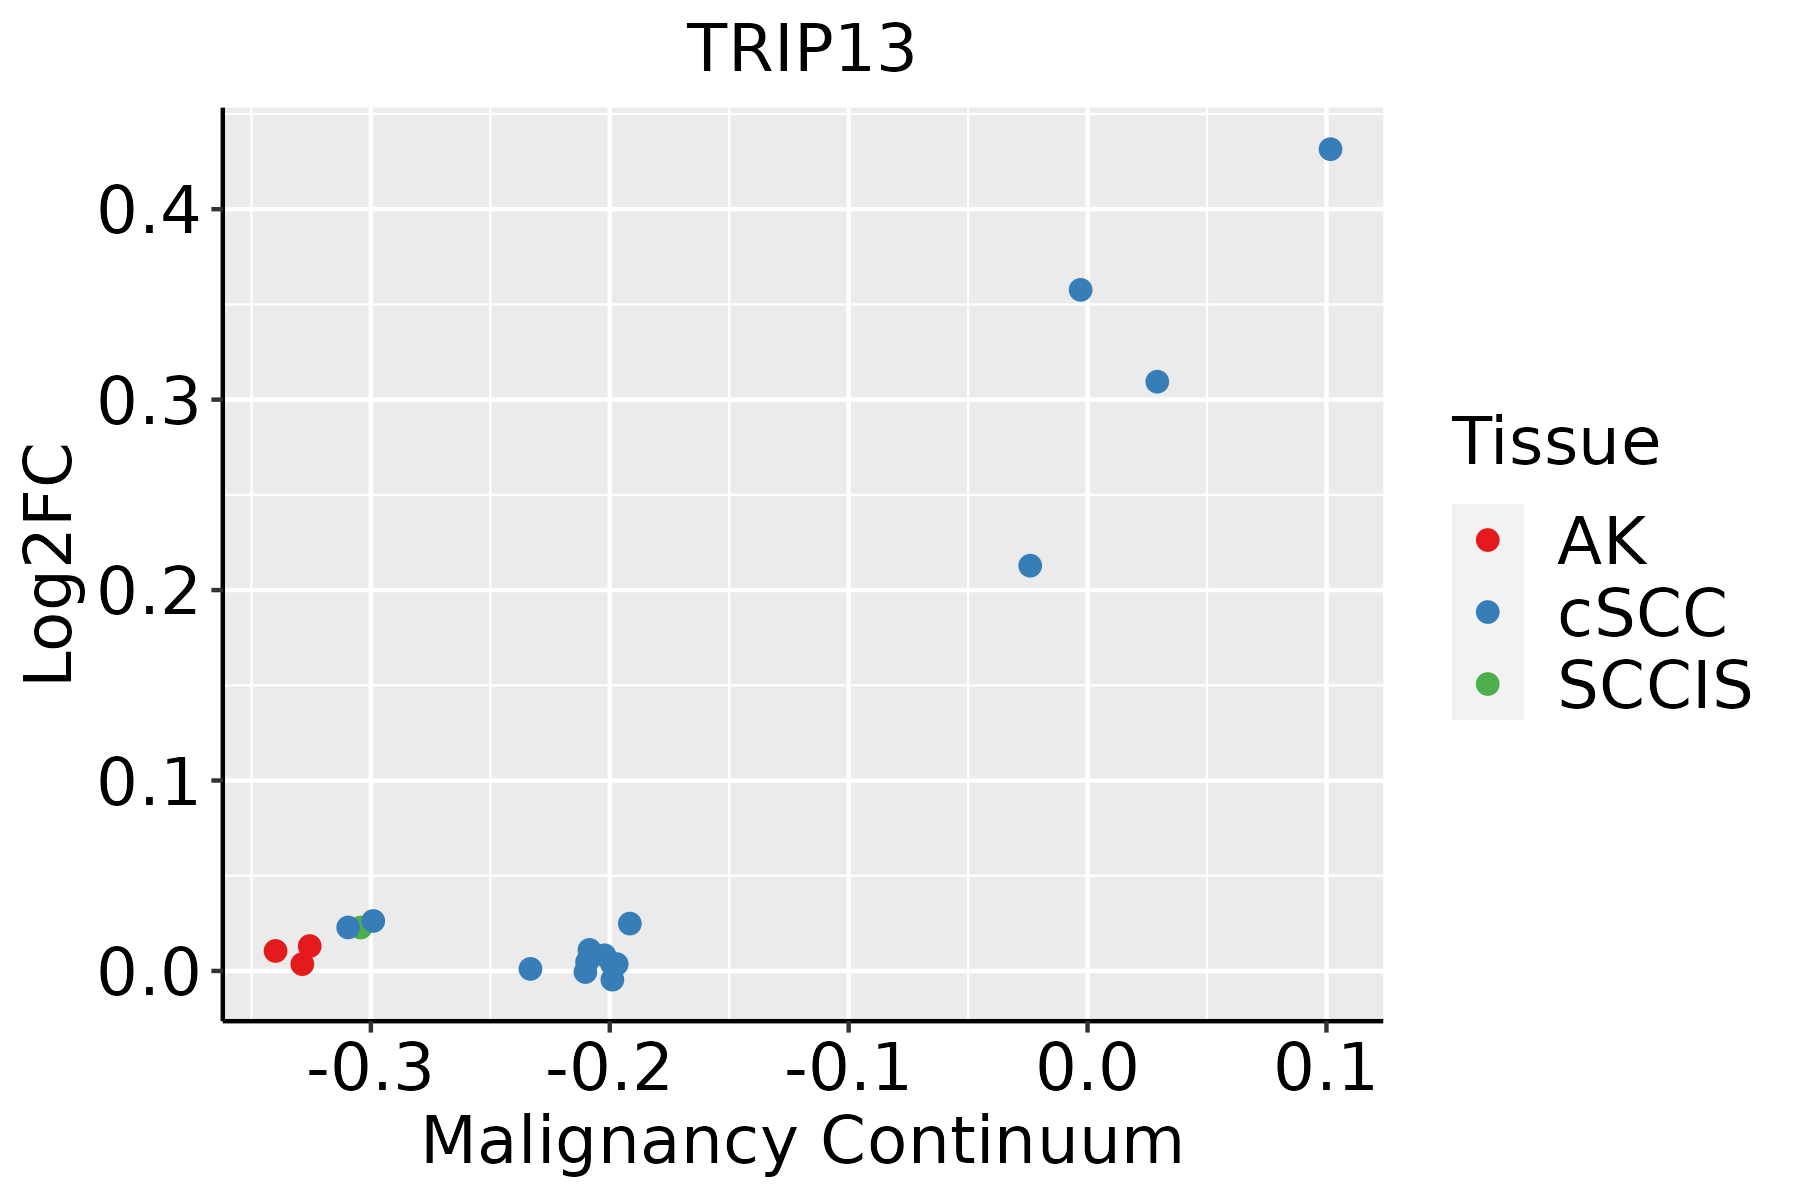 | AK: Actinic keratosis |
| cSCC: Cutaneous squamous cell carcinoma | ||
| SCCIS:squamous cell carcinoma in situ | ||
| Thyroid | 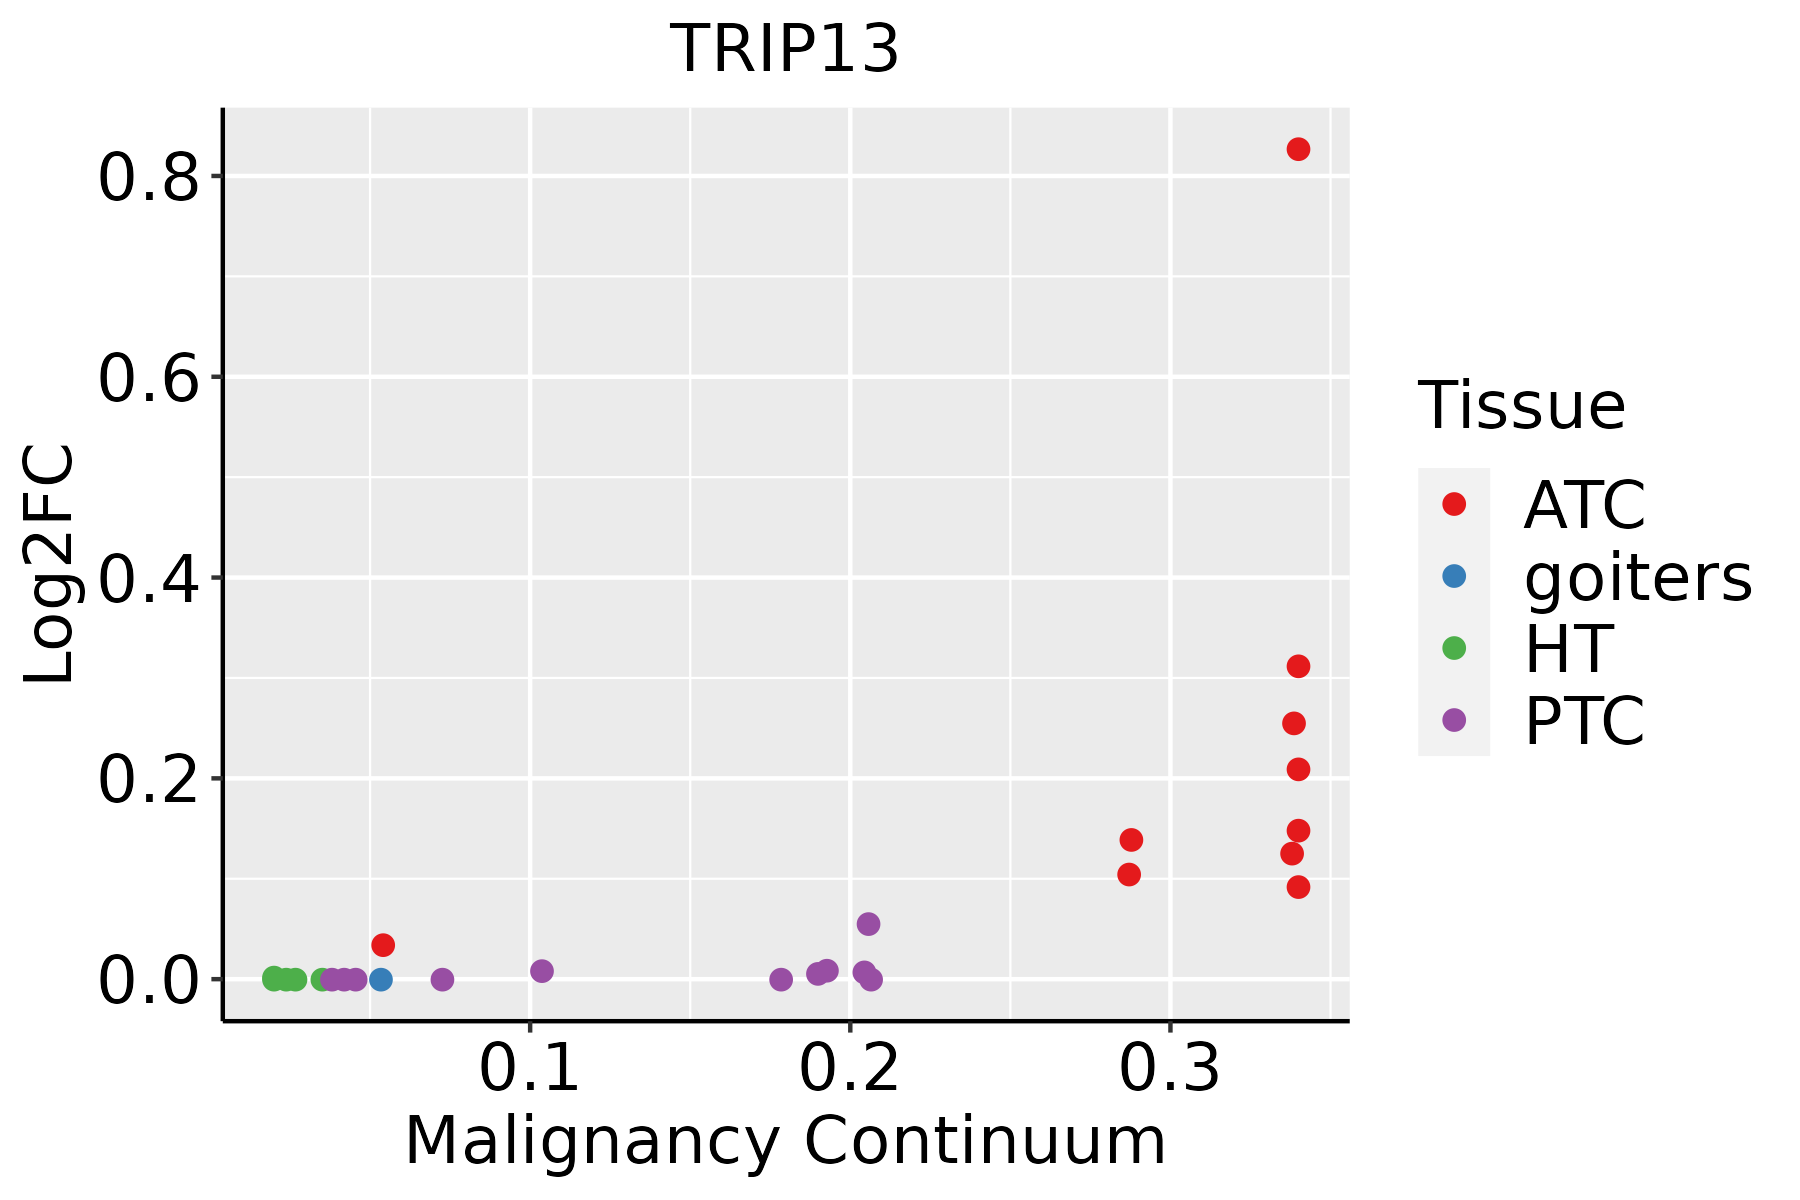 | ATC: Anaplastic thyroid cancer |
| HT: Hashimoto's thyroiditis | ||
| PTC: Papillary thyroid cancer |
| ∗log2FC in expression of this searched gene in stem-like cells from each diseased tissue sample relative to stem-like cells in normal samples in each tissue plotted against the malignancy continuum. Samples are colored based on if they are from different disease stage. |
Top |
Malignant transformation related pathway analysis |
| Find out the enriched GO biological processes and KEGG pathways involved in transition from healthy to precancer to cancer |
| Tissue | Disease Stage | Enriched GO biological Processes |
| Colorectum | AD |  |
| Colorectum | SER |  |
| Colorectum | MSS |  |
| Colorectum | MSI-H |  |
| Colorectum | FAP |  |
| ∗Top 15 enriched GO BP terms are showed in the bar plot of each disease state in each tissue. Each row represents a significant GO biological process which is colored according to the -log10(p.adjust). |
| Page: 1 2 3 4 5 6 7 8 9 |
| GO ID | Tissue | Disease Stage | Description | Gene Ratio | Bg Ratio | pvalue | p.adjust | Count |
| GO:00000751 | Liver | HCC | cell cycle checkpoint | 100/7958 | 169/18723 | 8.75e-06 | 1.02e-04 | 100 |
| GO:0048285 | Liver | HCC | organelle fission | 254/7958 | 488/18723 | 1.07e-05 | 1.23e-04 | 254 |
| GO:0045786 | Liver | HCC | negative regulation of cell cycle | 204/7958 | 385/18723 | 1.84e-05 | 1.99e-04 | 204 |
| GO:0045930 | Liver | HCC | negative regulation of mitotic cell cycle | 130/7958 | 235/18723 | 4.69e-05 | 4.50e-04 | 130 |
| GO:2001251 | Liver | HCC | negative regulation of chromosome organization | 55/7958 | 86/18723 | 4.80e-05 | 4.60e-04 | 55 |
| GO:0007091 | Liver | HCC | metaphase/anaphase transition of mitotic cell cycle | 42/7958 | 62/18723 | 5.18e-05 | 4.93e-04 | 42 |
| GO:0007093 | Liver | HCC | mitotic cell cycle checkpoint | 77/7958 | 129/18723 | 6.00e-05 | 5.50e-04 | 77 |
| GO:1905818 | Liver | HCC | regulation of chromosome separation | 47/7958 | 72/18723 | 7.95e-05 | 7.07e-04 | 47 |
| GO:0051983 | Liver | HCC | regulation of chromosome segregation | 57/7958 | 91/18723 | 8.35e-05 | 7.36e-04 | 57 |
| GO:0010965 | Liver | HCC | regulation of mitotic sister chromatid separation | 43/7958 | 65/18723 | 9.99e-05 | 8.60e-04 | 43 |
| GO:0051306 | Liver | HCC | mitotic sister chromatid separation | 44/7958 | 67/18723 | 1.08e-04 | 9.22e-04 | 44 |
| GO:0030071 | Liver | HCC | regulation of mitotic metaphase/anaphase transition | 40/7958 | 60/18723 | 1.34e-04 | 1.10e-03 | 40 |
| GO:0033045 | Liver | HCC | regulation of sister chromatid segregation | 46/7958 | 72/18723 | 2.02e-04 | 1.56e-03 | 46 |
| GO:0044784 | Liver | HCC | metaphase/anaphase transition of cell cycle | 42/7958 | 65/18723 | 2.63e-04 | 1.94e-03 | 42 |
| GO:1901988 | Liver | HCC | negative regulation of cell cycle phase transition | 132/7958 | 249/18723 | 4.97e-04 | 3.25e-03 | 132 |
| GO:0033047 | Liver | HCC | regulation of mitotic sister chromatid segregation | 31/7958 | 46/18723 | 5.67e-04 | 3.61e-03 | 31 |
| GO:0045839 | Liver | HCC | negative regulation of mitotic nuclear division | 32/7958 | 48/18723 | 6.21e-04 | 3.86e-03 | 32 |
| GO:1902099 | Liver | HCC | regulation of metaphase/anaphase transition of cell cycle | 40/7958 | 63/18723 | 6.22e-04 | 3.86e-03 | 40 |
| GO:0000280 | Liver | HCC | nuclear division | 220/7958 | 439/18723 | 6.90e-04 | 4.25e-03 | 220 |
| GO:0010948 | Liver | HCC | negative regulation of cell cycle process | 152/7958 | 294/18723 | 8.50e-04 | 5.08e-03 | 152 |
| Page: 1 2 3 4 5 6 7 8 9 10 11 12 13 |
| Pathway ID | Tissue | Disease Stage | Description | Gene Ratio | Bg Ratio | pvalue | p.adjust | qvalue | Count |
| hsa0411023 | Esophagus | ESCC | Cell cycle | 126/4205 | 157/8465 | 1.34e-15 | 5.60e-14 | 2.87e-14 | 126 |
| hsa0411033 | Esophagus | ESCC | Cell cycle | 126/4205 | 157/8465 | 1.34e-15 | 5.60e-14 | 2.87e-14 | 126 |
| hsa041102 | Liver | HCC | Cell cycle | 106/4020 | 157/8465 | 2.54e-07 | 3.04e-06 | 1.69e-06 | 106 |
| hsa041103 | Liver | HCC | Cell cycle | 106/4020 | 157/8465 | 2.54e-07 | 3.04e-06 | 1.69e-06 | 106 |
| hsa041108 | Oral cavity | OSCC | Cell cycle | 118/3704 | 157/8465 | 7.15e-16 | 2.66e-14 | 1.35e-14 | 118 |
| hsa0411015 | Oral cavity | OSCC | Cell cycle | 118/3704 | 157/8465 | 7.15e-16 | 2.66e-14 | 1.35e-14 | 118 |
| Page: 1 |
Top |
Cell-cell communication analysis |
| Identification of potential cell-cell interactions between two cell types and their ligand-receptor pairs for different disease states |
| Ligand | Receptor | LRpair | Pathway | Tissue | Disease Stage |
| Page: 1 |
Top |
Single-cell gene regulatory network inference analysis |
| Find out the significant the regulons (TFs) and the target genes of each regulon across cell types for different disease states |
| TF | Cell Type | Tissue | Disease Stage | Target Gene | RSS | Regulon Activity |
| ∗The dot plots of a searched regulon are shown for all cell subpopulations in each disease state of each tissue based on the regulon specific score inferred using pySCENIC and by calculating the average expression. |
| Page: 1 |
Top |
Somatic mutation of malignant transformation related genes |
| Annotation of somatic variants for genes involved in malignant transformation |
| Hugo Symbol | Variant Class | Variant Classification | dbSNP RS | HGVSc | HGVSp | HGVSp Short | SWISSPROT | BIOTYPE | SIFT | PolyPhen | Tumor Sample Barcode | Tissue | Histology | Sex | Age | Stage | Therapy Types | Drugs | Outcome |
| TRIP13 | SNV | Missense_Mutation | c.1029N>G | p.Ile343Met | p.I343M | Q15645 | protein_coding | deleterious(0) | possibly_damaging(0.779) | TCGA-BH-A0AW-01 | Breast | breast invasive carcinoma | Female | <65 | I/II | Chemotherapy | carboplatin | SD | |
| TRIP13 | SNV | Missense_Mutation | c.386C>T | p.Ala129Val | p.A129V | Q15645 | protein_coding | deleterious(0.03) | benign(0.282) | TCGA-BH-A18G-01 | Breast | breast invasive carcinoma | Female | >=65 | I/II | Unknown | Unknown | SD | |
| TRIP13 | SNV | Missense_Mutation | novel | c.769N>G | p.Leu257Val | p.L257V | Q15645 | protein_coding | deleterious(0) | probably_damaging(1) | TCGA-JW-A5VL-01 | Cervix | cervical & endocervical cancer | Female | <65 | I/II | Unknown | Unknown | SD |
| TRIP13 | SNV | Missense_Mutation | c.571N>T | p.Ala191Ser | p.A191S | Q15645 | protein_coding | deleterious(0) | probably_damaging(0.985) | TCGA-A6-2679-01 | Colorectum | colon adenocarcinoma | Female | >=65 | I/II | Unknown | Unknown | SD | |
| TRIP13 | SNV | Missense_Mutation | c.1039C>T | p.Arg347Cys | p.R347C | Q15645 | protein_coding | deleterious(0.03) | possibly_damaging(0.517) | TCGA-AA-3710-01 | Colorectum | colon adenocarcinoma | Female | >=65 | I/II | Unknown | Unknown | SD | |
| TRIP13 | SNV | Missense_Mutation | novel | c.333N>G | p.Asn111Lys | p.N111K | Q15645 | protein_coding | tolerated(0.62) | benign(0.013) | TCGA-CA-6717-01 | Colorectum | colon adenocarcinoma | Male | <65 | I/II | Chemotherapy | oxaliplatin | CR |
| TRIP13 | SNV | Missense_Mutation | novel | c.803C>A | p.Thr268Asn | p.T268N | Q15645 | protein_coding | tolerated(0.09) | benign(0.01) | TCGA-AP-A0LG-01 | Endometrium | uterine corpus endometrioid carcinoma | Female | <65 | I/II | Unknown | Unknown | SD |
| TRIP13 | SNV | Missense_Mutation | novel | c.401G>A | p.Gly134Glu | p.G134E | Q15645 | protein_coding | deleterious(0.01) | probably_damaging(0.913) | TCGA-AP-A0LM-01 | Endometrium | uterine corpus endometrioid carcinoma | Female | <65 | III/IV | Chemotherapy | cisplatin | SD |
| TRIP13 | SNV | Missense_Mutation | rs149881196 | c.614N>A | p.Arg205Gln | p.R205Q | Q15645 | protein_coding | tolerated(0.6) | benign(0.001) | TCGA-AP-A1DV-01 | Endometrium | uterine corpus endometrioid carcinoma | Female | <65 | I/II | Unknown | Unknown | SD |
| TRIP13 | SNV | Missense_Mutation | novel | c.709N>A | p.Gln237Lys | p.Q237K | Q15645 | protein_coding | tolerated(0.17) | benign(0.047) | TCGA-AX-A0J0-01 | Endometrium | uterine corpus endometrioid carcinoma | Female | <65 | I/II | Unknown | Unknown | SD |
| Page: 1 2 3 4 5 |
Top |
Related drugs of malignant transformation related genes |
| Identification of chemicals and drugs interact with genes involved in malignant transfromation |
| (DGIdb 4.0) |
| Entrez ID | Symbol | Category | Interaction Types | Drug Claim Name | Drug Name | PMIDs |
| Page: 1 |

Copyright 2023-Present -The University of Texas Health Science Center at Houston |