
|
|||||
|
 | |
| |
| |
| |
| |
| |
|
Gene: TRIM26 |
Gene summary for TRIM26 |
| Gene information | Species | Human | Gene symbol | TRIM26 | Gene ID | 7726 |
| Gene name | tripartite motif containing 26 | |
| Gene Alias | AFP | |
| Cytomap | 6p22.1 | |
| Gene Type | protein-coding | GO ID | GO:0002376 | UniProtAcc | A0A024RCP3 |
Top |
Malignant transformation analysis |
| Identification of the aberrant gene expression in precancerous and cancerous lesions by comparing the gene expression of stem-like cells in diseased tissues with normal stem cells |
| Entrez ID | Symbol | Replicates | Species | Organ | Tissue | Adj P-value | Log2FC | Malignancy |
| 7726 | TRIM26 | CCI_2 | Human | Cervix | CC | 1.05e-06 | 7.12e-01 | 0.5249 |
| 7726 | TRIM26 | CCI_3 | Human | Cervix | CC | 5.33e-05 | 4.66e-01 | 0.516 |
| 7726 | TRIM26 | LZE4T | Human | Esophagus | ESCC | 6.14e-07 | 2.06e-01 | 0.0811 |
| 7726 | TRIM26 | LZE7T | Human | Esophagus | ESCC | 3.11e-03 | 2.05e-01 | 0.0667 |
| 7726 | TRIM26 | LZE8T | Human | Esophagus | ESCC | 2.74e-08 | 1.87e-01 | 0.067 |
| 7726 | TRIM26 | LZE20T | Human | Esophagus | ESCC | 1.02e-02 | 1.52e-01 | 0.0662 |
| 7726 | TRIM26 | LZE22T | Human | Esophagus | ESCC | 9.82e-04 | 2.86e-01 | 0.068 |
| 7726 | TRIM26 | LZE24T | Human | Esophagus | ESCC | 2.22e-18 | 4.63e-01 | 0.0596 |
| 7726 | TRIM26 | LZE21T | Human | Esophagus | ESCC | 2.52e-05 | 2.36e-01 | 0.0655 |
| 7726 | TRIM26 | LZE6T | Human | Esophagus | ESCC | 1.36e-06 | 1.52e-01 | 0.0845 |
| 7726 | TRIM26 | P1T-E | Human | Esophagus | ESCC | 8.79e-14 | 5.94e-01 | 0.0875 |
| 7726 | TRIM26 | P2T-E | Human | Esophagus | ESCC | 3.68e-31 | 5.40e-01 | 0.1177 |
| 7726 | TRIM26 | P4T-E | Human | Esophagus | ESCC | 1.62e-21 | 3.30e-01 | 0.1323 |
| 7726 | TRIM26 | P5T-E | Human | Esophagus | ESCC | 1.19e-18 | 2.30e-01 | 0.1327 |
| 7726 | TRIM26 | P8T-E | Human | Esophagus | ESCC | 6.78e-19 | 3.42e-01 | 0.0889 |
| 7726 | TRIM26 | P9T-E | Human | Esophagus | ESCC | 4.85e-09 | 1.97e-01 | 0.1131 |
| 7726 | TRIM26 | P10T-E | Human | Esophagus | ESCC | 2.20e-15 | 1.44e-01 | 0.116 |
| 7726 | TRIM26 | P11T-E | Human | Esophagus | ESCC | 1.48e-11 | 4.89e-01 | 0.1426 |
| 7726 | TRIM26 | P12T-E | Human | Esophagus | ESCC | 7.03e-21 | 4.00e-01 | 0.1122 |
| 7726 | TRIM26 | P15T-E | Human | Esophagus | ESCC | 1.05e-07 | 2.56e-01 | 0.1149 |
| Page: 1 2 3 4 5 |
| Tissue | Expression Dynamics | Abbreviation |
| Cervix | 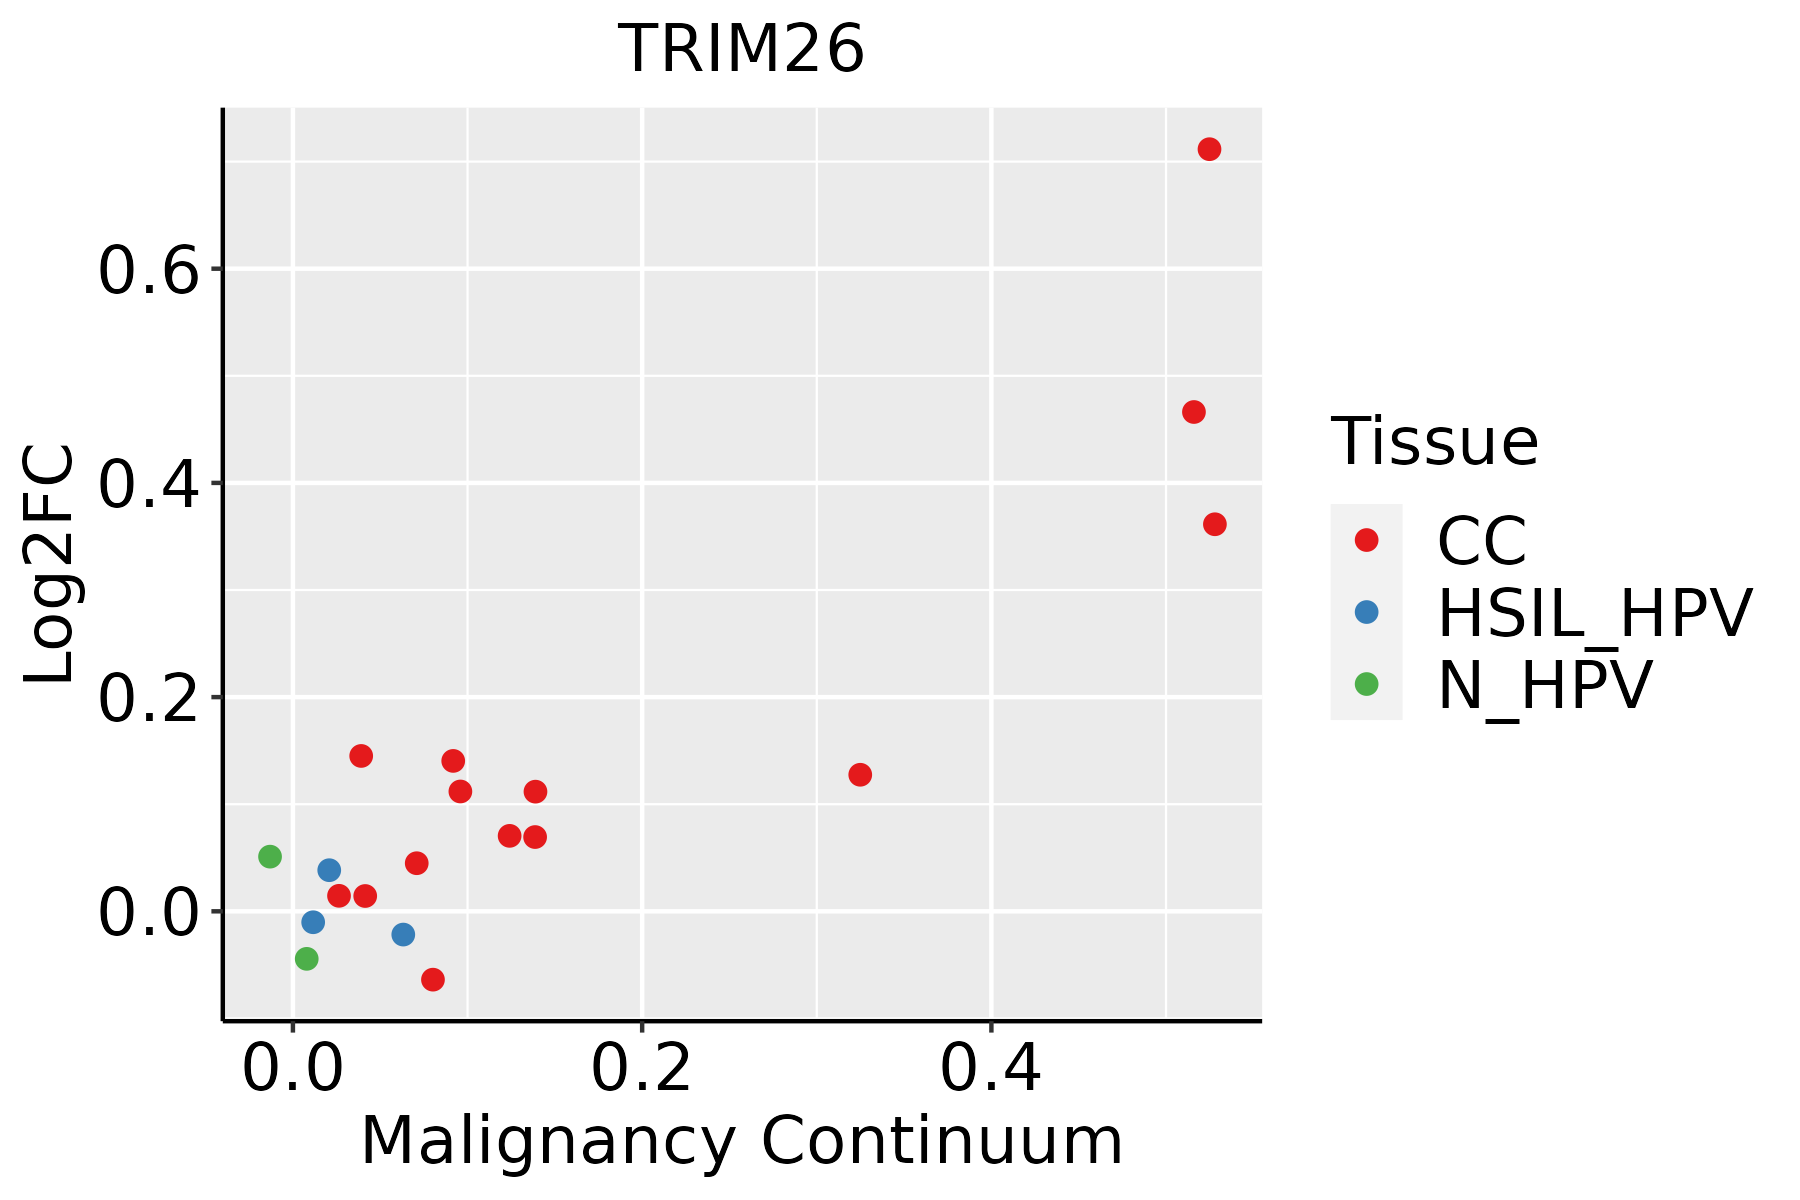 | CC: Cervix cancer |
| HSIL_HPV: HPV-infected high-grade squamous intraepithelial lesions | ||
| N_HPV: HPV-infected normal cervix | ||
| Esophagus |  | ESCC: Esophageal squamous cell carcinoma |
| HGIN: High-grade intraepithelial neoplasias | ||
| LGIN: Low-grade intraepithelial neoplasias | ||
| Liver | 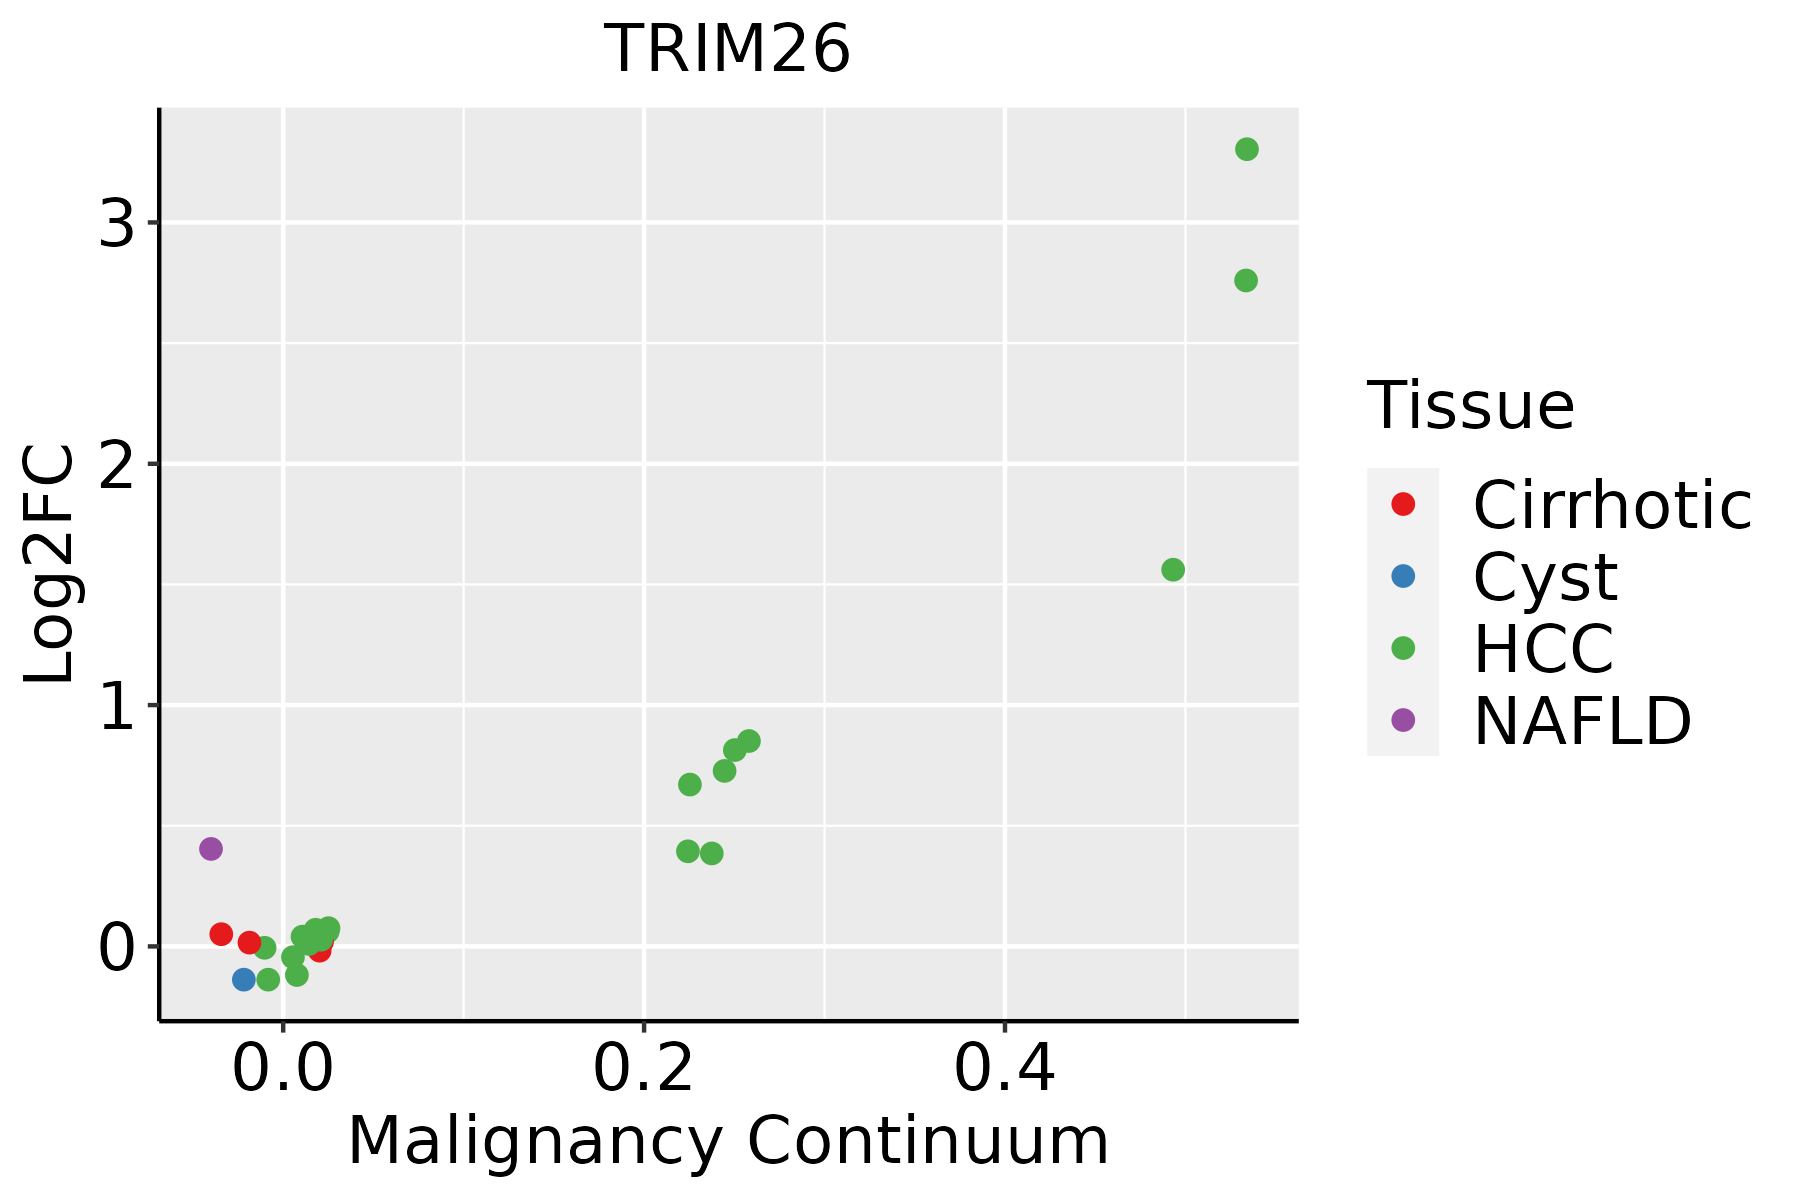 | HCC: Hepatocellular carcinoma |
| NAFLD: Non-alcoholic fatty liver disease | ||
| Lung | 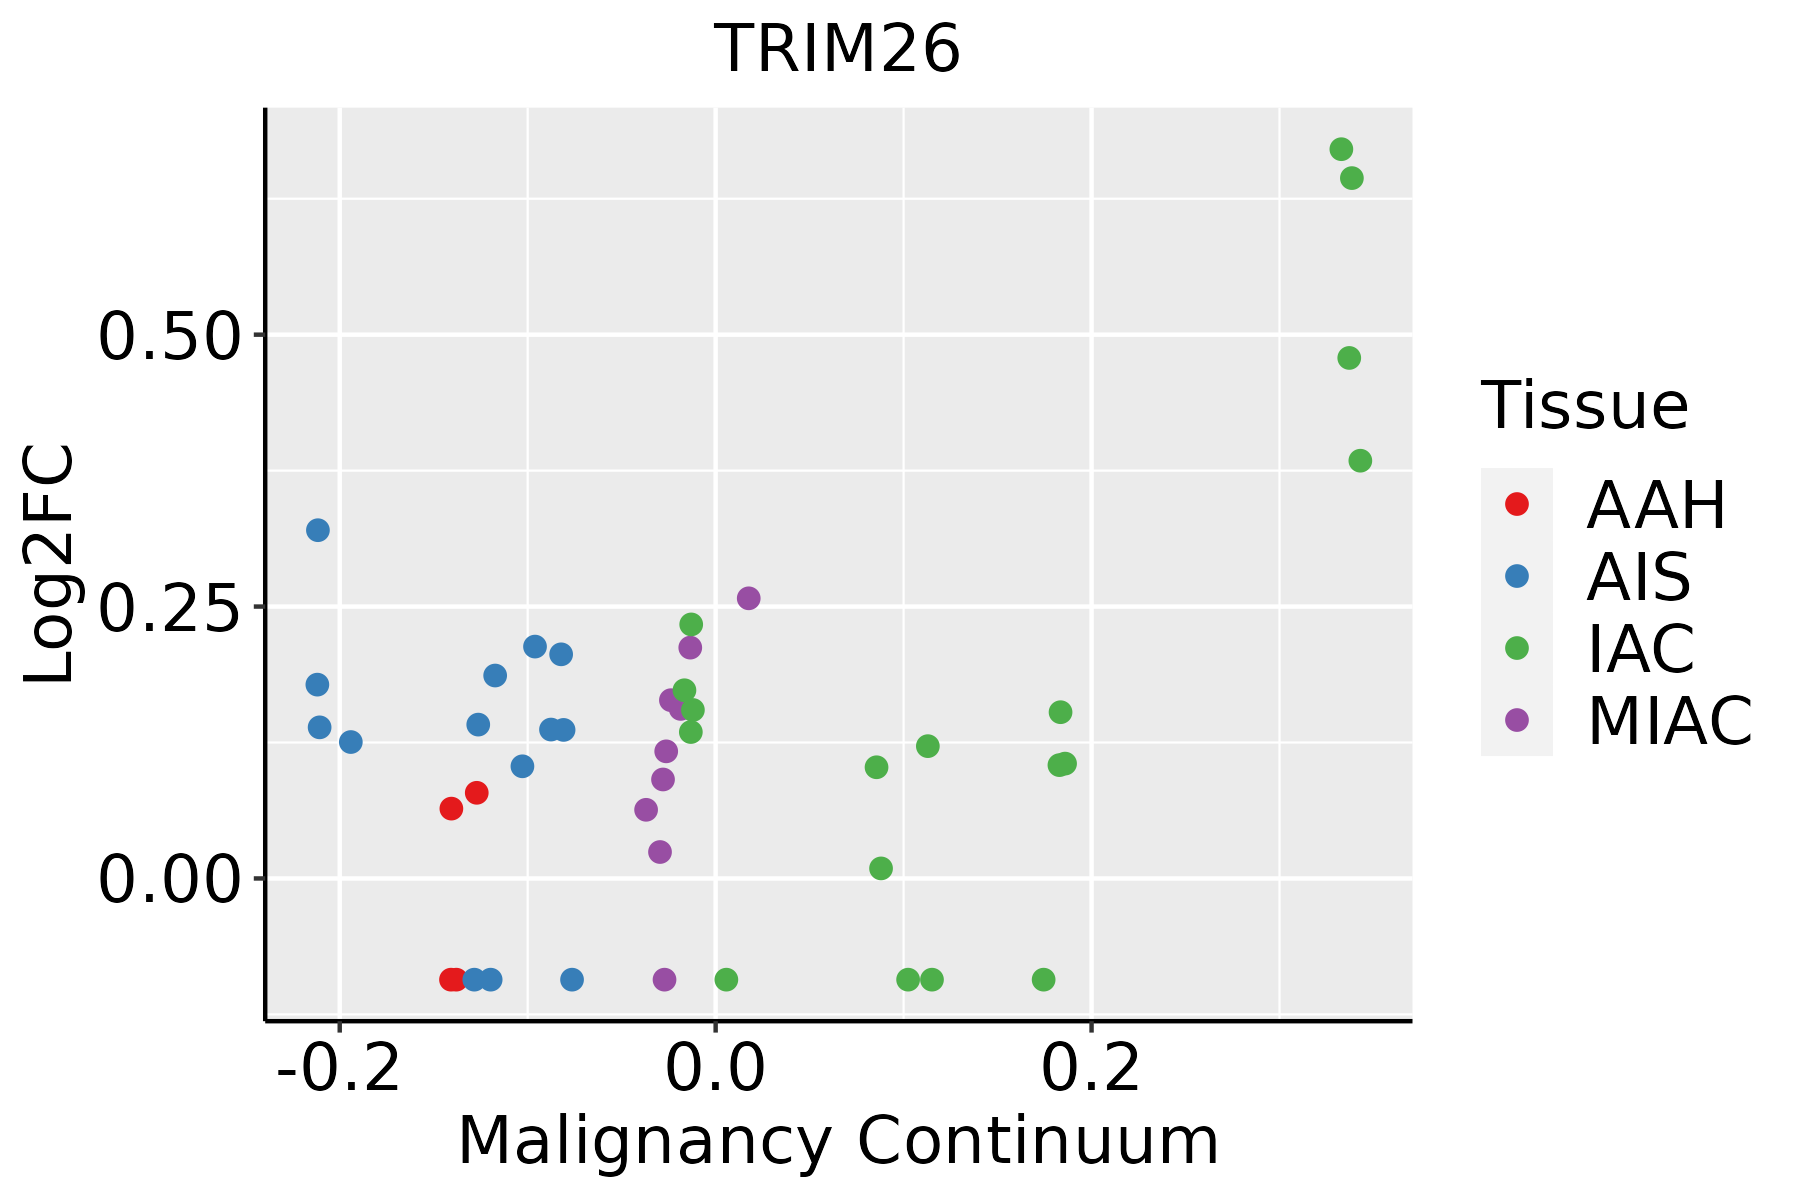 | AAH: Atypical adenomatous hyperplasia |
| AIS: Adenocarcinoma in situ | ||
| IAC: Invasive lung adenocarcinoma | ||
| MIA: Minimally invasive adenocarcinoma | ||
| Oral Cavity | 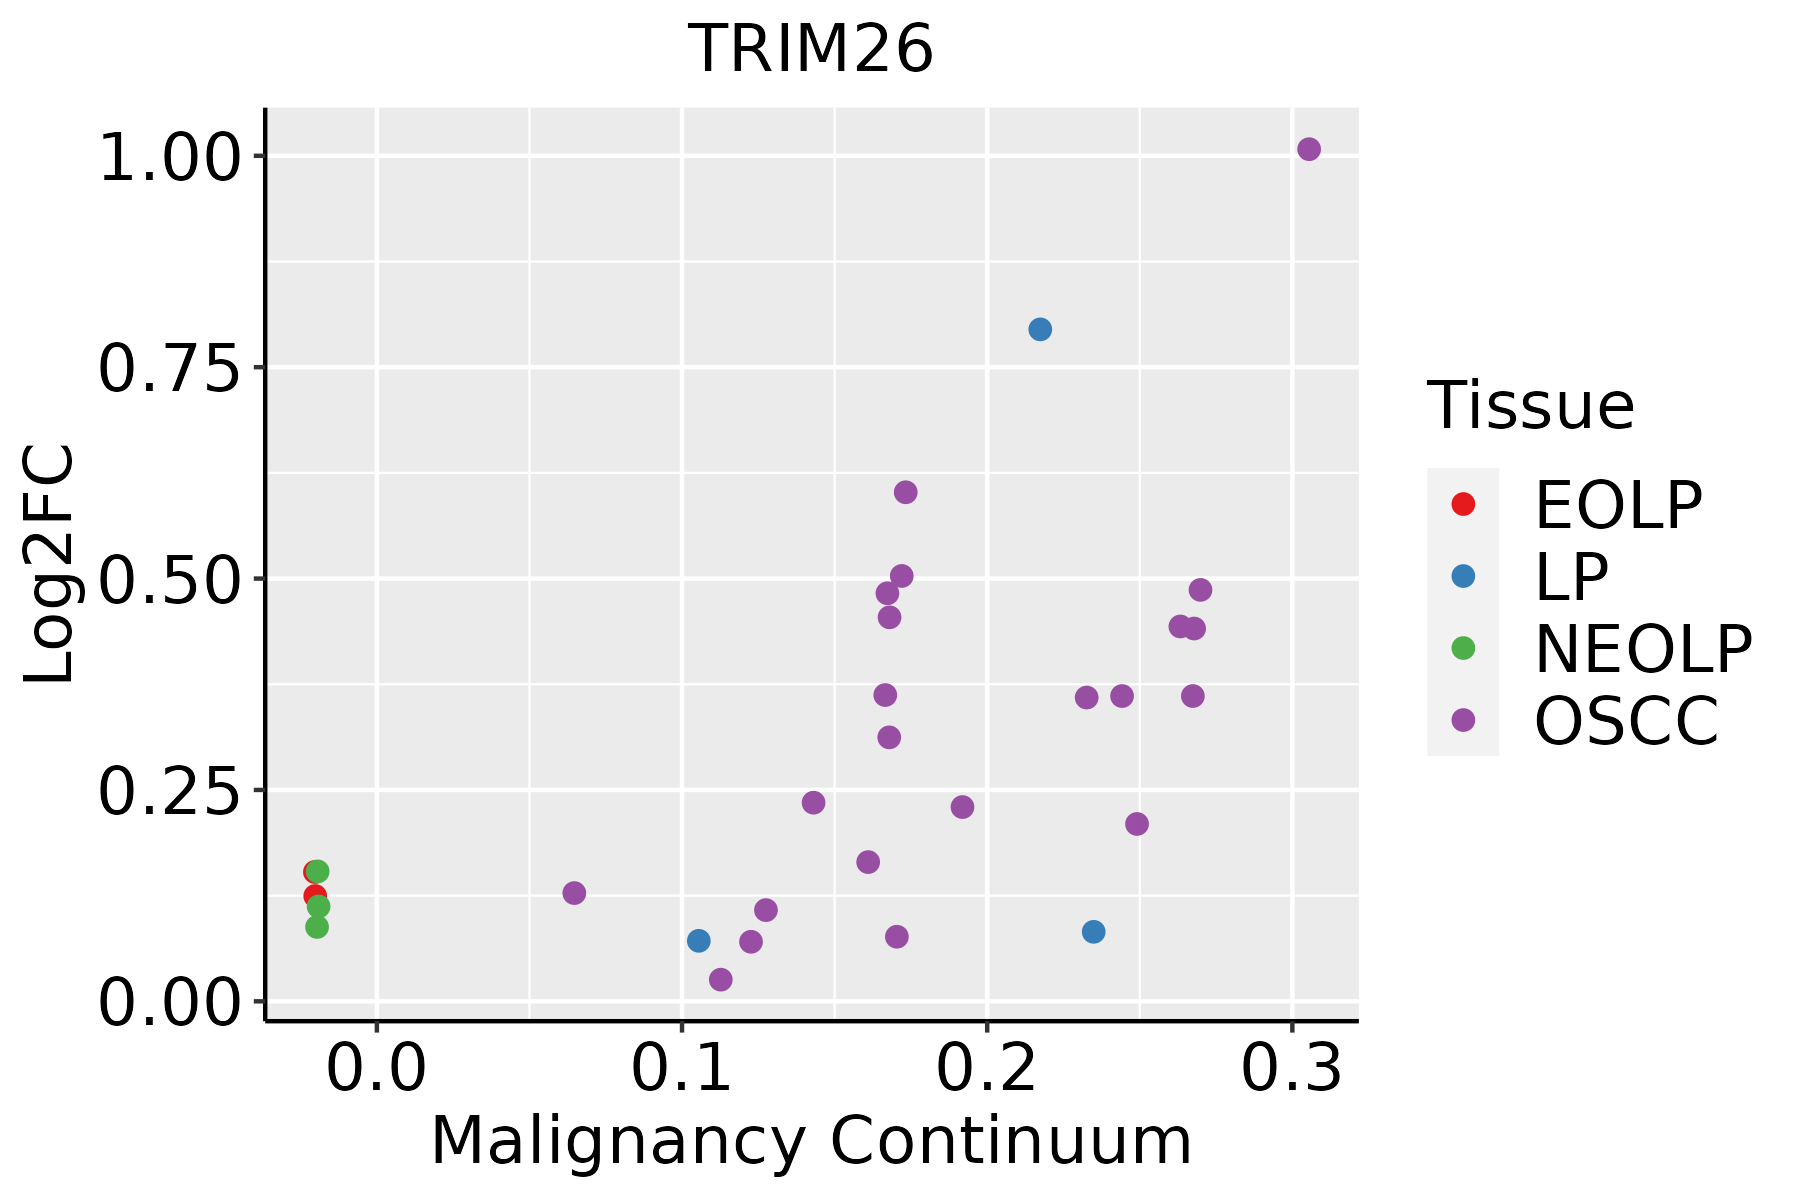 | EOLP: Erosive Oral lichen planus |
| LP: leukoplakia | ||
| NEOLP: Non-erosive oral lichen planus | ||
| OSCC: Oral squamous cell carcinoma | ||
| Prostate |  | BPH: Benign Prostatic Hyperplasia |
| ∗log2FC in expression of this searched gene in stem-like cells from each diseased tissue sample relative to stem-like cells in normal samples in each tissue plotted against the malignancy continuum. Samples are colored based on if they are from different disease stage. |
Top |
Malignant transformation related pathway analysis |
| Find out the enriched GO biological processes and KEGG pathways involved in transition from healthy to precancer to cancer |
| Tissue | Disease Stage | Enriched GO biological Processes |
| Colorectum | AD |  |
| Colorectum | SER |  |
| Colorectum | MSS |  |
| Colorectum | MSI-H |  |
| Colorectum | FAP |  |
| ∗Top 15 enriched GO BP terms are showed in the bar plot of each disease state in each tissue. Each row represents a significant GO biological process which is colored according to the -log10(p.adjust). |
| Page: 1 2 3 4 5 6 7 8 9 |
| GO ID | Tissue | Disease Stage | Description | Gene Ratio | Bg Ratio | pvalue | p.adjust | Count |
| GO:004671812 | Liver | HCC | viral entry into host cell | 83/7958 | 144/18723 | 1.73e-04 | 1.36e-03 | 83 |
| GO:19021861 | Liver | HCC | regulation of viral release from host cell | 20/7958 | 26/18723 | 3.82e-04 | 2.61e-03 | 20 |
| GO:004390311 | Liver | HCC | regulation of biological process involved in symbiotic interaction | 45/7958 | 72/18723 | 4.86e-04 | 3.19e-03 | 45 |
| GO:00510902 | Liver | HCC | regulation of DNA-binding transcription factor activity | 220/7958 | 440/18723 | 8.04e-04 | 4.82e-03 | 220 |
| GO:00510913 | Liver | HCC | positive regulation of DNA-binding transcription factor activity | 131/7958 | 260/18723 | 5.98e-03 | 2.45e-02 | 131 |
| GO:19039013 | Liver | HCC | negative regulation of viral life cycle | 17/7958 | 25/18723 | 8.94e-03 | 3.45e-02 | 17 |
| GO:005237211 | Liver | HCC | modulation by symbiont of entry into host | 29/7958 | 49/18723 | 1.37e-02 | 4.86e-02 | 29 |
| GO:00160328 | Lung | IAC | viral process | 94/2061 | 415/18723 | 5.11e-12 | 4.27e-09 | 94 |
| GO:00190588 | Lung | IAC | viral life cycle | 77/2061 | 317/18723 | 1.23e-11 | 4.83e-09 | 77 |
| GO:00521268 | Lung | IAC | movement in host environment | 48/2061 | 175/18723 | 1.30e-09 | 2.21e-07 | 48 |
| GO:00517018 | Lung | IAC | biological process involved in interaction with host | 52/2061 | 203/18723 | 3.74e-09 | 5.84e-07 | 52 |
| GO:00467188 | Lung | IAC | viral entry into host cell | 41/2061 | 144/18723 | 6.27e-09 | 9.08e-07 | 41 |
| GO:00444098 | Lung | IAC | entry into host | 42/2061 | 151/18723 | 8.80e-09 | 1.19e-06 | 42 |
| GO:00444038 | Lung | IAC | biological process involved in symbiotic interaction | 63/2061 | 290/18723 | 8.57e-08 | 8.34e-06 | 63 |
| GO:00507928 | Lung | IAC | regulation of viral process | 37/2061 | 164/18723 | 1.56e-05 | 4.51e-04 | 37 |
| GO:00510903 | Lung | IAC | regulation of DNA-binding transcription factor activity | 76/2061 | 440/18723 | 4.44e-05 | 1.05e-03 | 76 |
| GO:00510914 | Lung | IAC | positive regulation of DNA-binding transcription factor activity | 50/2061 | 260/18723 | 5.87e-05 | 1.29e-03 | 50 |
| GO:00439038 | Lung | IAC | regulation of biological process involved in symbiotic interaction | 20/2061 | 72/18723 | 6.79e-05 | 1.45e-03 | 20 |
| GO:00523726 | Lung | IAC | modulation by symbiont of entry into host | 15/2061 | 49/18723 | 1.66e-04 | 2.96e-03 | 15 |
| GO:19039008 | Lung | IAC | regulation of viral life cycle | 31/2061 | 148/18723 | 3.07e-04 | 4.89e-03 | 31 |
| Page: 1 2 3 4 5 6 7 8 |
| Pathway ID | Tissue | Disease Stage | Description | Gene Ratio | Bg Ratio | pvalue | p.adjust | qvalue | Count |
| Page: 1 |
Top |
Cell-cell communication analysis |
| Identification of potential cell-cell interactions between two cell types and their ligand-receptor pairs for different disease states |
| Ligand | Receptor | LRpair | Pathway | Tissue | Disease Stage |
| Page: 1 |
Top |
Single-cell gene regulatory network inference analysis |
| Find out the significant the regulons (TFs) and the target genes of each regulon across cell types for different disease states |
| TF | Cell Type | Tissue | Disease Stage | Target Gene | RSS | Regulon Activity |
| ∗The dot plots of a searched regulon are shown for all cell subpopulations in each disease state of each tissue based on the regulon specific score inferred using pySCENIC and by calculating the average expression. |
| Page: 1 |
Top |
Somatic mutation of malignant transformation related genes |
| Annotation of somatic variants for genes involved in malignant transformation |
| Hugo Symbol | Variant Class | Variant Classification | dbSNP RS | HGVSc | HGVSp | HGVSp Short | SWISSPROT | BIOTYPE | SIFT | PolyPhen | Tumor Sample Barcode | Tissue | Histology | Sex | Age | Stage | Therapy Types | Drugs | Outcome |
| TRIM26 | SNV | Missense_Mutation | novel | c.61N>C | p.Asp21His | p.D21H | Q12899 | protein_coding | deleterious(0.03) | probably_damaging(0.996) | TCGA-AC-A6IW-01 | Breast | breast invasive carcinoma | Female | >=65 | I/II | Unknown | Unknown | SD |
| TRIM26 | SNV | Missense_Mutation | rs747865368 | c.770N>T | p.Thr257Met | p.T257M | Q12899 | protein_coding | tolerated(0.08) | possibly_damaging(0.582) | TCGA-AN-A03Y-01 | Breast | breast invasive carcinoma | Female | >=65 | I/II | Unknown | Unknown | SD |
| TRIM26 | SNV | Missense_Mutation | rs773245215 | c.1601N>A | p.Arg534His | p.R534H | Q12899 | protein_coding | deleterious(0.02) | possibly_damaging(0.664) | TCGA-AN-A0AK-01 | Breast | breast invasive carcinoma | Female | >=65 | I/II | Unknown | Unknown | SD |
| TRIM26 | SNV | Missense_Mutation | novel | c.946A>G | p.Thr316Ala | p.T316A | Q12899 | protein_coding | tolerated(0.14) | probably_damaging(0.91) | TCGA-2W-A8YY-01 | Cervix | cervical & endocervical cancer | Female | <65 | I/II | Chemotherapy | cisplatin | CR |
| TRIM26 | SNV | Missense_Mutation | c.1568N>C | p.Val523Ala | p.V523A | Q12899 | protein_coding | deleterious(0.01) | benign(0.067) | TCGA-C5-A7UE-01 | Cervix | cervical & endocervical cancer | Female | <65 | I/II | Chemotherapy | cisplatin | SD | |
| TRIM26 | SNV | Missense_Mutation | novel | c.1198N>A | p.Glu400Lys | p.E400K | Q12899 | protein_coding | tolerated(0.52) | benign(0) | TCGA-AA-3947-01 | Colorectum | colon adenocarcinoma | Female | <65 | I/II | Unknown | Unknown | SD |
| TRIM26 | SNV | Missense_Mutation | novel | c.857N>G | p.Phe286Cys | p.F286C | Q12899 | protein_coding | deleterious(0) | possibly_damaging(0.907) | TCGA-CA-6717-01 | Colorectum | colon adenocarcinoma | Male | <65 | I/II | Chemotherapy | oxaliplatin | CR |
| TRIM26 | SNV | Missense_Mutation | c.109N>T | p.Arg37Cys | p.R37C | Q12899 | protein_coding | deleterious(0.01) | probably_damaging(0.997) | TCGA-CK-4948-01 | Colorectum | colon adenocarcinoma | Female | <65 | III/IV | Unknown | Unknown | SD | |
| TRIM26 | SNV | Missense_Mutation | c.1385N>T | p.Ala462Val | p.A462V | Q12899 | protein_coding | deleterious(0.02) | benign(0.01) | TCGA-D5-6540-01 | Colorectum | colon adenocarcinoma | Male | >=65 | I/II | Unknown | Unknown | SD | |
| TRIM26 | SNV | Missense_Mutation | c.278N>A | p.Thr93Asn | p.T93N | Q12899 | protein_coding | tolerated(0.39) | benign(0.199) | TCGA-DM-A1D8-01 | Colorectum | colon adenocarcinoma | Female | <65 | III/IV | Unknown | Unknown | SD |
| Page: 1 2 3 4 5 6 |
Top |
Related drugs of malignant transformation related genes |
| Identification of chemicals and drugs interact with genes involved in malignant transfromation |
| (DGIdb 4.0) |
| Entrez ID | Symbol | Category | Interaction Types | Drug Claim Name | Drug Name | PMIDs |
| Page: 1 |

Copyright 2023-Present -The University of Texas Health Science Center at Houston |